
 ?Mathematical formulae have been encoded as MathML and are displayed in this HTML version using MathJax in order to improve their display. Uncheck the box to turn MathJax off. This feature requires Javascript. Click on a formula to zoom.
ABSTRACT
Recent years have witnessed the emergence of a growing literature bemoaning the level of quantitative methods provision within the U.K. Higher Education sector, noting its negative impact upon the subsequent skills of graduates and their preparedness for the workplace. The present paper documents and evaluates an attempt to counter these issues via the introduction of an increasing element of flexible learning on a business and financial forecasting module. Using a mixture of empirical methods, it is shown that flexible learning results in improvements in student performance and ability across a range of metrics. It is argued that ‘broad’ forms of flexible learning can be employed to overcome the concerns of an increasingly negative literature on quantitative methods provision and the subsequent skills levels of students.
1. Introduction
‘In universities in the USA, Germany, the Netherlands, Belgium and Switzerland students typically develop much better quantitative skills than in even the best UK degree programmes because they are at the centre of the curriculum. Too often in the UK they languish in the margins.’ (Count Us In: Quantitative Skills for a New Generation, British Academy, Citation2015, p. 11)
This observation offers a disappointing assessment of quantitative methods in the UK Higher Education sector, one that is reiterated in numerous studies which all ultimately question the preparedness of graduates for the workplace (see, inter alia, British Academy, Citation2012; MacInnes, Breeze, de Haro, Kandlik, & Karels, Citation2016; Mason, Nathan, & Rosso, Citation2015). Redressing this perceived deficit is a complex proposition which cannot be achieved by simply increasing quantitative methods provision content given the numerous factors that impact on student performance and influence engagement with quantitative methods modules. These factors include: the low confidence and anxieties of students in connection with quantitative methods; a perceived steep learning curve; and inconsistent expectations of the level of mathematical content at undergraduate level (British Academy, Citation2012; Carey, Hill, Devine, & Szücs, Citation2016; Dawson, Citation2014; Economics Network, Citation2012; Hembree, Citation1990). Given these primarily psychological blocks to the subject, an unconsidered increase in quantitative provision could generate counteracting effects which worsen, rather than resolve, engagement with the subject. This paper argues that flexible learning methods are a vital inclusion to minimise the negative impact of these significant factors when ensuring appropriately high levels of quantitative methods provision.
To demonstrate the importance of flexible learning, we target a particularly quantitatively demanding undergraduate module at Swansea University. The module, Business and Financial Forecasting, is based in the School of Management and made available to all finalists. The selection of this module reflects two important issues. First, there is an increased risk of disconnect between student expectations and the module’s learning outcomes. While it is available to students from a student population who have a diverse experience in using mathematical analysis, the technical demands of the module are high. Overall, it requires the understanding and application of a myriad of mathematical and statistical methods. Any impact of flexible learning on student outcomes, assuming its positive influence on student engagement, should therefore be apparent in this type of module. Second, given the module is designed for Social Scientists, this research is particularly relevant to the national debate that implicates the Social Sciences as a major area in which quantitative methods are in deficit. This is reflected by the Economic and Social Research Council, Higher Education Funding Council for England, British Academy and Nuffield Foundation co-funded Quantitative Methods Initiative which identifies a deficit in skills and seeks to support improved understanding of quantitative social science.
Our governing tactic is to develop methods which meet the high technical demands expected of this type of module in an accessible and engaging manner that addresses the plaguing issue of self-efficacy. It involves the integration of e-learning materials which have been incorporated in the module since its inception in 2013–14.Footnote1,Footnote2 These materials (discussed in more detail below) have an interactive design and differ significantly from the traditional material provided in lecture and workshop environments. Importantly, they facilitate multiple objectives: revealing the intuition behind complex statistical methods; displaying the logical processes involved in alternative approaches; and permitting the generation of additional data-based examples to assist learning. Throughout the materials, ‘replication’ is promoted as a tool to build confidence as clear objectives are presented for students to work towards at their own pace and offer a focus which challenges students’ understanding without inhibiting their activities.
The incorporation of e-learning has inspired a radical re-organisation of the module. Changes include: the utilisation of a ‘flipped classroom’ format where contact hours are modified in response to changes in student working practices ahead of, and following, classroom sessions; the incorporation of student-led sessions allowing a non-didactic approach to learning; and, the provision of formative assessment methods to support self-efficacy. This paper is structured to demonstrate how this occurs. The next section locates our research within the general literature and raises issues related to the precarious position of quantitative methods in U.K. higher education. The identified skills gap in quantitative methods is reviewed ahead of discussing associated research into anxiety and student perceptions in relation to mathematical and statistical methods. Section [3] provides a discussion of flexible learning and considers its relationship with the increasingly popular concept of the flipped classroom. Section [4] finds the method detailed, highlighting the structure of the flexible learning processes that are adopted. This permits a unique empirical analysis into the impact of these materials on student performance in Section [5]. Rather than simply consider aggregate performance on the module through time, this analysis investigates the performance of students on this module relative to their performance across all other modules in their final year of undergraduate study. This approach, acknowledging the numerous factors which influence student performance (Pokorny & Pokorny, Citation2005), addresses the complicating factor of cohort effects. It therefore enables focus on (i) the performance of students on this specific quantitative methods module relative to the performance of these students elsewhere and (ii) how this has changed over time as increased flexible learning materials have been introduced. Additionally, to allow consideration of potential asymmetries in the distribution of module marks, non-parametric testing is provided. This empirical approach allows us to consider possible ‘separation’ of students across the marking distribution where, for example, a small number of students are located at one end of the range compared to a clustering at the other. As will be discussed, the empirical analysis allows consideration of the underlying motivations of students and the resulting of this upon performance. Section [6] concludes.
2. Quantitative skills in UK Higher Education
‘..many degree courses have evolved in a non-quantitative direction in order to cope with students’ QS [quantitative skills] deficiencies’ (Mason et al., Citation2015, p. 63)
The above captures the growing concern presented by the quantitative skills deficit in the U.K. Higher Education sector. This message has been reiterated on numerous occasions in an expanding literature that has generated a consensus that deficiencies in the provision of quantitative methods restricts the skills delivered by tertiary education. The British Academy’s Society Counts report of 2012, for example, is downbeat when reviewing the low levels of quantitative skills achieved, particularly within the Social Sciences. The damning account of MacInnes et al. (Citation2016) comments on limited prior quantitative knowledge of students, which is then compounded by subsequent inadequacies of encouragement and opportunity to cement quantitative skills. These concerns were similarly expressed a year previously in the British Academy’s Count Us In report of 2015. Any deficiency in quantitative training must be seen as a pre-cursor to the employability issues raised in the Department of Business, Innovation and Skills Market Assessment of Public Sector Information report of 2013. Referring repeatedly to a skills shortage in the workplace created by the quantitative methods deficit, this specifically highlights ‘a lack of skills and familiarity to work effectively with data’ (Department of Business, Innovation and Skills, Citation2013, p. 34). Clearly, the provision of quantitative methods training and level of resulting skills in the workplace are directly related, a point captured succinctly in the following quote from the Society Counts report:
‘Students often graduate with little confidence in applying what skills they do have, which then has knock-on effects for businesses as graduates can be ill-prepared for the data demands of the workplace.’ (British Academy, Citation2012, p. 10).
An interesting specific case study into quantitative methods, however, is offered by undergraduate degrees in Economics. While concluding that the quantitative skills deficit is most apparent for the social sciences, the above studies typically note Economics as an exception. Arguably this reflects recognition that technical modules tend to be embedded within all levels of study in Economics. However, despite this positive view, there is nonetheless evidence of deterioration. For example, the Employers’ Survey conducted by the Economics Network provides an examination of employers’ demands for graduate skills and flags quantitative skills as an increasingly problematic issue. Thus, while the 2014–15 Employers’ Survey (Economics Network, Citation2015) found data-based and IT skills to be vitally important to employers, there is a noted decline in the skill levels of economics graduates relative to the previous 2012 survey (Economics Network, Citation2012). In addition, there is research which questions how quantitative methods are taught within Economics. For example, Dawson (Citation2014) refers to a ‘mathematics problem’ (p. 22) which includes the challenge of a ‘steep learning curve’ (p. 6) in relation to quantitative methods. Further to this, the 2012 National Economics Students Survey refers to student perceptions of unexpectedly high levels of, and heavy emphasis placed upon, mathematics. Rethinking Economics, an international network of students, academics and professionals, go as far to quote Kenneth Boulding’s ‘Mathematics brought rigor to economics. Unfortunately, it also brought mortis’. Overall, these findings suggest that Economics is not immune to problems associated with quantitative methods training and the difficulties encountered can be used to query the solution to any perceived deficit. The call for action in the Count Us In report is to ‘ratchet up the quantitative content of social science and humanities programmes’ (British Academy, Citation2015, p. 15). However, experiences in Economics illustrate that an increase in quantitative content will not create automatic gains. Consequently, rather than just targeting the frequency and volume of quantitative methods provision, the focus here is broadened to consider the nature of the pedagogical methods utilised in the delivery of quantitative methods teaching.
The dilemma created by the need to intensify quantitative provision is also starkly evident in the anxiety-performance literature. Here, it can be found that an increase in poorly constructed quantitative provision could be detrimental. The research, spanning three decades, from Hembree (Citation1990) to Dowker, Sarkar, and Looi (Citation2016), presents numerous instances of how anxiety in mathematical and statistical disciplines impairs student performance. Aspects of this discourse focus on curriculum design and reveal how anxiety can be specific to perceptions over the nature of the content: i.e. whether it is more mathematical or statistical (Paechter, Macher, Martskvishvili, Wimmer, & Papousek, Citation2017). Additionally, the literature highlights issues and biases which could significantly impair goals in key areas such as widening participation. For example, there are notable gender differences in anxiety-performance relationships (Dowker et al., Citation2016; Macher et al., Citation2013). Overall, while it is apparent that revisions to quantitative methods provision may be required to ensure an appropriate level and volume of coverage, this must be undertaken in an accessible manner that does not increase anxiety and enhances, rather than damages, self-efficacy.
3. Flexible learning
With the advent of the massification of Higher Education, the introduction of tuition fees and the increasing importance of metrics such as league tables and the National Student Survey, alternative teaching methods and their effectiveness have come under increasing scrutiny. A prominent feature of this discussion involves the role of the ‘traditional’ lecture in modern day delivery.Footnote3 Key papers here include Bligh (Citation2000), Folley (Citation2010) and Gibbs (Citation2013), all of which provide highly critical commentaries of the effectiveness of the lecture format. Limitations to the lecture format are advertised further through problems such as catering for a diverse cohort of learners (Schmidt, Wagener, Smeets, Keemink, & van der Molen, Citation2015) and the student preference for self-paced learning (McFarlin, Citation2008).
From this growing literature on the limitations of the traditional lecture format, the leading alternative is currently the flipped classroom. The notion of ‘flipping’ can be considered as involving an inverted classroom in which computer-based instruction outside the classroom allows face-to-face delivery to become more interactive (Bergmann & Sams, Citation2012; Bishop & Verleger, Citation2013). However, despite its intuitive appeal, evidence on the impact of flipping has proved to be mixed; with substantial positive effects (Chen & Lin, Citation2012), small positive effects (Caviglia-Harris, Citation2016; Olitsky & Cosgrove, Citation2016), no effect (Blair, Maharaj, & Primus, Citation2016; Brown & Liedholm, Citation2002; Guerrero, Beal, Lamb, Sonderegger, & Baumgartel, Citation2015; Olitsky & Cosgrove, Citation2013; Sparks, Citation2013; Terry & Lewer, Citation2003) and even negative effects (Kwak, Menezes, & Sherwood, Citation2015) reported in the literature. In an attempt to understand these mixed findings, Webb, Watson, and Cook (Citation2018) consider potential explanatory factors which may impair the impact on student performance. The two factors considered are the inherent motivations of students and the nature of the method of the flipping employed. Regarding student motivation, Harackiewicz, Barron, Carter, Lehto, and Elliot (Citation1997) and Allgood (Citation2001) are used to recognise that the impact of flipping may be clouded by ‘grade targeting’ behaviour. Here, students adopt a minimum mark that is deemed to be satisfactory. Rather than generating an improvement in student performance, the pedagogical approach can just make it easier for the student to achieve this ‘reservation mark’. Turning to the design of ‘flipped’ materials, Webb et al. (Citation2018) decompose formats into ‘constrained’ and ‘broad’ forms. ‘Constrained’ flipping relates to the commonly adopted approach of providing standard lecture material online, with lectures recorded via video capture software being a popular choice. The beneficial aspect of this approach is seen to be time freed in the classroom, enabling more interactive activities to be pursued. In contrast, ‘broad’ flipping occurs when the material provided for study outside of the classroom offers something different to the standard lecture coverage. The results of Webb et al. (Citation2018) for the teaching of economic theory show that it is only ‘broad’ flipping which improves student performance. Under this approach, e-learning materials are constructed from the outset in an unstructured way. No conclusions are provided and there is no single means to engage with the material. Numerous stand-alone perspectives are presented, allowing students to decide themselves how they should consider the information. Twinning the theory with real-world practical applications, the materials are constructed to empower students in how they engage.
The current study adopts an approach which is in keeping with that of Webb et al. (Citation2018). Although it considers a different subject matter, focusing on technical analysis rather than critical analysis, it adopts a broad flipping approach designed to allow student choice in the engagement with the online materials. As such, the views of Watson, Webb, Cook, and Arico (Citation2015), Ryan and Tilbury (Citation2013), French and Kennedy (Citation2017) and Matheson and Sutcliffe (Citation2017) are shared, favouring the integration of both learner empowerment and more inventive use of classroom time.
4. The E-learning approach
‘IT and mathematical skills are interdependent’, Hoyles, Wolf, Molyneux-Hodgson, and Kent (Citation2002, p. 3)
The module developed in this paper involves 30 hours of classroom interaction. We build on this traditional staff-student interaction, by introducing a flexible learning approach based on the provision of extensive e-learning materials. Details of these materials are given in .
Table 1. Flexible learning materials.
In addition to providing a brief title, provides the date of publication and the recorded access statistics for each set of materials.Footnote4 While varied in terms of content and focus, all materials are based on providing students with self-contained packages of flexible learning materials which include a complete coverage of a specific topic incorporating explanatory materials, data-based examples, references to published research and interactive computer-based elements.Footnote5 The computer-based interaction presented in the resources is in keeping with Gordon (Citation2014) which describes the manner in which technology creates opportunities for flexible learning. The constructed materials are designed to encompass and extend both lecture and computer workshop activities, while also giving illustrative examples to demonstrate the applied nature of the methods being used. Importantly, and as is explained below, these materials differ from the standard lecture notes or data sets often provided for modules, offering instead something different and complementary in nature. Also, these materials allow students to work through topics at their own pace and at their convenience from any location and hence meet the Advance HE view that flexible learning should enable ‘choice and responsiveness in the pace, place and mode of learning’ (Ryan & Tilbury, Citation2013, p. 8). Moreover, as expressed by Hoyles et al. (Citation2002), the computer-based approach adopted also builds on the interdependent nature of mathematics and IT skills, with the development of skills in mathematics working conjointly with the accessible framework provided by IT. This generates further positive employability spillovers:
‘the widespread use of Information Technology (IT) in workplaces has not reduced the need for QS [quantitative skills] but rather changed the nature of the skills required (for example, with employees needing to understand the underlying models used by computer software in order to make effective and accurate use of it)’ (Mason et al., Citation2015, p. 10).
The e-learning is designed to include self-contained mathematics, derivations and discussion. This enables substantial flexibility in its use by students. It can be employed as reading ahead of lectures or computer workshops; it can be drawn upon to set exercises for use ahead or after classes to illustrate integral issues; revision sessions can be shaped via its use; and students can consult and employ it at any time. It also promotes student control over the nature of lecture and workshop contact hours. This element is apparent also in two weeks that are devoted to recapping of material and an even greater emphasis on application. These weeks are timed to occur at the mid-point and end of the module ahead of the coursework submission and end of year examination respectively. Within these weeks, student-led sessions are held in which the standard teacher-learner hierarchy is side-lined. Drawing upon the insights obtained from the flexible learning materials, students formulate ideas and determine the content of these sessions. As with the design of the e-learning, this learner empowerment is consistent with the learning gains mentioned by Watson et al. (Citation2015) and Ryan and Tilbury (Citation2013). It also allows for a rapid response to student misconceptions and problems ahead of formal assessment, as championed by Berrett (Citation2012).
More specifically, the combination of discursive and data-based elements in the e-learning materials allow students to benefit from the following aspects: results are available for students to replicate; step-by-step walk-throughs are provided with illustrative examples; interactive elements are provided to allow immediate consideration of results and how they impact on conclusions; topical examples are used to raise engagement levels; there is a combination of different software packages, with more basic software such as Excel combined with sophisticated packages to allow hands-on analysis; specific examples, with clear-cut results, are used to demonstrate the underlying features of mathematical methods; and there is a focus on a design boosting self-efficacy through the provision of ‘hidden intuition’.
To illustrate the embedding of ‘hidden intuition’, we now give more detail of the Forecast Combination e-learning resource. This topic considers how two sets of forecasts of a variable can be merged to create a combined forecast. There are numerous technical matters covered, but one element which proves difficult is the intuition underlying the determination of the relative proportions of each set of forecasts to use to create an improved joint forecast (e.g. is it 90% of one and 10% of another?). Following conventional notation, these proportions are denoted as for the second set of forecasts and
for the first set of forecasts. After application of optimization using calculus, the resulting algebraic expression obtained, as given in Equation (1), is not necessarily straightforward or intuitive:
where denotes the variance of the errors of forecast and
is the correlation between the two sets of forecast errors. The technical requirements involved in the mathematics leading to (1) are understood by students, given their prior knowledge of concepts such as partial differentiation, variance and correlation. However, interpretation of Equation (1) can understandably prove problematic. For example, how will
vary if the value of
changes? This component appears in the numerator and the denominator, it appears as squared and not squared, it is added, and it is subtracted. While the mechanics involved in the derivation of the result are important, a vital issue is the intuition underlying the value of
. How do the inputs (i.e. the properties of the forecasts used) influence its value? Given the nature of the forecasts considered, what value might be expected? Although standard lecture material will typically fail to address these questions, the interactive nature of this e-learning resource provides students with further insight. Included in the e-learning is a spreadsheet which allows automated calculation of
for limitless different combinations of the inputs, i.e.
. Extremely intuitive results, originally hidden by the complex algebra, therefore come to light. For example, the student can determine that- ceteris paribus- greater values of
are observed for greater values of
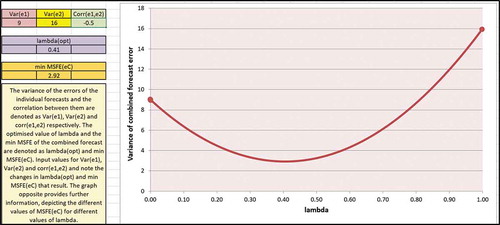
. That is, they can see that when the first set of forecasts is more volatile and- in crude terms- less attractive, we use less of it. While standard lecturing methods focus on the algebra, the e-learning allows for hands-on experimentation which advertises practical application and the mechanics of the procedure. This discussion of the hidden intuition masked by complex algebra is also relevant to a further feature of the e-learning material which allows consideration of the properties of the combined forecast. A screenshot from the interactive Excel file created by student interaction is provided in . This aspect of the e-learning, which supplements explanatory text and discussion, uses visual means to encourage a deeper understanding of what is meant by ‘optimisation’. The student can see that the calculus involved in the analysis can be viewed as a search procedure associated with a value which minimizes the value of function (i.e. we are simply looking for the lowest point on a curve). Such interactive graph creation can contribute to the promotion of self-efficacy as the interactive nature of the resource allows endless examples and results to be generated via the use of alternative inputs. Consequently, the user can choose values with more straightforward intuition to create more accessible results and once confidence is built, then proceed to more complex cases. As a result, technical material is provided in an intuitive manner with solutions accompanied by graphical presentation, thus mitigating anxiety and focusing on the practical purpose of the alternative quantitative methods that are adopted.
Figure 1. Forecast combination.
The nature of this specific set of materials illustrates the ‘complementary’ nature of e-learning packages available for this module. That is, the materials are not the typically provided lecture notes or data sets or computer lab worksheets, but instead provide an alternative delivery and presentation of topics designed to develop additional understanding. The above ‘forecast combination’ example illustrates the use of interactive packages within the e-learning materials to allow the generation of limitless examples of results to permit repeated practice and exposure to varying outcomes. This features in other e-learning resources, with, for example, directional forecasting and forecast evaluation materials containing packages to allow users to input whatever series they wish to automatically generate limitless results in relation to the prediction changes in the movement of variables and forecast accuracy respectively. In other instances, a greater emphasis is placed upon step-by-step presentation and deconstruction of methods so that details and subtleties associated with methods can be identified and explained. However, in general, the e-learning materials provide alternative perspectives on topics which combine what might be considered traditional lecture and lab materials, but in a different format which incorporates interactive elements to create explained examples, provide links to the literature, synthesise alternative software packages and incorporate data-based examples. Therefore, the materials have the additional advantage of offering something new to students who have attended classes while also providing a means for absent students to avoid falling behind, something a more restricted approach to flexible learning such as lecture capture does not offer.
5. Empirical analysis
Details of how the flexible learning methods have been embedded over the time frame of our study is provided in . The sets of flexible learning materials (FLM) have increased from 3 to 8 over the 4 years, leaving only one topic covered on the module without e-learning support.Footnote6 As FLM has increased over the time frame of our experiment, there has been a coinciding increase in the mean module mark (notably increasing from 55.1% to 70.7%), the number of students taking the module (from 15 to 27) and the percentage of ‘good honours’ outcomes (from 27% to 85%).Footnote7 The only factor that has not seen any trend is the percentage failure rate. Over the four years considered, there is some variation but no overall change from the first to the fourth year (approximately 7%).
Table 2. Module statistics.
Given the results in and the module’s unchanged syllabus during the period considered, the impact of flexible learning upon student performance seems very apparent, particularly as the mean marks and good honours outcomes both remained near constant during the two years with the same application of FLM.Footnote8 However, the outcomes reported could well be influenced by cohort effects, with movements in marks simply reflecting changes in student characteristics and a shift towards a student body with higher innate technical skills. To control for such cohort effects, the marks for each student on this module are examined relative to their marks on all the other modules they undertook in their final year of study. That is, two series are examined for each year: one containing student marks on this module and the other containing the average marks achieved across other modules for these students.Footnote9 The resulting mean difference in these marks, the t-statistic for this mean being zero and the associated p-value for this test are provided in . These results show that there is a variation in the mean difference through the years. However, in only one year is this difference statistically different from zero. This is the final year in which the full set of FLM coincides with students scoring substantially and significantly higher on this module (9.3%) than they scored elsewhere. Our results therefore reject cohort effects, strengthening the evidence of a substantial improvement in outcomes as a result of the provision of our flexible learning materials.
Table 3. Examining differences across modules.
To further understand the nature of the outcomes obtained, the distribution of student marks for each year is also investigated. This analysis is prompted by the NUS Student Experience Report of 2008 which classifies students according to their underlying motivations. It identifies students as ‘Next Steppers’, ‘Toe Dippers’, ‘Options Openers’ and ‘Academics’. The labels reflect their underlying motivation for attending University. Are they looking to achieve career goals? Are they looking for experiential benefits from a new life at University? Are they looking to learn interesting subjects or to be stretched academically? This form of attitudinal decomposition leads to consideration of issues which may help understanding of the success or failure of pedagogical innovations. Consider again our reference to ‘grade targeting’. An improvement in learning materials, rather than improving outcomes, could simply make it easier to achieve a target level of performance. To explore the distribution of outcomes further and shed some light on these potential satisficing effects, the Triples Test of Randles, Fligner, Policello, and Wolfe (Citation1980) is employed. This test allows non-parametric hypothesis testing of asymmetry in the distribution of marks. By considering potential asymmetry in the mark distribution, we can test whether statistically significant ‘separation’ of marks occurs where some students lie at one end of the distribution while others are clustered at the other. While complex in nature, the central features of this approach involve the calculation of an asymmetry statistic and an associated test statistic for its significance
.Footnote10 The results obtained from application of Triples testing are reported in .
Table 4. Examining the distribution of marks.
shows that there are two years in which significant results are obtained. In both cases negative asymmetry is present. This indicates that there is a longer or flatter left-hand tail in the distribution of marks, corresponding to a small number of low marks at one end of the distribution and a larger number of higher marks at the other. These results reflect the message from earlier findings concerning fail rates, average marks and good honours outcomes as they confirm the statistical significance of the movement towards the higher end of the distribution. Taking the results in the three tables in combination, there is evidence to support the notion that the final year of the study (2016–2017) has a large proportion of students who, rather than undertaking grade targeting, exhibit the motivation of ‘academics’ in the National Union of Students (Citation2008) terminology and are seeking to maximise their performance. We not only see an increase in the mean module mark, but also a significant negative skew of the marking distribution, reflecting a movement of student outcomes away from lower scores towards higher levels of performance.
6. Conclusion
The discussion has centred upon the impact of the introduction of flexible learning on a highly technical quantitative methods undergraduate module. Considering results over a four-year period, our empirical approach finds substantial positive gains have been generated through the adoption of flexible learning techniques. We build on the work by Webb et al. (Citation2018), which identifies the need for a ‘broad’ application of e-learning methods designed around student empowerment. If the aim is to simply replicate the material expected in the lecture environment, there are unlikely to be any positive effects. However, if there is a significant change in the pedagogical approach, then highly positive outcomes are significantly more likely.
Our change in pedagogical approach allows for methods encouraging ‘hidden intuition’ effects and a positive breakdown of the lecturer-student hierarchy in face-to-face sessions. The empirical analysis adopted shows that this produces substantial gains in learning outcomes. During a period of steady increase in the use of flexible learning, there is strong evidence of increased self-efficacy and increased skills in quantitative methods. Adding to the quantitative methods curriculum is clearly important to address the quantitative skills deficit. However, while an unquestioned increase is unlikely to produce the improvements required, we argue that a pedagogical approach incorporating flexible learning methods we can help eliminate the quantitative methods deficit and consequently help meet the skills demands of graduate employers.
Correction Statement
This article has been republished with minor changes. These changes do not impact the academic content of the article.
Disclosure statement
No potential conflict of interest was reported by the author.
Notes
1. The term e-learning is used in the present paper to refer to online flexible learning materials beyond the typical and familiar online support offered by Blackboard and similar packages.
2. As the module was introduced in the 2013–14 academic year, it is in its fifth year with four complete years of student outcomes available for analysis at the time of writing.
3. While reference is made herein and within the pedagogical literature to the notion of a ‘traditional’ lecture, it is recognised that this is a difficult notion for which to provide an exact definition.
4. The first set of materials (‘Forecast Evaluation’) pre-dates the current module as it was developed for a similar postgraduate module on an Economics scheme which is no longer in existence.
5. These materials are all freely available via the Web links provided in the references.
6. Flexible learning materials of the form available for all other topics are not provided for this final, single topic. Quite simply, the reason for this is that the relevant materials have not yet been finalized for submission for potential publication rather than there being a deliberate policy to avoid doing so due to the nature of the topic or for any other reason.
7. Good honours within the UK education system refers to marks in the upper second and first-class degree classifications. That is, marks of 60% and above.
8. The syllabus has not changed in that the same core topics are still considered. However, data sets and examples have been updated and revised to ensure topicality, in addition to updating the version of the specialist software employed (EViews) as new releases became available. Importantly, these issues have in no way changed the pitch or rigour of the module.
9. Consequently, equal sample sizes are considered for each of the years examined. For example, in the final year considered, marks on this module for 27 students are compared with the average marks across other modules for these 27 students, thus leading to the comparison of two series of 27 observations. As noted by a referee, the level of module enrolment results in relatively small sample analysis being undertaken and results should be considered with this in mind.
10. Further details on the (combinatorial) nature of the Triples testing approach are available upon request from the authors in addition to the seminal paper of Randles et al. (Citation1980).
References
- Allgood, S. (2001). Grade targets and teaching innovations. Economics of Education Review, 205, 485–493.
- Bergmann, J., & Sams, A. (2012). Flip your classroom: Reach every student in every class every day. Virginia: ISTE & ACSD.
- Berrett, D. (2012). How ‘flipping’ the classroom can improve the traditional lecture. The Chronicle of Higher Education. Retrived from https://www.chronicle.com/article/How-Flipping-the-Classroom/130857
- Bishop, J., & Verleger, M. (2013). The flipped classroom: A survey of the research. Paper presented at the 120th ASEE Annual Conference & Exposition Paper ID #6219, Atlanta, Georgia.
- Blair, E., Maharaj, C., & Primus, S. (2016). Performance and perception in the flipped classroom. Education and Information Technologies, 21, 1465–1482.
- Bligh, D. (2000). What’s the use of lectures? San Francisco: Jossey-Bass.
- British Academy. (2012). Society counts: Quantitative skills in the social sciences and humanities. London: Author.
- British Academy. (2015). Count us in: Quantitative skills for a new generation. London: Author.
- Brown, B., & Liedholm, C. (2002). Can web courses replace the classroom in principles of microeconomics? American Economic Review Papers and Proceedings, 922, 444–448.
- Carey, E., Hill, F., Devine, A., & Szücs, D. (2016). The chicken or the egg? The direction of the relationship between mathematics anxiety and mathematics performance. Frontiers in Psychology, 6, 1987.
- Caviglia-Harris, J. (2016). Flipping the undergraduate classroom: Using online videos to enhance teaching and learning. Southern Economic Journal, 81, 321–331.
- Chen, J., & Lin, T. (2012). Do supplemental online recorded lectures help students learn microeconomics? International Review of Economics Education, 111, 6–15.
- Cook, S. (2006). Understanding the construction and interpretation of forecast evaluation statistics using computer-based tutorial exercises. Economics Network Ideas Bank. Retrieved from https://www.economicsnetwork.ac.uk/showcase/cook_forecas
- Cook, S. (2013a). Time series decomposition: A practical example using a classic data set. Economics Network Ideas Bank. Retrieved from https://www.economicsnetwork.ac.uk/showcase/cook_timeseries
- Cook, S. (2013b). Forecast combination: A tool for teaching and demonstrating the underlying issues. Economics Network Ideas Bank. Retrived from https://www.economicsnetwork.ac.uk/showcase/cook_combination
- Cook, S. (2014a). Forecast encompassing as a means of forecast comparison. Economics Network Ideas Bank. Retrived from https://www.economicsnetwork.ac.uk/showcase/cook_encompassing
- Cook, S. (2014b). Directional forecasting, forecast accuracy and making profits. Economics Network Ideas Bank. Retrived from https://www.economicsnetwork.ac.uk/showcase/cook_directional
- Cook, S. (2016a). Forecasting using exponential smoothing: Developing understanding via replication and contemporary applications. Economics Network Ideas Bank. Retrived from https://www.economicsnetwork.ac.uk/showcase/cook_smoothing
- Cook, S. (2016b). Visual identification of ARIMA models. Economics Network Ideas Bank. Retrived from https://www.economicsnetwork.ac.uk/showcase/cook_arima
- Cook, S. (2016c). Analysing forecasting bias: Significance, methods and samples. Economics Network Ideas Bank. Retrived from https://www.economicsnetwork.ac.uk/showcase/cook_bias
- Dawson, P. (2014). Skills in mathematics and statistics in economics and tackling transition. New York, NY: Higher Education Academy.
- Department of Business, Innovation and Skills. (2013). Market assessment of public sector information. London: Author.
- Dowker, A., Sarkar, A., & Looi, C. (2016). Mathematics anxiety: What have we learned in 60 years? Frontiers in Psychology, 7, 508.
- Economics Network. (2012). National economics students survey 2012 report. Bristol: Author.
- Economics Network. (2015). National economics students survey 2014–15 report. Bristol: Author.
- Folley, D. (2010). The lecture is dead long live the e-lecture. Electronic Journal of e-Learning, 8, 93–100.
- French, S., & Kennedy, G. (2017). Reassessing the value of university lectures. Teaching in Higher Education, 22, 639–654.
- Gibbs, G. (2013, November). Lectures don’t work, but we keep using them. Can a demonstrably ineffective pedagogic form still be put to good use? Times Higher Education. Retrived from https://www.timeshighereducation.com/news/lectures-dont-work-but-we-keep-using-them/2009141.article
- Gordon, N. (2014). Flexible Pedagogies: Technology-Enhanced Learning. New York, NY: Higher Education Academy. Retrived from https://www.heacademy.ac.uk/flexible-pedagogies-technology-enhanced-learning
- Guerrero, S., Beal, M., Lamb, C., Sonderegger, D., & Baumgartel, D. (2015). Flipping undergraduate finite mathematics: Findings and implications. Primus, 25, 814–832.
- Harackiewicz, J., Barron, K., Carter, S., Lehto, A., & Elliot, A. (1997). Predictors and consequences of achievement goals in the college classroom: Maintaining interest and making the grade. Journal of Personality and Social Psychology, 736, 1284–1295.
- Hembree, R. (1990). The nature, effects and relief of mathematics anxiety. Journal of Research in Mathematics Education, 21, 33–46.
- Hoyles, C., Wolf, A., Molyneux-Hodgson, S., & Kent, P. (2002). Mathematical skills in the workplace: Final report to the science technology and mathematics council. London: Institute of Education, University of London; Science, Technology and Mathematics Council.
- Kwak, D., Menezes, F., & Sherwood, C. (2015). Assessing the impact of blended learning on student performance. Economic Record, 91, 91–106.
- Macher, D., Paechter, M., Papousek, I., Ruggeri, K., Freudenthaler, H., & Arendasy, M. (2013). Statistics anxiety, state anxiety during an examination, and academic achievement. British Journal of Educational Psychology, 83, 535–549.
- MacInnes, J., Breeze, M., de Haro, M., Kandlik, M., & Karels, M. (2016). Measuring up: International case studies on the teaching of quantitative methods in the social sciences. London: The British Academy.
- Mason, G., Nathan, M., & Rosso, A. (2015). State of the Nation: A review of evidence on the supply and demand of quantitative skills. London: The British Academy & NIESR.
- Matheson, R., & Sutcliffe, M. (2017). Creating belonging and transformation through the adoption of flexible pedagogies in masters level international business management students. Teaching in Higher Education, 22, 15–29.
- McFarlin, B. (2008). Hybrid lecture-online format increases student grades in an undergraduate exercise physiology course at a large urban university. Advances in Physiology Education, 32, 86–91.
- National Union of Students 2008. NUS student experience report. Retrieved from http://www.nus.org.uk/PageFiles/4017/NUS_StudentExperienceReport.pdf
- Olitsky, N., & Cosgrove, S. (2013). The effect of blended courses on student learning: Evidence from introductory economics courses. International Review of Economics Education, 15, 17–31.
- Olitsky, N., & Cosgrove, S. (2016). The better blend? Flipping the principles of microeconomics classroom. International Review of Economics Education, 16, 1–11.
- Paechter, M., Macher, D., Martskvishvili, K., Wimmer, S., & Papousek, I. (2017). Mathematics anxiety and statistics anxiety: Shared but also unshared components and antagonistic contributions to performance in statistics. Frontiers in Psychology, 8, 1196.
- Pokorny, M., & Pokorny, H. (2005). Widening participation in higher education: Student quantitative skills and independent learning as impediments to progression. International Journal of Mathematical Education in Science and Technology, 36, 445–467.
- Randles, R., Fligner, M., Policello, G., & Wolfe, D. (1980). An asymptotically distribution-free test for symmetry versus asymmetry. Journal of the American Statistical Association, 75, 168–172.
- Ryan, A., & Tilbury, D. (2013). Flexible pedagogies: New pedagogical ideas. New York, NY: Higher Education Academy. Retrived from https://www.heacademy.ac.uk/flexible-pedagogies-new-pedagogical-ideas
- Schmidt, H., Wagener, S., Smeets, G., Keemink, L., & van der Molen, H. (2015). On the use and misuse of lectures in higher education. Health Professions Education, 1, 12–18.
- Sparks, R. (2013). Flipping the classroom: An empirical study examining student learning. Journal of Learning in Higher Education, 92, 65–70.
- Terry, N., & Lewer, J. (2003). Campus, online, or hybrid: An assessment of instruction modes. Journal of Economics and Economic Education Review, 41, 23–34.
- Watson, D., Webb, R., Cook, S., & Arico, F. (2015). Death of the pedagogue: Pluralism and non-didacticism. International Journal of Pluralism and Economics Education, 5, 242–255.
- Webb, R., Watson, D., & Cook, S. (2018). Is flipping the future? Assessing the effectiveness of two types of flipping the classroom. Under review, mimeo.