
 ?Mathematical formulae have been encoded as MathML and are displayed in this HTML version using MathJax in order to improve their display. Uncheck the box to turn MathJax off. This feature requires Javascript. Click on a formula to zoom.
Abstract
The European Alps are characterized by a unique geographical environment. The high altitude and the associated steepness of the slopes pose numerous challenges for spatial development. Furthermore, due to their specific natural characteristics, the Alps constitute a region worthy of preservation, which brings additional considerations in the field of political decision-making. All these facts demand increased political and planning coordination. Debates about spatial development in the Alps, hardly address the regions’ topographic characteristics and their consequences. Based on a Digital Elevation Model (DEM) slope analysis, I argue that topographic factors and their implications for municipalities in the Alpine region have been underestimated in spatial development. In this article, an analytical mapping of the Alpine region based on topographic arguments addresses two research questions: What potentials and limits does slope data reveal for the Alps as a living space? How can this analysis help to identify potentials for spatial development in the Alps? I introduce the Topographic Potential Areas (TPA) and an associated TPA quotient, which relates the potential area based on slope steepness to the total area of the municipal territory. These findings serve as a basis for further analyses to facilitate a sustainable spatial organization of the Alpine region.
Introduction
In the field of geographic exploration, the essence of mountain areas transcends altitude and is revealed in the complex manifestations of terrain (Funnell and Price Citation2003). As Bender and Haller (Citation2017) point out, elevation is only one aspect of a mountain’s characteristics; equally crucial is the shaping of the landscapes, exemplified by relief and its associated morphological consequences. In the context of defining mountain landscapes, two topographic criteria are essential: elevation and steepness, as Price et al. (Citation2019) underline. In addition to political demarcation, these two criteria together define the boundaries of mountains, thus capturing their character and distinctiveness.
Consequently, the area available for human life in mountain regions is very different from that in lowland areas posing immense challenges for sustainable spatial development (Dematteis Citation2018; Price et al. Citation2022). In recent times, particularly spurred by the digital advances in the field of geomorphometry, topographic approaches have covered a broad spectrum – encompassing ecological, physical, and socioeconomic perspectives. These approaches inherently explore the interconnectedness of landscapes and their inhabitants by using raster data, such as from remote sensing (Sofia Citation2020). Hence, Goodchild (Citation2018) noted, that digitally comparable and comprehensive data are relevant not only for academic purposes but also for decision-makers and planners.
While national efforts to address mountain development in an integrated manner some three decades ago aimed at comprehensive solutions, the path to progress was fraught with challenges. Pioneering initiatives encountered stunning obstacles, mainly due to the prevailing institutional framework, lack of comparability, and lack of cultural and sectoral frameworks for sustainable development (Kohler et al. Citation2015; Chilla and Lambracht Citation2022). Researchers are currently attempting to study the Alpine region on a comparative and comprehensive basis, focusing on issues such as accessibility, the settlement system, or the environment and related protected areas (e.g., Bertram and Chilla Citation2022; Chilla, Bertram, and Lambracht Citation2022; Job et al. Citation2022). Others focus on more sectoral issues, such as commuting or mobility (e.g., Chilla and Heugel Citation2022; Bertram, Chilla, and Hippe Citation2023; Cavallaro and Dianin Citation2020). Particularly in mountain regions, an integrated and targeted policy that takes into account regional dynamics has been identified as an imperative requirement (Dax and Hellegers Citation2000). However, consideration of different territorial levels is necessary. Tested knowledge from local case studies needs to be complemented by pan-Alpine findings to formulate derived principles (Debarbieux and Price Citation2008; Bertram, Chilla, and Hippe Citation2023).
This is where my approach introduces the Topographic Potential Area (TPA) quotient for each municipality in the inner-Alpine area, which results from comparing the total area with the TPA. It uses the slope as an indicator of usability, but also of hazard potential. Two research questions are at the center of this approach: What potentials and limitations do slope data reveal for the Alps as a living space? How can this analysis help to identify potentials for spatial development in the Alps? Conceptually, the approach taken here subsumes the principles of Actor-Network-Theory (ANT), meaning the interactions between human and non-human entities and their consequences (Latour Citation1999; Jensen and Sandström Citation2020). The slope and its inclination are considered as a non-human entity in the network of the Alpine living space. The basis for the implementation of these results is provided by the work from geomorphometry, which quantifies the topographic properties of landscapes and terrain forms through quantitative analysis and makes them analytically useful (Viles Citation2016).
Material and methods
For several decades, researchers have been challenged by the conversion of raster data into vectorized information (e.g., Peuquet Citation1981; Greenlee Citation1987). Therefore, the aim of this paper is not to generate new information on the topography of the Alpine region or to present new methods for data conversion. It is about making available information usable for further analysis in innovative ways. In other research areas, such as, e.g., natural hazard identification and mitigation research, raster data in the form of a Digital Elevation Model (DEM) are often used for this purpose (e.g., Qiu et al. Citation2022; Saleem et al. Citation2019). Although Pirasteh and Li (Citation2017) rightly discuss the advantages and disadvantages of different remote sensing methods for DEM generation, they conclude that GIS-based analysis with high-resolution raster data provides a comparable and important database for a variety of practical applications. Consequently, the basis for the presented analysis is the slope raster file of the Digital Elevation Model over Europe (EU-DEM). In the further course of the analysis, the administrative boundary shapefile at the municipality level from Eurogeographics is also included. The EU-DEM Slope provides information on the steepness of the terrain with values between 0 and 250 and a resolution of 25 meters. The higher the value, the flatter the terrain for each grid cell.
First, according to the research question, the consequences of the slope should be considered in order to set a reasonable threshold for the values. Spatial planning and development are often closely linked to infrastructure and safety measures. The feasibility of building on a slope depends on several factors, including local building regulations, engineering considerations, soil integrity, and the specific context (Sanap and Sapate Citation2020). The feasibility of construction is not universally dependent on a fixed percentage of slope inclination, as regulations and guidelines vary considerably from region to region and country to country. Therefore, own elaborations for a suitable threshold were conducted. This has resulted in different distinct rationales guiding such determinations:
The risk of avalanches and landslides is a significant concern at slopes above 30 degrees (Van Gelder, Nadim, and Soares Citation2010).
Recommendations for building on terrain advocate for seamless execution is up to 15 percent slope. Beyond this threshold, significant cost escalation can be expected (e.g., Gorsevski, Gessler, and Jankowski Citation2003; FLF (Forschungszentrum für landwirtschaftliche Fernerkundung und Julius Kühn-Institut) Citation2017).
According to the British land capability classification the use of heavy harvesting machinery is limited from a slope of 15 degrees (e.g., Jarasiunas Citation2016).
Particularly in mountainous regions, areas with steeper slopes are often used for construction projects, due to the availability of buildable land. Excluding areas beyond the 15 percent of slope would exclude terrain from the analysis, that is already in use today, even though the costs for construction are higher. Consequently, a median value of less than 30 percent of slope (or 16.3 degrees) was used as the benchmark reference value for the Topographic Potential Area (TPA). According to the conversion table from Eurostat, all grid values between 240 and 250 are eligible for TPA (ESTAT (Eurostat – European Statistical Office) Citation2023).
Second, the slope raster file was converted to vectorized data using the ArcGIS Pro conversion tool. Within the conversion, the value field with numbers between 0 and 250 was selected to match the values of the cells in the input grid to the polygons in the output dataset. The result was a shapefile with polygons for each value. Following the self-defined division, these polygons were combined into two groups, one with all values below 240 and another with values from 240 to 250. Next, the shapefile containing the administrative boundaries of the municipalities in the Alpine Convention perimeter was blended with the second group of the newly generated slope polygon shapefile. The field calculator tool was then used to compare, divide, and visualize the corresponding areas as TPA quotients. The TPA quotient is defined by the following formula:
The final step in the analysis was to add a cartogram (also called an anamorphic map) to the classic cartographic representation of the TPA quotient. This map visualizes the area of the administrative polygons in relation to the area of the TPA using a diffusion-based method (Gastner and Newman Citation2004). This cartographic representation offers the possibility to highlight certain information. In this case, the amount of TPA.
Results and discussion
shows the results of the analysis. It consists of three individual mappings, which focus on different steps in the analysis process.
Figure 1. Topographic potential area (TPA), TPA-quotient and TPA area proportional map for the Alpine region.
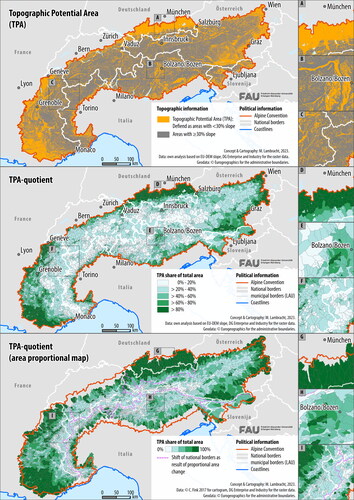
The first map visualizes the TPA with values between 240 and 250. This means a slope of less than 30 percent. This area includes all regions that have a lower disaster risk and are potentially useful for agricultural or infrastructure building activities. The second part of the map, the TPA quotient, shows the share of TPA in the total area of each municipality in the Alpine region. This analytical finding makes the information obtained from the raster data useful for further analysis at the local level. Finally, the third part of the mapping presents a cartogram of the TPA-quotient, representing an area proportional map.
In addition to the total area maps, each of the three thematic sections contains three zoom-ins on particularly informative extracts for identifying the potential of slope data for spatial development in the Alps. The zoom-ins A, D and F focus on the area between Munich and the Austrian border as a typical fringe area. The region around Bolzano/Bozen and Merano/Meran is characterized by large river valleys and also plateaus and is therefore highlighted in the zoom-ins B, E and H. The zoom-ins in map sections C, F and I, focus on a high Alpine border area between Italy France and Switzerland.
Fringe areas as interface regions
The German part of the Alpine Convention, large areas of the French Alps in the west and the eastern ranges of the Alps (Austria and in parts of Slovenia) show an increased TPA quotient and therefore, a similar spatial pattern. This observation is due to the flattening of the relief, which in turn raises questions about the marked differences between the national subareas of the Alpine Convention. While Switzerland and Italy show a delimitation of the Alpine Convention perimeter quite close to the relief gradient, the inclusion of large peri-Alpine areas in other countries can hardly be explained morphologically. However, this problem of delimitation is of secondary importance here, since these peri-Alpine areas also exist outside the perimeter in Switzerland and Italy.
Nevertheless, due to their peripheral location to the major peri-Alpine centers and their increased TPA availability, these areas function as interface terrains. The focus is not only on socio-economic but also infrastructural aspects. These regions serve as hubs for a wide variety of flows leading into and out of the Alps. In view of these findings, they should be considered as priority regions in terms of integrated spatial development by national and local decision-makers as well as planners. The development of conspicuous solutions in these fringe areas leads to potential flagship cases, as they play an important role in spatial development and planning within the Alpine region.
Valleys as functional highways and plateaus with functional potential
The visualizations in illustrate that both valley locations and plateaus concentrate the limited TPA in the central area of the morphologically rugged Alpine landscape. This fact is particularly well illustrated by inner-Alpine river valleys such as the Inn, Rhine, Adige, Drau, and Rhone valleys. Plateaus such as those around Bolzano/Bozen in northern Italy, the ‘Fluh’ in the Allgäu or the Dobrovlje plateau north-east of Ljubljana also show moderate gradients from a morphological point of view. The availability of TPA in valleys and plateaus does not automatically translate them into areas that can be used for relocation of currently used terrains. At this point, accessibility and environmental protection arguments must be taken into account.
The limited availability of TPA areas in large inner parts of the Alpine perimeter thus leads to an increased pressure on these areas. The few available land is increasingly confronted with the competition between infrastructural, economic, and demographic purposes on the one hand and environmental protection on the other. At the same time, these land-use conflictsare significantly increasing the pressure on decision-makers, planning initiatives, and political votes throughout the Alpine region. The competition for limited TPA areas requires a careful balancing of different demands and needs in order to ensure a sustainable and balanced development of the Alpine region.
Increasing functional pressure
The proportional area map in illustrates that municipalities in the inner Alpine region face increased land use pressures due to the reduced availability of TPA. The Alpine region is confronted with the challenging task of fulfilling a variety of functions: It is a living and economic space for the population, but also an important transit route in the european and global transport networks and simultaneously an important recreational space for tourists. At the same time, large parts of this area are worthy of protection due to its unique natural characteristics and as a refuge for flora and fauna. The presented visualization helps to make the existing land pressure visible.
In view of this situation, spatial planning and development in the Alpine countries face a number of challenges. Transnational policy coordination frameworks need to be developed in order to devise strategies that can effectively counteract this growing pressure. Coordination and cooperation at the transnational level will be essential to ensure a sustainable balance between the multiple demands of the Alpine region, its inhabitants and the linkages with the surrounding lowland areas.
Conclusion
This approach shows that an innovative combination of slope with existing data can visualize spatial images of interest, while slope data per se do not reveal a new view of space for the Alpine region. Basically, the spatial patterns reflect the morphology. What is innovative, however, is the ability to link the converted raster data for each municipality with secondary statistical data sets, such as, e.g., socio-economic information. This opens up new horizons for detailed analysis and insight. The linkage between topographical information and secondary data provides not only an improved database, but also an expanded and cross-sectoral perspective for various application areas.
This vital way of combining data is of great importance to decision-makers and also researchers in fields such as spatial planning and development and opens up new perspectives for spatial management. Policy makers are empowered to decide more informed, as they have insights into spatial information with pan-Alpine comparability and local resolution. In combination with other relevant data, the socio-economic realities of the affected areas can be highlighted. This helps to shape forward-looking sustainable development strategies that are better aligned with transnational and local needs.
By identifying unused potential areas, the Alpine region can be used more efficiently. This allows for improved infrastructure development, the creation of new economic opportunities, and the promotion of sustainable growth with an awareness of cultural heritage and ecological uniqueness.
Currently, the academic focus is on linking available land use data with socio-economic information, often at a local micro-scale. Complementary, this approach provides a comprehensive pan-Alpine insight. In future research, the integration of data sets, such as environmental data or accessibility information, could lead to an even more comprehensive understanding of the interactions between the topography of the Alpine region, its land-use dynamics, and its inhabitants. This will open up even more possibilities for sustainable, intelligent, and future-oriented planning and development strategies to safeguard the Alps as a living space.
Disclosure statement
No potential conflict of interest was reported by the author.
References
- Bender, O., and A. Haller. 2017. The cultural embeddedness of population mobility in the Alps: Consequences for sustainable development. Norsk Geografisk Tidsskrift – Norwegian Journal of Geography 71 (3):132–45. doi:10.1080/00291951.2017.1317661.
- Bertram, D., and T. Chilla. 2022. Polycentricity and accessibility in mountain areas: The Alpine case. European Planning Studies 1–21. doi:10.1080/09654313.2022.2145874.
- Bertram, D., T. Chilla, and S. Hippe. 2023. Cross-border mobility: Rail or road? Space-time-lines as an evidence base for policy debates. Journal of Borderlands Studies 1–18. doi:10.1080/08865655.2023.2249917.
- Bertram, D., T. Chilla, and M. Lambracht. 2023. The Alpine settlement system: Capturing relevance beyond size. Journal of Maps 19 (1): 1–6. doi:10.1080/17445647.2022.2164229.
- Cavallaro, F., and A. Dianin. 2020. Cross-border public transport as a driver for tourism in the Alps. Transportation Research Procedia 48 (2):2446–61. doi:10.1016/j.trpro.2020.08.262.
- Chilla, T., D. Bertram, and M. Lambracht. 2022. Alpine towns – Key to sustainable development in the Alpine region. Part 1: Facts, maps and scientific debates. 9th Report on the State of the Alps. 1-56 doi:10.13140/RG.2.2.36022.98880/1.
- Chilla, T., and M. Lambracht. 2022. Land take in the Alpine region: The data perspective. Contribution to IP_S2, Step 1 of the Alpine climate target system. https://www.alpconv.org/fileadmin/user_upload/Organisation/TWB/SPSD/CDR_ACTS_IP_S3_1a_Land_Take_Data.pdf.
- Chilla, T., and A. Heugel. 2022. Cross-border commuting dynamics: Patterns and driving forces in the Alpine macro-region. Journal of Borderlands Studies 37 (1):17–35. doi:10.1080/08865655.2019.1700822.
- Dax, T., and P. Hellegers. 2000. Policies for less-favoured areas. In CAP regimes and the European countryside, prospects for integration between agricultural, regional and environmental policies, ed. Brouwer, F. and P. Lowe, 179–97. Wallingford: CAB International.
- Debarbieux, B., and M. Price. 2008. Representing mountains: From local and national to global common good. Geopolitics 13 (1):148–68. doi:10.1080/14650040701783375.
- Dematteis, G. 2018. The alpine metropolitan-mountain faced with global challenges. Reflections on the case of turin. Journal of Alpine Research|Revue De Géographie Alpine 106 (2):1-13. doi:10.4000/rga.4402.
- ESTAT (Eurostat – European Statistical Office). 2023. Conversion of DN in ‘SLOP’ files into degrees off horizontal of the surface tangent. https://ec.europa.eu/eurostat/documents/7116161/7172326/SPEC011-b140109-SLOP.pdf
- FLF (Forschungszentrum für landwirtschaftliche Fernerkundung und Julius Kühn-Institut). 2017. Geodatenprodukte: Hangneigung. https://flf.julius-kuehn.de/webdienste/webdienste-des-flf/hangneigung.html.
- Funnell, D., and M. Price. 2003. Mountain geography: A review. Geographical Journal 169 (3):183–90. https://www.jstor.org/stable/3451445. doi:10.1111/1475-4959.00083.
- Gastner, M., and M. Newman. 2004. Diffusion-based method for producing density-equalizing maps. Proceedings of the National Academy of Sciences 101 (20):7499–504. doi:10.1073/pnas.0400280101.
- Goodchild, M. 2018. Reimagining the history of GIS. Annals of GIS 24 (1):1–8. doi:10.1080/19475683.2018.1424737.
- Gorsevski, P., P. Gessler, and P. Jankowski. 2003. Integrating a fuzzy k-means classification and a Bayesian approach for spatial prediction of landslide hazard. Journal of Geographical Systems 5 (3):223–51. doi:10.1007/s10109-003-0113-0.
- Greenlee, D. 1987. Raster and vector processing for scanned linework. Photogrammetric Engineering and Remote Sensing 53 (10):1383–7.
- Jarasiunas, G. 2016. Assessment of the agricultural land under steep slope in Lithuania. Journal of Central European Agriculture 17 (1):176–87. doi:10.5513/JCEA01/17.1.1688.
- Jensen, T., and J. Sandström. 2020. Organizing rocks. Actor-network theory and space. Organization 27 (5):701–16. doi:10.1177/1350508419842715.
- Job, H., C. Meyer, O. Coronado, S. Koblar, P. Laner, A. Omizzolo, G. Plassmann, W. Riedler, P. Vesely, and A. Schindelegger. 2022. Open spaces in the European Alps – GIS-based analysis and implications for spatial planning from a transnational perspective. Land 11 (9):1605. doi:10.3390/land11091605.
- Kohler, T., J. Balsiger, G. Rudaz, B. Debarbieux, D. Pratt, and D. Maselli. 2015. Green Economy and Institutions for Sustainable Mountain Development: From Rio 1992 to Rio 2012 and beyond. Bern, Switzerland, Centre for Development and Environment (CDE), Swiss Agency for Development and Cooperation (SDC), University of Geneva and Geographica Bernensia: 1-144. doi:10.13140/RG.2.1.4376.9440.
- Latour, B. 1999. On recalling ANT. In Actor network theory and after, ed. Law J. and J. Hassard, 15–25. Oxford: Blackwell Publishers.
- Peuquet, D. 1981. An examination of techniques for reformatting digital cartographic data, part 1: The raster-ta-vector process. Cartographica: The International Journal for Geographic Information and Geovisualization 18 (1):34–48. doi:10.3138/VL12-8581-0733-0Q11.
- Pirasteh, S., and J. Li. 2017. Landslides investigations from geoinformatics perspective: Quality, challenges, and recommendations. Geomatics, Natural Hazards and Risk 8 (2):448–65. doi:10.1080/19475705.2016.1238850.
- Price, M., T. Arnesen, E. Gløersen, and M. Metzger. 2019. Mapping mountain areas: Learning from Global, European and Norwegian perspectives. Journal of Mountain Science 16 (1):1–15. doi:10.1007/s11629-018-4916-3.
- Price, M., W. Gurgiser, I. Juen, C. Adler, S. Wymann von Dach, G. Kaser, and S. Mayr. 2022. The International Mountain Conference, Innsbruck, Austria, September 2019 (IMC2019): A Synthesis with Recommendations for Research. Mountain Research and Development 42 (1):A1–A16. doi:10.1659/MRD-JOURNAL-D-21-00027.1.
- Qiu, H., Y. Zhu, W. Zhou, H. Sun, J. He, and Z. Liu. 2022. Influence of DEM resolution on landslide simulation performance based on the Scoops3D model. Geomatics, Natural Hazards and Risk 13 (1):1663–81. doi:10.1080/19475705.2022.2097451.
- Saleem, N., M. Huq, N. Twumasi, A. Javed, and A. Sajjad. 2019. Parameters derived from and/or used with digital elevation models (DEMs) for landslide susceptibility mapping and landslide risk assessment: a review. ISPRS International Journal of Geo-Information, 8 (12):1–25. doi:10.3390/ijgi8120545.
- Sanap, R., and V. Sapate. 2020. Analysis of building on sloping ground. International Journal for Research in Applied Science and Engineering Technology 8 (6):513–9. doi:10.22214/ijraset.2020.6079.
- Sofia, G. 2020. Combining geomorphometry, feature extraction techniques and earthsurface processes research: The way forward. Geomorphology 355:107055. doi:10.1016/j.geomorph.2020.107055.
- Van Gelder, P., F. Nadim, and C. G. Soares. 2010. Risk assessment of natural hazards with applications to landslides and abnormal waves. In Safety and Reliability of Industrial Products, Systems and Structures, ed. Guedes Soares, C. London: Taylor & Francis Group. doi:10.1201/b10572.
- Viles, H. 2016. Technology and geomorphology: Are improvements in data collection techniques transforming geomorphic science? Geomorphology 270:121–33. doi:10.1016/j.geomorph.2016.07.011.