
Abstract
The species richness of venomous snakes in Ecuador (~39 species) is among the highest in the world. However, until now no information exists regarding geographic patterns of ophidism. In this study, we present a detailed spatial snakebite risk map which was built by stacking weighted ecological niche models of the 19 snake species responsible for the majority of Ecuador’s envenomation cases. Our weights were based on the proportion of cases reported for each species on local epidemiological studies. Based on our analyses, we identify 184 densely populated rural communities with high snakebite risk that should be monitored by health organizations. We also identified three densely populated rural locations (Palora Metzera, Sangay and Shell) that may require special attention because they had much higher snakebite risk values than the rest.
1. Introduction
Ophidism is considered a neglected tropical disease, despite its high incidence, and the considerable health problems (serious and permanent functional sequelae in affected persons) and high number of deaths that it causes in human populations [Citation1,2]. Recent global estimates suggest that a minimum of 421,000 envenomings and 20,000 deaths owed to venomous snakes take place each year, and that these numbers could be up to 1,841,000 bites and 94,000 deaths [Citation3]. And, based on the fact that envenomings occur in about one in four people who are bitten, these same authors estimated that between 1.2 and 5.5 million of snakebites occur annually.
Ecuador has a great diversity of venomous snakes (~36 species, which account to 5 and 19% of the diversity of the world and the Americas, respectively) [Citation4], and one of the highest prevalence of snakebites in the continent [Citation5]. However, epidemiologic studies in the country remains scarce [Citation4]. Most of the information consists of isolated hospital reports for certain regions of the country [Citation2]. To date, there has been one comprehensive study of temporal and social aspects of snakebites, but a geographical analysis of snakebite risk is still lacking [Citation2].
Ideally, strategies to deal with snakebites would be based on assessments of true rates of bites and envenomation via community-based epidemiological studies, independent of the vagaries of hospital reporting, but this procedure would be expensive to apply at large scales (e.g. Ecuador) [Citation6]. As a result, correlative ecological niche models have been recently used to infer snakebite risk at regional and continental scales [Citation5,7].
We applied this niche modelling technique to estimate potential snakebite risk (defined here as the probability of being bitten by a venomous snake in a given location) in Ecuador integrating: (1) maps of potential distribution and environmental suitability of snake species of medical importance, and (2) information that approximates the probability of being bitten by a specific species. We also identified vulnerable human communities for snakebites based on a densely populated rural communities map.
2. Methods
2.1. Biological data
We obtained species occurrences through the Global Biodiversity Information Facility (GBIF, http://www.gbif.org) and VertNet (http://www.vertnet.org) websites (accessed to both = March 2017). We eliminated any doubtful (e.g. occurrences that fall in the ocean or in other continents) information and we applied the “Spatially Rarefy Occurrence Data” from “SDMtoolbox” [Citation8] in ArcGIS® 10.3 (©ESRI) to minimize spatial auto-correlation and model overfitting [Citation9]. We used a rarefication buffer of 20 km based on the clustering nature and abundance of presence points; we would have lost many records for some species if we had used a greater distance. Finally, we split presence records randomly into calibration (80%) and evaluation (20%) data-sets (sample sizes for complete, filtered, calibration and validation datasets are presented in ).
Table 1. Summary of ecological niche modelling inputs and evaluations.
We modelled the potential distribution of 19 snake species (), including only species for which at least five occurrences were available to avoid statistical difficulties associated with small sample sizes [Citation8]. We are confident that excluding these species did not affect our analysis because they have characteristics (e.g. rareness, restricted distributions, low abundance) that would greatly reduce the frequency of bites [Citation5]. Besides, the majority of snakebites in Ecuador are caused by only six species [Citation4,9,10].
2.2. Environmental layers
We used 19 bioclimatic layers (resolution = 30 arc-seconds) from World Clim (http://www.worldclim.org/) [Citation11] to characterize environmental conditions. We masked these layers to the extent of a polygon that represents a hypothetical area of historical accessibility for each species (area M; sensu Soberón and Peterson [Citation12]). We used a vectorial map of terrestrial ecoregions generated by the WWF [Citation13] to determine the M area.
Moreover, we reduced dimensionality and collinearity among bioclimatic layers by applying a principal components analysis (PCA). To do this, we used the “PCARaster” function in the R [Citation14] package ENMGadgets [Citation15]. We retained for the modelling stage the first five components that explained ≥95% of the overall variance.
2.3. Ecological niche modelling
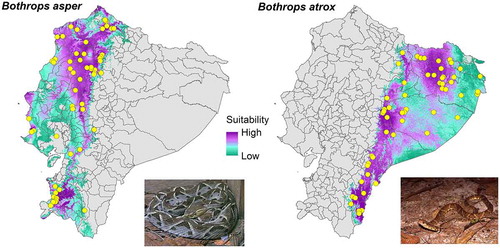
We used Maxent 3.3.3k [Citation16] to estimate environmental suitability and the potential distribution of each species. We chose this program because it is reputed to have better predictive ability than other presence-only data algorithms [Citation17]. We used calibration data across the accessible area (M) for each species with the Maxent bootstrapping/replicated settings and a “cloglog” output. We also carried out ten replicate analyses to explore effects of specific calibration data sets on model outputs. Finally, to obtain the potential distribution maps we thresholded the average environmental suitability models utilizing the “10 percentile training presence” rule to exclude problematic occurrences (e.g. taxonomic misidentifications, presences from sink populations and imprecisions in geo-referencing) [Citation17]. In all the maps, we keep suitability values only within the potential distribution area ().
Figure 1. Ecological niche models for the two most dangerous snakes in Ecuador (Bothrops asper and B. atrox). Photo credits: B. asper (Jerry Oldenettel) and B. atrox (Andreas Schlüter). Source: Authors.
2.4. Model evaluation
We assessed predictive performance with the evaluation data-set via the partial ROC (receiver operating characteristic) approach. This technique is based on the traditional ROC [Citation18], but takes into account the area of coverage of the commission error axis by model predictions, and gives preference to omission over commission error in evaluating model strength [Citation19]. We calculated the AUC (area under the curve) ratio for each species using the software Tool for Partial-ROC [Citation20] with an allowed omission of 10% of validation data. AUC ratio values above one indicate that models outperform the null expectation [Citation19].
2.5. Snakebite risk maps
Following Yañez-Arenas et al. [Citation5], we built a snakebite risk map that approximates the probability of being bitten by a venomous snake at a given cell. We estimated snakebite risk by stacking ecological niche models and weighing each species by a number related to the proportion of bites caused by it. Specifically, we summed the environmental suitability values of the cells that were classified as potential distribution for each species. Then, we multiplied these values by the reported proportion of snakebites caused for each species () in epidemiological studies carried out in Ecuador [Citation21–Citation23].
Table 2. Species values that weights their probability to cause human envenomation.
Finally, we identified vulnerable rural communities (rural localities with high population density and high snakebite risk) based on the “estimates of rural population density to 2015” global raster [Citation24], and a shapefile of localities obtained from “Geodescargas” (http://www.geoportaligm.gob.ec/; elaborated on January 2013, accessed on June 2015).
3. Results
In all, we gathered 1187 spatially filtered presence records, varying among species from 1 (Micrurus annellatus, M. hemprichii) to 1482 (Bothrops asper). AUC ratio values for almost all species were >1 (with the exception of Micrurus dumerilii), indicating that models outperform null expectations ().
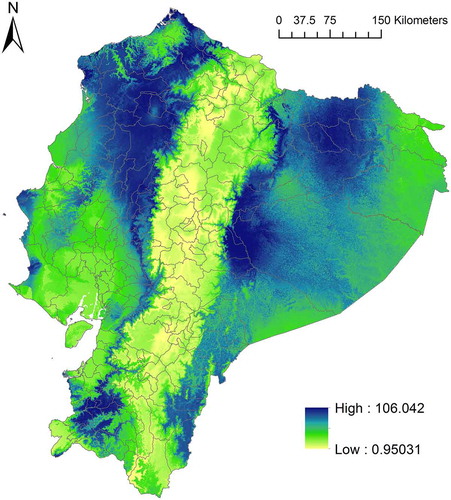
Modelled snakebite risk showed a broad geographic pattern, wherein the central region (Andes) of Ecuador has low to medium snakebite risk, while the western (Coast) and eastern (Amazonia) regions have in general medium to high risk (). Because our snakebite risk index was produced giving greater weight to B. asper and B. atrox, the regions of the map of greatest risk () coincide with the areas of high environmental suitability for these species ().
Figure 2. Snakebite risk map for Ecuador. Source: Authors.
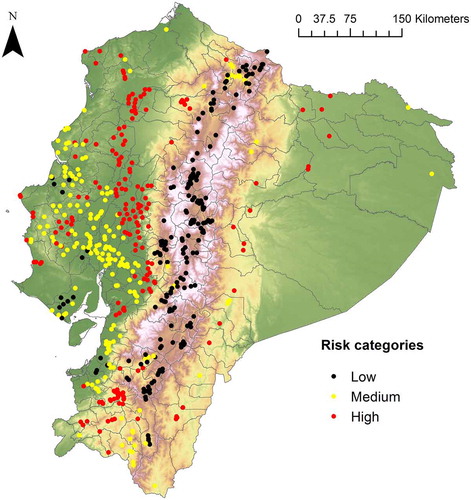
We identified 187 rural communities (Table S1) that we consider vulnerable because they are densely populated and have high environmental suitability for the snake species (B. asper and B. atrox) responsible for the majority of accidents in the country. Of these communities, 75% are located in the western region of Ecuador, 14% in the central region, and 11% in the eastern region. In the latter, our model estimates an extensive area with high snakebite risk values, however, there are very few densely populated rural communities (). Finally, three locations in the eastern region stand out as having a much higher estimated risk than the rest: “Palora (Metzera)”, “Sangay” and “Shell”.
Figure 3. Categories of snakebite risk for densely populated rural communities in Ecuador. Source: Authors.
4. Discussion
Our study estimated snakebite risk at fine resolution (~1 km2) based on detailed environmental suitability/distribution models for 19 species. A good predictive performance was observed in potential distribution models for almost all venomous snakes, including those of medical importance such as Bothrops asper, B. atrox, B. brazili, Bothrocophias microphthalmus, Bothriopsis bilineata, B. taeniata, Lachesis muta [Citation4,22,23], except Micrurus dumerilii.
This research represents the first of its type in Ecuador, in terms of geographic dimension and scope. Previous studies were carried out at local scales (e.g. Smalligan [Citation22], Theakston et al. [Citation23], Praba-Egge et al. [Citation25]) and the more comprehensive ones do not provide enough spatial details (e.g. González-Andrade and Chippaux [Citation2]).
We predicted that high snakebite risk is associated with tropical and sub-tropical lowlands of Ecuador; a result that is consistent with previous findings [Citation21]. Also, González-Andrade and Chippaux [Citation2] reported that ~56% of snakebites take place in the western region, followed by the eastern (~33%) and central region (~11%), which gives partial support to our analysis of vulnerable human communities. We found more vulnerable communities in the western region followed by the central region and finally the eastern region. Although in the latter our model estimates an extensive area with high snakebite risk, there are very few densely populated rural communities located in this region compared with the other two. Of the 565 densely populated rural communities that we identified, 54% are located in the western region, 41% in the central region and 5% in the eastern region.
A major limitation of the present study is that we were unable to obtain detailed (e.g. at location level) incidence data to validate our snakebite risk map, and our model does not incorporate some socio-demographic factors (e.g. human activities, type of housing, population’s age) that are known to be causal of snakebites [Citation1–Citation3]. However, previous evidence has shown that ecological niche modelling is usually successful at inferring geographic patterns of ophidism at continental [Citation5], country [Citation26] and regional scales [Citation7]. This is particularly useful to infer potential snakebite risk areas when hospital data are scarce or biased. For instance, in many rural communities around the world people prefer to attend traditional doctors instead of a modern clinic [Citation27]. We recognized three rural communities in which health care providers should pay special attention: “Palora (Metzera)”, “Sangay” and “Shell”.
This is a preliminary analysis that represents a significant progress towards understanding geographic patterns of ophidism in Ecuador. Nonetheless, much still remains to be done: First, it is necessary to continue digitalizing occurrences of venomous snakes. Second, it is crucial to generate a snakebite cases reporting system that concentrates data per locality for the whole country. Third, it is important to perform studies to evaluate which factors contribute the most to snakebite risk. And four, anthropogenic climate change should be considered to anticipate strategies for delivering/distribution antidotes and to make people aware and conscious in regions where snakebite risk might increase in the future.
Author contribution
Conceived idea and designed the analyses: Carlos Yañez-Arenas. Analysed the data: Carlos Yañez-Arenas, Luis Díaz-Gamboa, Carlos Patrón-Rivero, Kevin López-Reyes. Wrote the paper: Carlos Yañez-Arenas, Xavier Chiappa-Carrara.
Disclosure statement
No potential conflict of interest was reported by the authors.
Funding
This work was supported by Consejo Nacional de Ciencia y Tecnología [grant number 64636].
Supplemental data
Supplemental data for this article can be accessed here [https://doi.org/10.1080/23766808.2018.1454762].
TNEO_1454762_SUPPLEMENTARY_MATERIAL.xlsx
Download MS Excel (24.3 KB)Acknowledgements
We thank Karla Rodríguez Medina and Eduardo Garza for their review, comments and suggestions to this manuscript.
Associate Editor: Yntze van der Hoek.
Related Research Data
References
- ChippauxJP. Snake-bites: appraisal of the global situation. Bull World Health Organ. 1998;76:515–524.
- González-AndradeF, ChippauxJP. Snake bite envenomation in Ecuador. Trans R Soc Trop Med Hyg. 2010;104:588–591.10.1016/j.trstmh.2010.05.006
- KasturiratneA, WickremasingheAR, de SilvaN, et al.The global burden of snakebite: a literature analysis and modelling based on regional estimates of envenoming and deaths. PLoS Med. 2008;5:e218.10.1371/journal.pmed.0050218
- ValenciaJ, Garzón-TelloK, Barragán-PaladinesM. Serpientes venenosas del Ecuador: sistemática, taxonomía, historia natural, conservación, envenenamiento y aspectos antropológicos [Poisonous snakes of Ecuador: systematic, taxonomy, natural history, conservation, poisoning and anthropological aspects]. Quito (Ecuador): Fundación Herpetológica Gustavo Orcés, Universidad de Texas, Fondo Ambiental Nacional; 2016. Spanish.
- Yañez-ArenasC, PetersonAT, Rodríguez-MedinaK, et al.Mapping current and future potential snakebite risk in the new world. Climat Change. 2015;134:697–711.
- ChippauxJP. Epidemiology of snakebites in Europe: a systematic review of the literature. Toxicon. 2012;59:86–99.10.1016/j.toxicon.2011.10.008
- Yañez-ArenasC, PetersonAT, MokondokoP, et al.The use of ecological niche modeling to infer potential risk areas of snakebite in the Mexican state of Veracruz. PLoS One. 2014;9:e100957.10.1371/journal.pone.0100957
- BrownJL. SDMtoolbox: a python-based GIS toolkit for landscape genetic, biogeographic and species distribution model analyses. Methods Ecol Evol. 2014;5:694–700.10.1111/mee3.2014.5.issue-7
- BoriaRA, OlsonLE, GoodmanSM, et al.Spatial filtering to reduce sampling bias can improve the performance of ecological niche models. Ecol Model. 2014;275:73–77.10.1016/j.ecolmodel.2013.12.012
- StockwellD, PetersonAT. Effects of sample size on accuracy of species distribution models. Ecol Model. 2002;148:1–13.10.1016/S0304-3800(01)00388-X
- HijmansRJ, CameronSE, ParraJL, et al.Very high resolution interpolated climate surfaces for global land areas. Int J Climatol. 2005;25:1965–1978.10.1002/(ISSN)1097-0088
- SoberónJ, PetersonAT. Interpretation of models of fundamental ecological niches and species’ distributional areas. Biodiv Inform. 2005;2:1–10.
- WWF. Conservation Science Ecoregions. 2006 [cited June 2016]. Available from: http://www.worldwildlife.org/science/ecoregions
- Development Core Team. R: A language and environment for statistical computing. Vienna (Austria): R Foundation for Statistical Computing; 2014.
- BarveN, BarveV. ENMGadgets: tools for pre and post processing in ENM workflows. 2013.
- PhillipsSJ, AndersonRP, SchapireRE. Maximum entropy modeling of species geographic distributions. Ecol Model. 2006;190:231–259.10.1016/j.ecolmodel.2005.03.026
- ElithJ, PhillipsSJ, HastieT, et al.A statistical explanation of MaxEnt for ecologists. Divers Distrib. 2011;17:43–57.10.1111/ddi.2010.17.issue-1
- FieldingAH, BellJF. A review of methods for the assessment of prediction errors in conservation presence/absence models. Environ Conserv. 1997;24:38–49.10.1017/S0376892997000088
- PetersonAT, PapeşM, SoberónJ. Rethinking receiver operating characteristic analysis applications in ecological niche modeling. Ecol Model. 2008;213:63–72.10.1016/j.ecolmodel.2007.11.008
- BarveN. Tool for partial-ROC. Lawrence (KS): Biodiversity Institute, ver.1. 2008;1.
- WarrellDA. Snake bite. Lancet. 2010;375:77–88.10.1016/S0140-6736(09)61754-2
- SmalliganR. Antivenin comparison: which is best for snake bites in Ecuador?Inpharma. 2004;1464:20.
- TheakstonR, LaingG, FieldingC, et al.Treatment of snake bites by Bothrops species and Lachesis muta in Ecuador: laboratory screening of candidate antivenoms. Trans R Soc Trop Med Hyg. 1995;89:550–554.10.1016/0035-9203(95)90105-1
- SalvatoreM, PozziF, AtamanE, et al.Mapping global urban and rural population distributions. Rome: FAO; 2005.
- Praba-EggeAD, ConeSW, AraimO, et al.Snakebites in the rainforests of Ecuador. World J Surg. 2003;27:234–240.
- NoriJ, CarrascoPA, LeynaudGC. Venomous snakes and climate change: ophidism as a dynamic problem. Climat Change. 2014;122:67–80.10.1007/s10584-013-1019-6
- ChippauxJP. Estimating the global burden of snakebite can help to improve management. PLoS Med. 2008;5:e221.10.1371/journal.pmed.0050221