
ABSTRACT
In Ecuador, there is a progressive loss of the native forest. To mitigate these problems, several reforestation plans have been carried out in the country. To recover the Andean forest, Polylepis racemosa was introduced from Peru, due to its similarity to native species like Polylepis incana. This genus fulfills important ecological functions that help mitigate the effects of local climate change. However, reforestation of introduced species close to natural populations threatens the genetic diversity of Polylepis native forests. In the long term, it can trigger hybridization processes and create problems for ecosystem conservation. This study used geometry morphometric (GM), to differentiate species quickly and economically, using the form of leaves, stomata, flowers, and pollen of P. incana and P. racemosa in three populations: Illinizas Ecological Reserve, Mojanda Lagoons and Cayambe-Coca National Park. To obtain the data, the composite leaves were scanned, the stomata and pollen were photographed with an increase of 400× and on flowers with 100×. 15, 10, 12, and 9 landmarks (LM) were digitized for leaves, stomata, flowers, and pollen, respectively, using ImageJ software. Then, the shape variables and statistical analysis were performed in MorphoJ software. As a result, it was obtained that the discriminant function analysis (DFA) shows that leaves and flowers can be used as indicators to differentiate species from this genus, discarding stomata and pollen. After that, Canonical Variate Analysis (CVA) of leaves and flowers showed that reforested species jointly are separated into two different species; except for the flowers of the population of Mojanda, where there is an intersection of few individuals, which share similar phenotypic characteristics so they can be considered as potentially hybrid individuals. This study generates information on the location of species introduced inside and outside the National System of Protected Areas that threaten the Andean highlands. Finally, GM is an accessible tool for monitoring biodiversity through morphological characteristics and discriminating against species with complex taxonomic problems.
Introduction
Most of our planet’s biodiversity is concentrated in the tropics [Citation1]. Currently, there are a few intact primary tropical forests, most of them have become degraded secondary forests for timber purposes [Citation2,Citation3]. Forests of the genus Polylepis (Rosaceae) are the only tree element that can develop as fragments of high-altitude forests. They are located in the tropical and subtropical Mountains Andes of South America from Venezuela to Argentina [Citation4]. They are an important Andean ecosystem that contain and protect a variety of endemic and endangered species becoming an important biodiversity hotspot [Citation4]; they also fulfill with important ecological functions like CO2 uptake, carbon storage, and water regulation, helping in mitigating the effects of local climate change [Citation5].
High level of fragmentation in Polylepis makes them one of the most threatened ecosystems in the world [Citation6]. The forest is vulnerable to strong anthropogenic pressure, like deforestation, overgrazing, and fires [Citation7,Citation8]. Because of this, efforts have been made to conserve and reforest these forests in South America [Citation9,Citation10]. In Ecuador, between 2008 and 2014 an average annual loss of 47 thousand hectares of native forest was reported, where Polylepis forest was included [Citation11]. Therefore, restoration and reforestation of the remaining patches of Polylepis is a conservation priority in the Andean regions.
Polylepis incana is a native species and of slow growth. Furthermore, it can interbreed with other species of the genus and is pollinated by the wind [Citation12]. It is located within several zones of the National System of Protected Areas of Ecuador (SNAP) and according to the UICN, this species has been in a vulnerable state since 1998 [Citation13].
Polylepis racemosa was introduced to Ecuador from Peru in 1988 when a series of community reforestation plans sponsored by non-governmental organizations (NGOs), government, and local entities was initiated [Citation11]. This species has been selected as a plant resource due to its rapid growth and leafiness, which protect water resources [Citation14]. Besides, it has some morphological characteristics similar to native species such as Polylepis incana, because it belongs to the same evolutionary group. Nowadays, P. racemosa is distributed throughout the inter-Andean Ecuadorian region breaking down geographical and ecological barriers, which has allowed this species to invade the territory of natural populations of Polylepis incana and has increased the likelihood of hybridization between species [Citation14].
In Ecuador, on May 2010, individuals with intermediate morphological characteristics have been reported between P. racemosa and P. incana [Citation14]. This study contributed that the use of P. racemosa, close to natural populations, is threatening the genetic diversity of Polylepis native forests [Citation14]. Indeed, reforestation close to native species by introducing foreign species in one place can trigger hybridization processes [Citation15–18] and become a problem, inside and outside the National System of Protected Areas of Ecuador.
Hybridization is evidenced by molecular methods such as microsatellites, this tool is expensive, time-consuming, and needs experience [Citation15]. In contrast, geometry morphometric is a useful method for solving taxonomic problems related to species differentiation quickly and economically, as it allows a statistical analysis of variation and visualization of differences in the form of phenotypic characters [Citation19]. Studies based on geometry morphometric have managed to contribute to the botanical taxonomy of several specimens, differentiating similar species within the same genus [Citation20].
Leaf morphology and floral symmetry are fundamental to plant taxonomy and systematics, it has been studied mainly through traditional morphometry [Citation21,Citation22]. However, in the last decade, the use of geometry morphometric for the study of the shape of leaves and flowers has increased, based on landmarks that approximate contours and surfaces to quantify the size and shape [Citation23]. Some studies help to solve taxonomic questions such as the influence of environmental factors, species evolution, among others [Citation24,Citation25]. Decades ago, there were no appropriate statistical tools to discriminate and differentiate subtly different forms of pollen grains [Citation26]. Currently, several studies have solved this problem using geometry morphometric [Citation26–28]. In this context, quantitative morphology can be an effective tool for quantifying morphological differences in microscale [Citation28].
Within traditional morphometry, stomata have been used as characters for polyploidy distinction [Citation29,Citation30] and taxonomic discrimination [Citation31,Citation32]. Patterns like the width, length, size, position, and density of stomata have been useful in identifying species and providing other important taxonomic characteristics [Citation33]. Despite this, there are no reports on the application of geometry morphometric in stomata for species discrimination.
This study is the first report of geometry morphometric in species of the genus Polylepis in Ecuador, which aims to conserve native species and contribute to the management of reforestation plans of introduced species. Therefore, the following research questions are proposed: (1) Can leaf, stoma, flower, and pollen shapes be considered as valid morphological parameters to monitor the phenotypic differences between P. incana and P. racemosa through geometry morphometric? (2) Can P. incana be differentiated from P. racemosa based on morphology at reforested sites inside and outside the National System of Protected Areas of Ecuador (SNAP)?
Methods
Study area
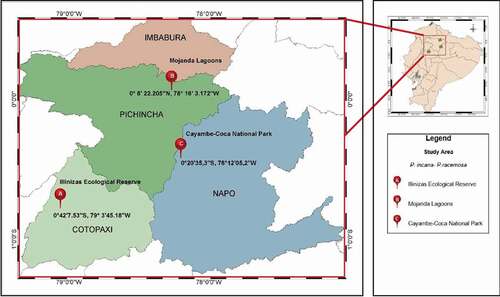
Geographical study areas in the Ecuador’s Andean Region were: Illinizas Ecological Reserve (0–42ʹ7.53”S, 79th 3ʹ45.18”W), Mojanda Lagoons (0ʹ 8ʹ 22.205ʹ’N, 78th 16ʹ 3.172ʹ’W) and Cayambe-Coca National Park (0–20ʹ35,3ʹ’S, 78–12ʹ05,2ʹ’W). Following, they will be called population A, B, and C, respectively (). In these three populations, the two Polylepis species were found in separate fragments and reforested jointly. This study was made with samples collected under research permission MAE-ARSFC-2020-0445.
Figure 1. Map of Ecuador showing the sampling samples of P. incana and P. racemosa in this study. (A) Illinizas Ecological Reserve, (B) Mojanda Lagoon and (C) Cayambe-Coca National Park. Obtained from ArcGIS (Geographic Information System) Software by Esri (Environmental Systems Research Institute) for Windows, version 10.5 × 64 Bits. (Release 10. Redlands, California)
Taxonomic review
We carried out a taxonomic review of the species under study to identify P. incana native areas of more than 30 years old and records of P. racemosa in the same area. These forests are separated from other species at least 10–15 kilometers around and they will be considered as groups controls.
In the taxonomic assessment, it was found records of P. incana of more than 35 years old at populations A, B and C considered native and used as control group ().
Table 1. Taxonomic review with collections from the herbarium of the department of biological sciences of the Pontifical Catholic University of Ecuador in Quito (Herbarium QCA)
Whereas for P. racemosa the only records of its introduction to the country were found in population B. In populations A and C, trees with more than 4 meters high, thick trunks, flowers, and fruits were found forming, a patch of approximately 100 to 200 trees in each and separated from other areas. For this reason, they are also considered as control group for P. racemosa.
Experimental design
Within each population, three fragments were sampled: the first for P. incana, the second for P. racemosa, and a third fragment in which the species were found reforested jointly. Throughout this study, the following nomenclature (specie name*) shall be used to refer to the reforested species jointly of that fragment: P. incana* and P. racemosa*.
Forty trees of each population were selected with 2 meters away from each other. Statistical balanced model was used in each plant structure. Each sample group was formed of the same number of individuals. In total, 120 leaves and 120 flowers were processed: 40 per population and 10 by species. Likewise, 600 stomata and 600 pollen grains; 200 per population and 50 by species were analyzed.
Geometry morphometric analysis
Mounting and photography of the specimens
Leaves: We follow the protocol established by Klingenberg et al. [Citation34] modified by Caiza [Citation35]. Once collected, the samples were placed in a botanical press and 40 compound leaves by each population were scanned in an Epson L210 printer with 300 dpi resolution.
Stomata: We follow the methodology of Caiza [Citation30] with some modifications due to reagent changes: A thin piece of epidermis without trichomes was extracted and the transparent piece was placed on a slide accompanied by a drop of water. Finally, 200 open occlusive cells per population were photographed at 400x magnification with the Olympus BX41 optical microscope.
Flowers: Based on phenology reported in Polylepis tomentella by Domic [Citation36]. The flowers in the male state were selected because they present fully open flowers, stamens with visible anthers, and withered stigma. The opposite case is observed in the flowers in the female state, where the stigma is yellow receptive to the center, without visible anthers. Ten mature flowers were collected in the male stage. It was preserved with 3% ascorbic acid as an antioxidant and the stamens were removed. Finally, the flowers were observed with 3 open sepals and 40 photographs were taken for each population in a Leica optical stereoscope at 100× for later digitization.
Pollen: Pollen was obtained from the collected flowers. A drop of 1% acetocarmine was placed on a slide for ~ 15 minutes [Citation30]. Next, 200 photographs of viable tricorporate pollen per population were observed and taken on an Olympus BX41 optical microscope at 400X.
Determination and digitization of landmarks
Landmarks (LMs) are discrete points that correspond to a specific site in the anatomy of a structure [Citation19]. To extract the geometric coordinates from the digital photographs, landmarks were determined. By using the ImageJ 1.52a. software and the “Point Picker” plugin, 15, 10, 12, and 9 landmarks were set for leaves, stomas, flowers, and pollen, respectively (). A total of 14 640 landmarks were processed from the 3 populations: 1 800 on leaves, 6 000 on stomas, 1 440 on flowers, and 5 400 on pollen.
Table 2. Configuration of landmarks in each plant structure of P. incana and P. racemosa in this study, with a description of the reference points on the right: a) Leaves, b) Stomata, c) Flowers, d) Pollen
Statistical analysis in MorphoJ software
Generalized Procrustes Analysis
Generalized Procrustes Analysis (GPA) was carried out to extract the shape coordinates of the landmark sets [Citation37,Citation38]. The morphometric analysis defines “shape” as all the geometric information in a landmark array with no regard of size, position, and orientation [Citation34]. To this purpose, all configurations were standardized to the size of the unit centroid and rotated to generate minimal differences from previously established landmarks [Citation24].
Procrustes Anova
Procrustes ANOVA was carried out to measure the error of data digitization by analyzing the variability generated between replications (3). Considering as a dependent variable the position of the landmarks in each replicate [Citation22]. Due to a large amount of work involved in taking tripled measurements on each individual of the three populations per species, errors due to measurement were estimated from a subsample of 10 individuals of each plant structure chosen at random in all samples.
The sum of squares (SS) was used to obtain the percentages of each level of variation. The percentage of the independent variable (individual) must be greater than the percentage of error. Otherwise, the effect obtained is not the product of variation due to biological factors [Citation22].
Principal Component Analysis (PCA)
To demonstrate the main patterns of variation in shape space [Citation39], Principal Component Analysis (PCA) was used on individuals considered as controls. The PCA does not seek to distort shape in space, therefore it is best suited to show patterns of shape changes. The patterns of change in the directions of the Principal Component (PC) in the form of tangent space can be displayed graphically for each macro and microstructure in the different A, B, and C populations [Citation19].
The process described in the practical guide of geometry morphometric by W. Aguirre and P. Jiménez [Citation19] was carried out, modified for the number of landmarks in each structure. The statistical significance is evaluated by using PC scores, with their respective variance values and shape change graph was obtained based on Procrustes of the changing pattern.
Independent allometric analysis
To decrease the effect of variation in shape attributed to size, a regression test was performed between the Procrustes coordinate data and the centroid size for each study group, thus correcting for differences related to allometry, generating 10 000 per test [Citation19]. Regression residuals will be used as data in the following analyses because they represent the variation in shape by decreasing the effects of allometry.
Discriminant Function Analysis (DFA)
A discriminant function analysis was performed to determine if P. incana differs from P. racemosa based on each structure studied. DFA is the most widely used statistical method to investigate taxonomic differences, focusing on two groups [Citation34]. In this study, the DFA was performed using classification tables (P-value < 0.0001 for tests with 10 000 permutations). Results of DFA (separate group pair analysis) were displayed in a frequency bar graph [Citation24]. The analysis was complemented with Cross-Validation to verify if the groups were correctly classified.
Canonical Variates Analysis (CVA)
Canonical Variates Analysis was carried out to classify the study samples into populations according to their forms [Citation40]. CVA is preferably used when three or more groups are compared [Citation22]. The statistical significance of the differences in the average forms was evaluated with permutation tests using the Mahalanobis and Procrustes distance as the test statistics (10 000 per test). The Procrustes distance is a measure to describe distances between specimens and Mahalanobis emphasizes the distance between samples relative to the distances between individuals within the samples [Citation19]. The CVA results were presented in a scatter plot of significant canonical variation (CV) scores.
Shape variation of the same tree
As data prior to the study, several analyses of variation in the shape of each plant structure within the same tree were performed.
The results obtained with the ANOVA statistical test shown in Supplementary Material demonstrated that there is no variation in shape within the same tree for leaves, stomas, flowers, and pollen in the areas of P. incana, P. incana*, P. racemosa and P. racemosa*.
Results
Interspecific shape variation of each plant structure
Compound Leaves
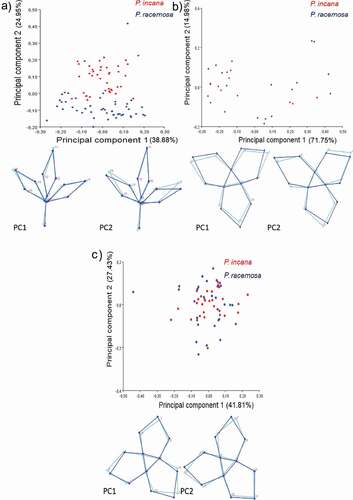
The percentage of digitizing error was 9.69%, this value does not directly influence later results. We found a variance of 63.83% in the first two main components in the variation of the shape of the leaves. The first component being the most important with 38.8% and it is associated with a slight extension of the proximal leaflets (LM: 7 and 10, 12 and 15).
PC2 tends to separate the leaves in P. racemosa and P. incana, this could be associated with the leaf shape of the species. The variation is attributed to a change in length and size of the proximal and distal leaflets from the base to the apex (LM 6 and 8, 5 and 11, 4 and 14), where the length of the leaflets of P. racemosa is greater than P. incana. PC2 had a range of values from 0 to 0.25 for P. incana and from −0.20 to 0 for P. racemosa ().
Figure 2. Result of the principal component analysis (PCA) for P. incana and P. racemosa. The dispersion of points along the horizontal axis (x) PC1 and the vertical axis (y) PC2 is represented for (A) compound leaves and (B,C) flowers. In some cases, more than one graph per organ is presented because different behaviours per population were identified, in flowers this apply for population Illinizas Ecological Reserve (B) instead population of Mojanda lagoon and Cayambe-Coca National Park are clustered (C). Wire graphs showing the main directions of variation from the consensus are also presented
Flowers
The percentage of digitizing error was 1.67%, this value does not directly influence later results. The results were analyzed in two groups, because in the general analysis this separation of the populations was observed, as the first group, population A and the second group, populations B and C.
The variation of the flower shape from population A was 71.76% and 14.98% for PC1 and PC2, respectively. The flower PCA scatter plot shows that P. incana and P. racemosa from population A in a single cluster. In PC1, the data have a range between −0.30 and 0.50 elongation of the apex of one sepal is observed (LM 11) and the widening of the opening in two sepals (LM: 2 to 4, 6 to 8). In PC2, the data is distributed from −0.20 to 0.30. There is a lengthened of the apex of one sepal (LM 3) and the apex of the other two sepals is shortened (LM: 7, 11) ().
The variation of the flower shape from population B and C was 41.81% and 27.43% for PC1 and PC2, respectively (). The PCA-generated scatter diagram for flowers shows the two species from populations B and C in a single cluster. In PC1, the data value has a dispersion on the axis from – 0.50 to 0.30. A lengthening of the apex of one sepal is observed (LM 7) and the shortening of another (LM 3). In PC2, the data is distributed from −0.30 to 0.20 and the opening of the sepals grows (LM: 2 and 4, 5, and 8).
Stomata and Pollen
The percentage of digitizing error of stomata and pollen were 43.9% and 23.11%, respectively. These values influence directly in the analysis and are not suitable for analyzing differences between species based on the shape of the structure; therefore, no valid results were found (not shown).
Species discrimination (P. incana and P. racemosa)
Compound Leaves
There is a significant difference in the shape of the compound leaves of the two species based on DFA. Showing a separation into two different groups according to their morphology, this difference between groups is independent of the population to which they belong to (T2 = 1 474.30, P-value <0.001). Population-independent cross-validation values were obtained with 100% classification precision for both species ().
Figure 3. Results of the discriminant analysis of the different plant structures analyzed as potential morphological characters for the distinction between P. incana species (red bars) and P. racemosa (blue bars): (A) compound leaves and (B) flowers
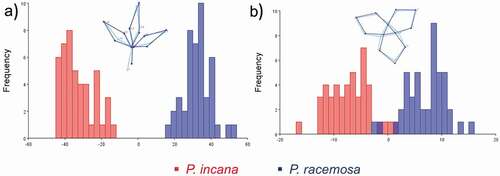
A population-dependent analysis was also performed to find out if this factor influences the shape and it was found that both species are significantly different in population A, B, and C (T2 = 10 844.55; 9 248.42; 5 448.56, respectively, P-value <0.02) where the apex of the distal leaflets and petiole explain the contraction patterns and the majority difference in shape.
The cross-validation values for each species indicate that 86.7%, 74.3%, and 93.3% of the individuals were correctly classified as P. incana, while 93.3%, 74.3%, and 93.3% were correctly classified as P. racemosa in the 3 populations, respectively.
Flowers
The geometric shape of the flower with three sepals is different in the two species (T2 = 319.42, P-value <0.01) for P. incana and P. racemosa regardless of the population to which they belong to. The patterns of contraction and widening of the junctions between sepals of the calyx that allow the opening of the floral axis to explain the main differences. Population-independent cross-validation values of 91.1% were obtained for P. incana and 86.67% for P. racemosa.
The species were significantly differentiated in populations A, B, and C (T2 = 263.47; 497.47 and 826.26, respectively, P-value <0.02 for all), showing a variation of shape in the calyx and some sepals, opening the possibility to intermediate forms ().
The analysis among pairs of the P. racemosa flowers shows that 96.6%, 86.7%, and 80% were correctly classified in the 3 populations. On the other hand, for P. incana with 86.7%, 80%, and 96.6% in the areas already named by the cross-validation analysis in pair analysis.
Canonical Variate Analysis (CVA) independent of allometry
show the values of Mahalanobis and Procrustes distances for A, B, C populations, and permutation tests (P-value) of compound leaves and flowers, respectively.
Table 3. P values for the permutation test (1000 rounds) based on the Mahalanobis and Procrustes distance of compound leaves (distance values for populations A, B, and C, respectively) between species (groups)
Table 4. P values for the permutation test (1000 rounds) based on the Mahalanobis and Procrustes distance of flowers (distance values for populations A, B and C, respectively) between species (groups)
Short distances were observed between P. incana – P. incana* and P. racemosa – P. racemosa*. This reflects that reforested individuals belong to the same population of the parent species. Also, long distances between P. incana – P. racemosa were found, for the most part, therefore there is a separation of species according to their variation in the form of leaves and flowers (, 4B, 4D).
Figure 4. Result of the analysis of canonical variants (CVA) for the compound leaves and flowers of parental species and reforested jointly (P. incana * and P. racemosa *). Scatter plots of CV1 and CV2 variables with a 95% confidence level. A) Population A (Illinizas Ecological Reserve), B (Mojanda Lagoons) and C (Cayambe Coca National Park) for compound leaves, B) Population A, for flowers, C) Population B for flowers and D) Population C for flowers
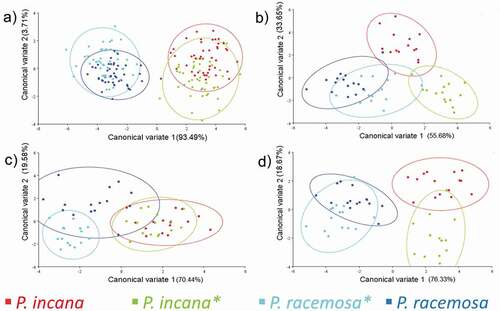
Except for the behaviour of population B for flowers, where short distances for reforested species jointly are shown. Besides, a close-up of these two fragments with the intersection of few individuals is visualized in the CVA graph, which has similar phenotypic characteristics between P. incana* and P. racemosa* flowers ().
Discriminant Analysis between species reforested jointly
Finally, the study was supplemented with a discriminant analysis for the leaves and flowers of each population of the species that were reforested jointly, to identify if there are individuals that share similar morphological characteristics.
DFA for leaves of populations A, B, and C showed values of T2 = 15 126.07, P-value= 0.0028; T2 = 10 490.35, P-value = 0.0049 and T2 = 2 375.65, P-value= 0.0419 respectively, indicating that P. incana* and P. racemosa* are different.
Cross-validation analysis for populations A, B, and C showed results greater than 66% for P. incana* and P. racemosa*. Being data greater than 60%, the individuals were correctly classified in their species.
DFA for flowers of populations A and C showed values of T2 = 1 451.35 and 2 457.70, respectively, P-value for the two populations <0.0001, indicating that P. incana* and P. racemosa* are different.
Cross-validation analysis for populations A and C gave superior results of 93% for P. incana* and P. racemosa*. Therefore, the individuals were correctly classified into two different species.
DFA for flower population B showed values of T2 = 123.33, P-value = 0.1459. These values indicate that there is no significant difference between P. incana* and P. racemosa*.
Cross-validation analysis gave results of 53.3% and 46.66%, therefore the individuals were not correctly classified.
It is observed that reforested species still retain morphological characteristics typical of each species. Except for flowers in Mojanda Lagoons.
Discussion
Currently, the genus Polylepis presents problems of species differentiation because of its high taxonomic complexity [Citation41,Citation42]. Several taxonomic descriptions have been reported from the first provided by Ruiz & Pavon in 1794. Since then, several researchers have had an interest in solving this problem, they have focused on studying the processes of hybridization, variable polyploidy (diploid, tetraploid and octoploid groups [Citation43]) and anthropogenic activity in the distribution and management of native and introduced species. All these events hinder taxonomic delimitation between related species, especially between P. incana (native) and P. racemosa (introduced), which are species of the same evolutionary group, with similar morphological characteristics [Citation44,Citation45].
Based on the taxonomic classification of the species studied with collections of the QCA Herbarium and considering the importance of applying alternative tools to differentiate species without the use of molecular techniques. A reliable methodology was developed to differentiate P. incana and P. racemosa by morphological characteristics. Geometry morphometric based on landmarks was used to identify phenotypic characters that allow the distinction between species. In addition, this tool was applied in places with reforested species jointly (P. incana* and P. racemosa*) to show the emergence of potential hybrid individuals.
On the other hand, in Ecuadorian registrations, there are no complete updated collections of the introduced species of P. racemosa at the different geographical distribution points. Although the QCA herbarium is one of the sites containing the most complete collections of vascular plants in Ecuador with 28 489 species in its repository [Citation46], there are few records of specimens of P. racemosa. This lack of information and the propagation of P. racemosa by the communities on the inside and outside of the SNAP makes it difficult to monitor the distribution, permanence of the species and number of individuals [Citation47]. This reaffirms the importance of monitoring and control of introduced species to avoid ecological consequences on the natural populations of Polylepis.
Measurement and digitization error
Measurement and digitization errors were validated using the ANOVA Procrustes test. The data obtained indicated a little incidence of variation due to the digitization by landmarks. Under the criterion mentioned by Viscosi [Citation22], all study effects must have a higher percentage than the error between replicas to consider that the differences obtained are given by biological effects. This behavior was observed in flowers and leaves.
Leaves
The morphological characters of leaves are frequently used to delimit species [Citation48]. In the family Rosaceae, there are bibliographic references that use geometry morphometric in compound leaves to differentiate taxa [Citation34,Citation49,Citation50]. Simpson [Citation51] mentions that the characteristics of leaves and leaflets in the genus Polylepis acquire primary importance for the identification of taxa.
To check if morphological characters of leaves allow us to differentiate species, PCA analysis was performed. This tool is an ordering method that allows exploring the main axes of the morphological variation of individuals. It generally constitutes the first step in the study of variation patterns [Citation19,Citation52–54]. Klingenberg et al. [Citation34] with Aguirre and Jiménez-Prado [Citation19] mention that normally only the first two main components are of biological importance because they accounts for the most of the variance. In our study, both PC had more than 63% of the original variance. In this case, PC2 is of major interest because it showed patterns of differentiation in the form of leaves between P. incana and P. racemosa.
After observing the trends of variation between the three populations and within them for leaves. A discriminatory function analysis (DFA) was performed among control species. A separation was shown in two distinct groups according to their independent morphology of the population to which they belong. In addition, cross-validation values greater than 74% in the two species indicated a correct classification of species. Therefore, DFA supports the marked difference between the forms of the two taxa. And it substantially separates the two groups without overlapping samples, matching the PC2 variation axis [Citation55].
After verifying the validity of the control species using DFA, it was carried out with a canonical variant analysis (CVA). This method provides quantitative data such as Mahalanobis distances. These distances show the probability of a given set of data, belonging to the same collective, so short distances indicate that the shapes of the analyzed group are very similar [Citation56]. Under this context, for the case study, a shorter distance was obtained between the reforested species and its parent, unlike the distances obtained between the control species, assuming that this short distance means they belong to the same species. On the other hand, the separation of control species by the greater distance found is confirmed once again. It is also mentioned by Palacios [Citation57], which describes the short distances of Mahalanobis in the leaf forms between domesticated Capsicum species in low places and long distances between Capsicum baccatum, a domesticated species in high regions.
To complete the leaf analysis, DFA was applied among the reforested species jointly in the three study populations. Species were obtained to be different. In addition, cross-validation values greater than 80% in populations A and B showing a correct classification of species. But in population C, cross-validation values of 66.66% were obtained for the two species. Also, the P-value is 0.0419, a value close to 0.05. This behavior warns that the species jointly located in Cayambe-Coca may develop a slight trend of sharing morphological characteristics in leaves shortly compared to other populations. Romoleroux [Citation58] has published some hybrid individuals among Polylepis species, particularly among sympatric species that, based on morphological characteristics, are the product of introgression. Such cases can be observed in the area of Papallacta, where records of potential hybrids between P. incana x P. pauta, P. incana x P. sericea, and P. pauta x P. sericea were found.
Stomata
Several studies have been reported involving stomata in epidermal studies to delimit species [Citation59,Citation60]. A recent study indicates that the length of the guardian cells allows to differentiate species in Polylepis [Citation61], but there are no studies that use geometry morphometric as a tool to differentiate species in the Rosaceae family.
The analysis carried out in geometry morphometric of stomata are not consistent and show a lot of discrepancies, this is due to measurement and digitization errors. Dujardin [Citation62] mentions that the mounting technique of organs or specimens, the photographing conditions, and the users’ skill in collecting landmark coordinates may produce artifactual variations. These measurement errors increase the total phenotypic variation of the shape, introducing residual noise into the data [Citation63]. And this reduces the statistical power of the analyses by increasing the type II error rate, the inability to reject false null hypotheses [Citation63,Citation64].
Flowers
Geometry morphometric applied to flowers has been useful for studies of floral symmetry [Citation21,Citation65,Citation66] and taxonomic purposes [Citation55,Citation67,Citation68]. An exhaustive bibliographic search did not reveal the use of geometry morphometric to distinguish species in the Rosaceae family. Here we evaluate its application in the floral characters of the genus Polylepis.
The distribution of points in the PCA of population A differs from population B and C. This behavior may be the result of phenotypic plasticity, meteorological factors [Citation69], temporary space conditions, and other underlying reasons that influence morphometry [Citation50,Citation65,Citation70]. Vegetative plasticity can affect the expression of floral traits in some environments, and these specific restrictions of the environment can influence the evolution of floral and vegetative traits [Citation71].
In the PCA an axis of variance that allows establishing differences between the species was not distinguished. In some cases, the flower shape is known to be influenced by pollinator pressure [Citation22]. This differs from the genus Polylepis, in which pollination occurs mainly by air, favoring the conservation of the floral shape and hinders taxonomic discrimination of species [Citation51,Citation72].
DFA is a permutation-based method that maximizes differences between groups. When applying this method in the control species, a separation was made into two different groups according to their morphology independent of the population to which they belong to. Furthermore, cross-validation values greater than 80% in the two species indicate a correct classification. Several species classification studies describe a percentage value of discriminant precision greater than 90% to verify that the DFA is correct [Citation73–75]. However, the sample size of this study allows flexibility in the percentage of precision for the validity of the classification [Citation76].
After verifying the validity of the control species using DFA, we proceeded with an analysis of canonical variants (CVA) independent of allometry. Using the Mahanolobis and Procrustes distances as data obtained from this analysis. A behavior similar to leaves was observed where the reforested and parental species of population A and C correspond to the same species. There was a different behavior with population B. Short distances were observed between species reforested jointly and a close-up of these two fragments was visualized in the CVA graph with the intersection of few individuals with intermediate morphologies, which suggests the beginning of a possible hybridization and introgression among the population [Citation34].
Finally, DFA was applied between the reforested species together in the three populations of study. It was obtained that the species are different in populations A and C. Besides, cross-validation values greater than 93% in the mentioned populations show a correct classification of the species. But in population B, cross-validation values of 53.3% and 46.66% were obtained for P. incana and P. racemosa, respectively. This data indicates that not all individuals were classified according to their same species. Furthermore, the P-value = 0.1459 shows that the species are not significantly different. Segovia-Salcedo [Citation77] points out that, in the last 30 years, the hybridization process and possible introgression between sympatric Polylepis species have become more evident in Ecuador. Due to this, those few individuals that share phenotypic characteristics in population B are considered potential hybrids.
Pollen
Pollen is commonly used in a conventional morphometric analysis for paleoecological studies or in the area of Palynology [Citation78]. As in the other structures, few bibliographic references use geometry morphometric to differentiate species in the Rosaceae family [Citation21,Citation79].
Simpson [Citation51] analyzed the pollen grains of all the described species of the genus Polylepis and found no significant differences in morphological characters. Furthermore, she suggested that it is difficult to distinguish even between related genera, given the extreme similarity between pollen of the genus Polylepis and Acaena. In the genus Polylepis, pollination is by the wind and this factor allows the pollen shape to remain relatively constant, since it is not under the selective pressure of pollinators as has been reported for other species [Citation22].
Indicators to differentiate morphological characteristics
After the respective analyses were carried out, it was obtained that compound leaves and flowers can be used as indicators to differentiate morphological characteristics between the two species. Pollen and stomata are discarded to differentiate species in this genus using geometry morphometric. The visualization of the complete structure of stomata was mostly obstructed by the presence of trichomes, which caused errors in the measurement and digitization of landmarks. Pollen being a relatively spherical structure with polar corpuscles could be better analyzed in three dimensions (3D) and contour analysis could be performed.
Conclusion
The geometry morphometric as a statistical tool allowed to differentiate the reforested species P. incana* and P. racemosa* based on the shape of the leaves and flowers and it has the potential to identify hybrids within populations. This first report contributes to improving the reforestation plans of the Andes with introduced species located close to native species. Although hybrid individuals between the two species have not yet been reported in Ecuador, the possibility of this scenario occurring shortly is not ruled out, so it is necessary to monitor the environmental impact of this introduced species and restrict their use in ecological restoration plans for paramo in the National System of Protected Areas (SNAP). To conserve primary forests avoiding their ecological transformation into degraded secondary forests.
Finally, geometry morphometric allows preliminary studies on changes in the structure of species according to the phenotype. Therefore, it is an accessible and inexpensive tool that allows monitoring the differences between morphological characters of Andean biodiversity. Also, it has a high degree of precision due to its statistical significance, so it could be used in the discrimination of other problematic species and be advantageous in studies of ecology and plant evolution.
Acknowledgments
The team appreciates the support of the following people or organizations: Laboratory of Vegetable Tissue Crops of the University of the Armed Forces ESPE with its director Mónica Jadán Ph.D. and laboratory technician Andrea Ortega Mgt. Ministry of the Environment. This article was made with samples collected under research permission MAE-ARSFC-2020-0445.
Disclosure statement
No potential conflict of interest was reported by the authors.
References
- Gibson L, Lee TM, Koh LP, et al. Primary forests are irreplaceable for sustaining tropical biodiversity. Nature. 2011;478(7369):378–381.
- Chazdon RL. Beyond deforestation: restoring forests and ecosystem services on degraded lands. Science. 2008;320(5882):1458–1460.
- Wright SJ. Tropical forests in a changing environment. Trends Ecol Evol. 2005;20(10):553–560.
- Romoleroux K, Cárate-Tandalla D, Erler R, et al. Plantas vasculares de los bosques de Polylepis en los páramos de Oyacachi [Internet]. 2019. [cited 2020 Apr 10]. Available from: https://bioweb.bio/floraweb/polylepis/home.
- Zutta BR, Rundel PW, Saatchi S, et al. Prediciendo la distribución de Polylepis: bosques Andinos vulnerables y cada vez más importantes. Rev Peru Biol. 2012;19(2):205–212.
- Renison D, Hensen I, Cingolani AM. Anthropogenic soil degradation affects seed viability in Polylepis australis mountain forests of central Argentina. For Ecol Manage. 2004;196(2–3):327–333.
- Fernández De Córdova Torres J, Santillán RV. Evaluación de la importancia de los parches de quinua (Polylepis spp) como refugio para especies de micromamíferos no voladores en el Parque Nacional del Cajas (PNC). Universidad del Azuay-Cuenca; 2006.
- Fjeldså J. Polylepis forests-vestiges of a vanishing ecosystem in the Andes. Ecotropica. 2002;8:111–123.
- Peng Y, Morales L, Hensen I, et al. No effect of elevation and fragmentation on genetic diversity and structure in Polylepis australis trees from central Argentina. Austral Ecol. 2017;42(3):288–296.
- Renison D, Cingolani AM. Experiencias en germinación y reproducción vegetativa aplicados a la reforestación con Polylepis australis (Rosaceae) en las Sierras Grandes de Córdoba, Argentina. AgriScientia. 1998;15:47–53.
- Ministerio del Ambiente del Ecuador. Estrategia Nacional de Biodiversidad 2015-2030 [Internet]. Prim. Ed. Quito, Ecuador; 2016 [cited 2020 Apr 14]. p. 225. Available from: http://maetransparente.ambiente.gob.ec/documentacion/WebAPs/Estrategia Nacional de Biodiversidad 2015-2030 - CALIDAD WEB.pdf.
- Segovia MC. Los riesgos de la reforestación de los páramos con especies exóticas: el caso Polylepis racemosa. Propuestas Andin. 2011;4:1–4.
- World Conservation Monitoring Centre. Polylepis incana. The IUCN Red List of Threatened Species 1998. [Internet]. Available from: https://doi.org/10.2305/IUCN.UK.1998.RLTS.T32990A9742243.en.
- Segovia-Salcedo M, Quijia P, Proaño K, et al. El Estado de Conservacion de los bosques de Yagual en el Ecuador (Polylepis, Rosaceae: Rosoideae: Sanguisorbeae):hibridacion, translocacion e introduccion de especies exoticas. 2011.
- Demandt MH, Bergek S. Identification of cyprinid hybrids by using geometric morphometrics and microsatellites. J Appl Ichthyol. 2009;25(6):695–701.
- Morandini R. Genética y mejora de las especies exóticas forestales. Unasylva. 1964;18:51–60.
- Vilà M, Weber E, Antonio CMD. Conservation implications of invasion by plant hybridization. Biol Invasions. 2000;2(3):207–217.
- Kahilainen KK, Østbye K, Harrod C, et al. Species introduction promotes hybridization and introgression in Coregonus: is there sign of selection against hybrids? Mol Ecol. 2011;20(18):3838–3855.
- Aguirre W, Jiménez Prado P. Guía práctica de Morfometría Geométrica. Aplicaciones en la ictiología. Esmeraldas, Ecuador: Pontificia Universidad Católica del Ecuador Sede Esmeraldas (PUCESE); 2018.
- Silva MFS, De Andrade IM, Mayo SJ. Geometric morphometrics of leaf blade shape in Montrichardia linifera (Araceae) populations from the Rio Parnaíba Delta, north-east Brazil. Bot J Linn Soc. 2012;170(4):554–572.
- Berger BA, Ricigliano VA, Savriama Y, et al. Geometric morphometrics reveals shifts in flower shape symmetry and size following gene knockdown of CYCLOIDEA and ANTHOCYANIDIN SYNTHASE. BMC Plant Biol. 2017;17(1):17.
- Viscosi V, Leaf Morphology CA, Lalueza-Fox C, Taxonomy and geometric morphometrics: a simplified protocol for beginners. PLoS One. Lalueza-Fox C, editor. [Internet]. 2011;6:e25630. Available from ;(10);.https://dx.plos.org/10.1371/journal.pone.0025630
- Jensen RJ. The conundrum of morphometrics. Taxon. 2003;52(4):663–671.
- Liu Y, Li Y, Song J, et al. Geometric morphometric analyses of leaf shapes in two sympatric Chinese oaks: quercus dentata Thunberg and Quercus aliena Blume (Fagaceae). Ann For Sci. 2018;75(4):90.
- Innangi M, Friščić M, Hazler Pilepić K, et al. Explaining intricate morphometric variability with environmental predictors: the case of globularia cordifolia species complex. Plants. 2020;9(3):314.
- Bonhomme V, Prasad S, Gaucherel C, Intraspecific variability of pollen morphology as revealed by elliptic Fourier analysis. Plant Syst Evol. Internet]. 2013;299:811–816. Available from. ;(5):. http://link.springer.com/10.1007/s00606-013-0762-5
- Kriebel R, Khabbazian M, Sytsma KJ. A continuous morphological approach to study the evolution of pollen in a phylogenetic context: an example with the order Myrtales. PLoS One. 2017;12(12):1–27.
- Cárdenas D, De La Parra F, Espinoza-Campuzano C. Morphologic variation of two key biostratigraphical proteaceous-like pollen taxa across the Cretaceous–Paleogene boundary in northern South America. Grana. 2019;58(4):276–291.
- Joly S, Bruneau A, Delimiting species boundaries in rosa sect. Cinnamomeae (Rosaceae) in Eastern North America. Syst Bot. Internet]. 2007;32:819–836. Available from. ;(4):. http://www.ingentaconnect.com/content/10.1600/036364407783390863
- Caiza JC, Vargas D, Olmedo C, et al. Measurement of stomata and pollen as an indirect indicator of polyploidy in the genus polylepis (Rosaceae) in Ecuador. Ecol Austral. 2018;28(1bis):175–187.
- Filho HAA, Bruno OM. Plants with purple abaxial leaves: a repository of metrics from stomata distribution. bioRxiv. Internet]. 2018;294553. Available from; :. https://www.biorxiv.org/content/early/2018/04/04/294553
- Some Leaf SU Characteristics are better morphometric discriminators for chestnut genotypes. 2011. [cited 2020 Apr 01]. Available from: https://www.researchgate.net/publication/266872762_Some_Leaf_Characteristics_are_Better_Morphometric_Discriminators_for_Chestnut_Genotypes.
- Da Silva NR, Oliveira MWDS, Filho HADA, et al. Leaf epidermis images for robust identification of plants. Sci Rep. 2016;6(1):25994.
- Klingenberg CP, Duttke S, Whelan S, et al. Developmental plasticity, morphological variation and evolvability: a multilevel analysis of morphometric integration in the shape of compound leaves. J Evol Biol. 2012;25(1):115–129.
- Caiza Guamba JC. Análisis de Morfometría Geométrica de hojas compuestas de Polylepis incana Kunth. y P. racemosa Ruiz & Pav. para diferenciar especies y potenciales híbridos en el Ecuador. Univ. las Fuerzas Armadas-ESPE; Quito-Ecuador. 2019.
- Domic AI, Mamani E, Camilo G. Fenología reproductiva de la kewiña (Polylepis tomentella, Rosaceae) en la puna semihúmeda de Chuquisaca (Bolivia). Ecol En Boliv. 2013;48:31–45.
- Hanot P, Herrel A, Guintard C, et al. Unravelling the hybrid vigor in domestic equids: the effect of hybridization on bone shape variation and covariation. BMC Evol Biol. 2019;19(1):1–13.
- Savriama YA. Step-by-step guide for geometric morphometrics of floral symmetry. Front Plant Sci. 2018;9:1–23.
- Klingenberg CP. Size, shape, and form: concepts of allometry in geometric morphometrics. Dev Genes Evol. 2016;226(3):113–137.
- Sheets HD, Covino KM, Panasiewicz JM, et al. Comparison of geometric morphometric outline methods in the discrimination of age-related differences in feather shape. Front Zool. 2006;3:3.
- Boza Espinoza TE, Quispe-Melgar HR, Kessler M. Taxonomic reevaluation of the polylepis sericea complex (Rosaceae), with the description of a new species. Syst Bot. 2019;44(2):324–334.
- Segovia-Salcedo MC, Domic A, Boza T, et al. Situación taxonómica de las especies del género polylepis. Implicancias para los estudios ecológicos, la conservación y la restauración de sus bosques. Ecol Austral. 2018;28(1bis):188–201.
- Schmidt‐Lebuhn AN, Fuchs J, Hertel D, et al. An Andean radiation: polyploidy in the tree genus Polylepis (Rosaceae, Sanguisorbeae). Plant Biol. 2010;12(6):917–926.
- Schmidt-Lebuhn AN, Kessler M, Kumar M. Promiscuity in the Andes: species relationships in polylepis (Rosaceae, Sanguisorbeae) based on AFLP and morphology. Syst Bot. 2006;31(3):547–559.
- Kessler M, Schmidt-Lebuhn AN. Taxonomical and distributional notes on Polylepis (Rosaceae). Org Divers Evol. 2006;6(1):67–70.
- Fernández-Fernández D, Mayorga EF, Cevallos MP. Importancia de los herbarios ecuatorianos en la conservación de plantas Amenazadas. 2015 [cited 2020 Apr 01]. Available from: https://www.researchgate.net/profile/Diana-Fernandez-Fernandez/publication/304215210_Importancia_de_los_Herbarios_Ecuatorianos_en_la_Conservacion_de_Plantas_Amenazadas/links/5769968908ae1a43d23a36f1/Importancia-de-los-Herbarios-Ecuatorianos-en-la-Conservacion-de-Plantas-Amenazadas.pdf
- Mendoza W, Cano A. Diversidad del género polylepis (Rosaceae, Sanguisorbeae) en los Andes peruanos. Rev Peru Biol. 2011;18(2):197–200.
- Viscosi V. Geometric morphometrics and leaf phenotypic plasticity: assessing fluctuating asymmetry and allometry in European white oaks (Quercus). Bot J Linn Soc. 2015;179(2):335–348.
- Piedra-Malagón EM, Albarrán-Lara AL, Rull J, et al. Using multiple sources of characters to delimit species in the genus Crataegus (Rosaceae): the case of the Crataegus rosei complex. Syst Biodivers. 2016;14(2):244–260.
- Miljković D, Stefanović M, Orlović S, et al. Wild cherry (Prunus avium (L.) L.) leaf shape and size variations in natural populations at different elevations. Alp Bot. 2019;129(2):163–174.
- Simpson BBA. Revision of the genus polylepis (Rosaceae: sanguisorbeae). Contrib to Bot. 1979;43(1):1–62. Smithson.
- Manly BFJ, Alberto JAN. Multivariate statistical methods: a primer. CRC press; 2016;4(1):52–54:.
- Borror CM. Analyzing multivariate data. J Qual Technol. 2003;35(4):426.
- Zelditch ML, Swiderski DL, Sheets HD. Geometric morphometrics for biologists: a primer. Academic Press; 2012;2(1):20–50.
- Innangi M, Izzo A. Pinguicula lavalvae (Lentibulariaceae), a new endemic butterwort from southern Italy diagnosed with the aid of geometric morphometrics. Plant Biosyst. 2015;149(6):990–999.
- Escobedo MT, Mendoza JASP PCH. Mahalanobis y las aplicaciones de su distancia estadística. Cult Científica Y Tecnológica. 2015;27(5):20–21.
- Castro SP, Dávila MAG. Caracterización morfológica de 93 accesiones de Capsicum spp del banco de germoplasma de La Universidad Nacional de Colombia-Sede Palmira. Acta Agronómica. 2008;57:247–252.
- Romoleroux K. Flora of Ecuador. In: Harling G, Andersson L, editors. Rosaceae. Copenhagen: Council for Nordic Publications in Botany; 1996. p. 71–89.
- Idu M, Olorunfemi DI, Omonhinmin AC. Systematics value of stomata in some Nigerian hardwood species of Fabaceae. Plant Biosyst. 2000;134(1):53–60.
- Saheed SA, Illoh HC. A taxonomic study of some species in Cassiinae (Leguminosae) using leaf epidermal characters. Not Bot Horti Agrobot Cluj-Napoca. 2010;38:21–27.
- Boza Espinoza TE, Popp V, Kessler M. Guard cell sizes and ploidy levels in Polylepis (Rosaceae). Neotrop Biodivers. 2020;6(1):178–192.
- Dujardin JP. Modern morphometrics of medically important insects. Genet Evol Infect Dis Elsevier Inc. 2011;1(1):473–501.
- Arnqvist G, Martensson T. Measurement error in geometric morphometrics: empirical strategies to assess and reduce its impact on measures of shape. Acta Zool Acad Sci Hungaricae. 1998;44:73–96.
- Lougheed SC, Arnold TW, Bailey RC. Measurement error of external and skeletal variables in birds and its effect on principal components. Auk. 1991;108:432–436.
- Savriama Y, Gómez JM, Perfectti F, et al. Geometric morphometrics of corolla shape: dissecting components of symmetric and asymmetric variation in Erysimum mediohispanicum (Brassicaceae). New Phytol. 2012;196(3):945–954.
- Gardner AG, Gerald JNF, Menz J, et al. Characterizing floral symmetry in the Core Goodeniaceae with geometric morphometrics. PLoS One. 2016;11(5):11.
- Ab SHIPUNOV, Rm BATEMAN, Geometric morphometrics as a tool for understanding Dactylorhiza (Orchidaceae) diversity in European Russia. Biol J Linn Soc. Internet]. 2005;85:1–12. Available from. ;(1):. https://academic.oup.com/biolinnean/article-lookup/doi/10.1111/j.1095-8312.2005.00468.x
- Jdt De C, Essi L, Jms De O. Flower and floral trichome morphology of species of Dyckia Schult. f. (Bromeliaceae, Pitcairnioideae), and their importance to species characterization and genus taxonomy. Acta Bot Brasilica. 2017;31(1):29–41.
- Romero-Torres G. Reserva ecológica Los Ilinizas. Quito, Ecuador: Inst. Ecuatoriano For. Áreas Nat. y Vida Silv; 1997.
- Viscosi V, Fortini P, Slice DE, et al. Geometric morphometric analyses of leaf variation in four oak species of the subgenus Quercus (Fagaceae). Plant Biosyst. 2009;143(3):575–587.
- Brock MT, Weinig C. Plasticity and environment-specific covariances: an investigation of floral-vegetative and within flower correlations. Evolution (N Y). 2007;61:2913–2924.
- Aragundi S, Hamrick JL, Parker KC, Genetic insights into the historical distribution of Polylepis pauta (Rosaceae) in the northeastern cordillera oriental of Ecuador. Conserv Genet. Internet]. 2011;12:607–618. Available from. ;(3):. http://link.springer.com/10.1007/s10592-010-0165-x https://doi.org/10.1007/s10592-010-0165-x
- McGuire JL. Geometric morphometrics of vole (Microtus californicus) dentition as a new paleoclimate proxy: shape change along geographic and climatic clines. Quat Int. 2010;212(2):198–205.
- Klein LL, Caito M, Chapnick C, et al. Digital morphometrics of two north american grapevines (Vitis: vitaceae) quantifies leaf variation between species, within species, and among individuals. Front Plant Sci. 2017;8:1–10.
- Francoy TM, Fonseca VLI. A morfometria geométrica de asas e a identificação automática de espécies de abelhas. Oecologia Aust. 2010;14(1):317–321.
- De Morais DV, Nunes LA, Da Mata VP, et al. Leaf geometric morphometrics among populations of dalbergia ecastaphyllum (L.) taub. Biosci J. 2019;35(6):1789–1798.
- Segovia-Salcedo MC. Phenetic analyses of the genus Polylepis Ruiz&Pav., in three areas of diversification in Ecuador. Ohio University-USA; 2001.
- Lindbladh M, O’Connor R, Jacobson JGL. Morphometric analysis of pollen grains for paleoecological studies: classification of picea from eastern North America. Am J Bot. 2002;89(9):1459–1467.
- Carleial S, Van Kleunen M, Stift M. Small reductions in corolla size and pollen: ovule ratio, but no changes in flower shape in selfing populations of the North American Arabidopsis lyrata. Oecologia. 2017;183(2):401–413.