
ABSTRACT
Tropical dry forests are among the most threatened and yet the most biodiverse Neotropical ecosystems. However, current patterns of biological occupancy in these forests remain poorly studied. Here, we document the diversity, patterns of seasonal turnover and change of species composition over time of birds in a highly exploited but protected tropical dry forest of southwestern Ecuador, Bosque Protector Puyango. Using a combination of mist netting, song recording and direct observations, we surveyed the study site over a 2-month period of fieldwork during both the dry and rainy seasons. We then performed a literature review of the species reported in this site and compared the changes in composition over time using a historical survey. One hundred sixty-one species of birds belonging to 40 families were recorded inside the area. One hundred and six species were found in this survey and 55 were recovered from the literature. Seasonality did not significantly affect species abundance and richness; however, species dominance changed notably. Although the overall species richness of the site has been maintained, we found an overwhelming change of species composition during the last two decades in this forest. Our results show that this highly threatened forest still hosts a unique high avian diversity. Conservation actions should be encouraged in the region, motivating the local communities to develop non-extractive economic practices, such as birdwatching and ecotourism.
Introduction
Tropical dry forests of South America are among the most threatened ecosystems in the world, with only a small fraction of their original ranges remaining [Citation1–3]. These forests harbor high levels of biological diversity and endemism [Citation4–7]. However, little information is available about basic biological aspects (e.g. life history, range of distribution, ecology, and evolution) of species living in these highly threatened and fragile ecosystems. Forest fragmentation can lead to a series of rapid population and ecosystem changes [Citation3,Citation8–10]. One of the first outcomes of habitat fragmentation is the increase of edge-effects, which could influence local ecosystem processes such as microclimatic effects, changes in abundance and distribution of species, and changes of species interactions [Citation11]. These latter effects could lead to more drastic long-term consequences for populations. For instance, sudden population discontinuity decreases migration rates between distant forest patches and, thus, the overall population genetic diversity is rapidly reduced in a few generations [Citation12]. Populations with low rates of intraspecific genetic variability are more vulnerable to stochastic changes of the environment, which could even cause the extirpation of rare endemics [Citation12]. Fragmented forests are also subject to rapid biotic homogenization – taxonomic replacement of rare specialized by dominant generalist species – which is one of the primary causes of biodiversity loss over large spatial scales [Citation13–15]. Understanding the local structure of avian community assembly of these forests is key to determine ecological processes mediating species coexistence and to establish conservation strategies.
Patterns of community assembly are generally determined by dispersal from source to sink populations, followed by environmental filtering [Citation16,Citation17]. Forest fragmentation, however, can drastically change the natural dynamics of community assembly because individual dispersal from source to sink populations is hindered along patchy forests and habitat homogeneity increases the strength of interspecific competition [Citation18]. A number of studies addressing the dynamics of avian communities in disturbed forests have shown that the anthropogenic environmental filtering favors the ecological fitness of generalist species over specialists, due to a reduced variability of habitat and resources [Citation19–22]. Avian species richness and endemism of tropical dry forests are not only influenced by the above mentioned dynamics but are also highly associated with forest phenology and seasonality [Citation23,Citation24]. The seasonality of tropical dry forests is primarily established by the amount of rainfall at specific times of the year, where plant productivity, reproduction, growth, and organic matter turnover drastically change [Citation25]. Birds and many other animals respond to the forest’s seasonality with a variety of different strategies, including seasonal movements (e.g. intra-tropical and elevational migration), shifts in diet, and physiological adaptations. During the dry season, numerous birds from central and eastern North America annually migrate to their wintering grounds in tropical forests of Central and South America. Therefore, the seasonal community assembly of avian species in tropical dry forests is highly influenced by intrinsic behavioral and physiological changes and the presence/absence of migratory species.
In Ecuador, tropical dry forests are usually found close to populated areas and, thus, have been extensively disturbed over time, primarily for agricultural practices and livestock production [Citation3]. Less than 10% of the Ecuadorian dry forests remain forested nowadays [Citation3]. Only three areas preserving large tracks of dry forest have official national protection status: Machalilla National Park, Manglares-Churute Ecological Reserve, and Arenillas Ecological Reserve. All other forest remnants are managed either by local governments, communities, or private owners [Citation26,Citation27]. Unfortunately, little information of the biological diversity present in these forest remnants is available and, consequently, no or few conservation actions have been implemented in such areas.
Although several bird surveys have been conducted in tropical dry forests over the last two decades [Citation28–31], knowledge of patterns of species turnover and abundance is poorly known in fragmented dry forests of the region. Here, we document the taxonomic diversity, abundance, and overall seasonal turnover of the bird community in Bosque Protector Puyango, a small protected dry forest of southwestern Ecuador. The purpose of our study is to provide updated information on the current avian community assembly dynamics present inside Bosque Protector Puyango, which still holds several dry forest fragments, despite its biodiversity maintenance being seriously threatened by habitat destruction, uncontrolled hunting, and introduced species. First, we provide the overall avian species diversity found in the site, from both our field surveys and bibliographic search. Second, we determine patterns of species composition and abundance by seasonality. Third, we perform a brief comparative analysis of changes in species composition over time. Finally, we discuss the importance of enforcing urgent conservation actions to the site.
Methods
Study area
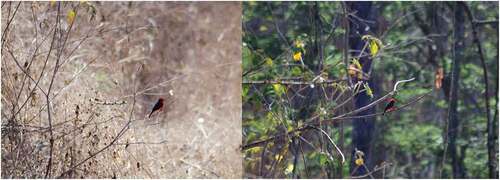
Bosque Protector Puyango (3°53ʹ22.79”S, 80°04ʹ44.07”W, henceforth BP Puyango) is a public protected area on extreme southwestern Ecuador, close to the border with Peru. BP Puyango is categorized as an Important Bird Area (IBA EC073) because several species are endemic to the Tumbesian region, with a large number of range-restricted threatened species [Citation27]. It has 26.59 km2 and is located at the Puyango River Basin – which is delimited to the north by the Cordillera de Tahuín and to the south by the Cordillera de Alamor. BP Puyango is geopolitically divided between the provinces of El Oro (Las Lajas County) and Loja (Puyango county), where the Puyango River marks the division between the provinces []. The area is located in the transition zone between the Pacific lowlands and the western Andean foothills, with an elevational range of 250–650 m a.s.l. BP Puyango has a bimodal climate, the dry season extends between May and December (1–65 mm monthly precipitation, 23.6–25.0°C monthly average temperature) and the rainy season from January to April (67–250 mm monthly precipitation, 24.2–25.3°C monthly average temperature). The average annual temperature is 24.5°C and the average yearly precipitation is 1000 mm [Citation32]. shows an example of the rapid environmental change of the forest structure between seasons. The majority of the landscape of this forest is covered by grasslands and forest remnants are almost exclusively found along ravines.
Figure 1. Study area: Bosque Protector Puyango (turquoise), located in southwestern Ecuador, bisected by the Puyango river and overlapping with Bosque Petrificado de Puyango (gray shaded area). Points indicate the sampling location, color-coded by method as follows, purple: song recording stations, blue: count points, green: mist-netting stations, and yellow: transect starting points.
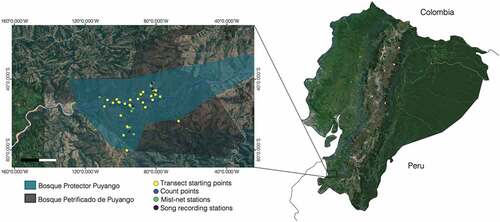
Figure 2. An illustration of the environmental differences by seasonality at BP puyango. the picture shows a perched Vermilion Flycatcher (Pyrocephalus rubinus) during the dry (left) and rainy (right) season. photos were taken by Alejandro Montalvo.
Data collection
We surveyed the bird community at BP Puyango in October, November and December 2013 during the dry season (126 person-hours, 0.4361 km2), and in April 2014 during the rainy season (40 person-hours, 0.2417 km2). Our data were collected using a combination of different sampling methods, including visual observations, mist-netting, and song recording. Visual observations were taken through two approaches, point-counts, and observations along transects. We set permanent point-counts of 50-m radius along two strategic locations of forest remnants (e.g. high avian activity). Point-counts differed in their habitat type, one of them located in a forest gap at early successional stage and the other in a forest edge near a water course. Point-counts were located at a minimum distance of 250 m [Citation33]. Bird surveys with this method were conducted by two researchers for 3 consecutive days and completed during the peak hours of avian activity (0600–1030 h and 1430–1700 h EST). Each point-count was surveyed in both seasons. We chose 22 random points with vegetation remnants inside the study area to locate start points and establish time-limited transects for visual observations. Each transect was sampled once over a limit of 2-hour time-period during the peak hours of avian activity. We only recorded visual detections in our transect sampling. Each transect was sampled by two observers at the same time, with a maximum detection distance of 10-m away of the transect. Whenever possible (e.g. favorable weather conditions), up to 4 transects were sampled daily. We sampled a total of 7 transects during the dry season and 16 during the rainy season. Observational transects were fully sampled over a minimum of 2 hours during the dry season (minimum 2 km and maximum 3 km of distance, approximately), totaling nearly 14 hours of observations. In the rainy season, however, our transect observations lasted approximately 30 minutes (minimum 0.5 km and maximum 1 km of distance, approximately), totaling approximately 8 hours of observations. These differences in sampling effort were considered for all downstream statistical analyses (see below). Four permanent mist-netting stations were placed along the forest remnants in sets of three mist-nets (mesh size = 17 mm, length = 15 m), each set established within a 50-m transect. When weather conditions allowed, nets were opened twice a day at the peak hours of avian activity and monitored every 20 minutes. Mist-nets were sampled for 5 consecutive days in both seasons. Finally, we established 5 audio stations in random locations inside the forest, 2 stations were set during the dry season and 3 during the rainy season. Each audio station consisted of a 30-min audio recording taken twice per day (0630–0700 h and 1530–1600 h EST) using a handy recorder ZOOM H4 next 24-bit/96 kHz (Zoom Corp., Tokyo, Japan). Bird identification from audio recordings was performed with the knowledge of the researchers and by comparing the spectrograms of the obtained avian songs with spectrograms of bird recordings in Moore et al. [Citation34]. We used the software RAVEN Pro: Interactive Sound Analysis Software (Version 1.4) [Citation35] to visualize song spectrograms. High-quality recordings were archived in Xeno-Canto (https://www.xeno-canto.org). Our identifications of bird species obtained from visual observations, mist-nettings, and audio surveys were validated by members of the field team who observed birds continuously and noted all species that we detected. We did not use call/song playback in any of our surveys. Our bird inventory follows the most recent taxonomic classification of the South American Classification Committee [Citation36].
Bibliographic search
To assemble a complete list of the species of BP Puyango, we conducted bibliographic and database searches as described below on 10 April 2017. We performed a literature review for published bird records from BP Puyango in the following databases: Scopus, Google Scholar, Biblioteca Universidad San Francisco de Quito, using “Puyango,” “Pullango,” “El Oro,” “Loja,” each one with the following terms: bird(s), ave(s), avifauna, fauna, diversidad, diversity, biodiversidad, biodiversity. Few relevant references were obtained – most of them just citing specimens already mentioned by Chapman [Citation37–39], Zimmer [Citation40,Citation41], Bond [Citation42], Wiedenfeld et al. [Citation43], Platt [Citation44], Parker et al. [Citation45], Cook [Citation46], Weller [Citation47], Sánchez and Yánez-Muñoz [Citation48]. We also searched for records in Vertnet (http://www.vertnet.org/), a web-based biodiversity data aggregator; and in eBird (http://ebird.org/ebird/hotspot/L2243478 or http://archive.is/l84ox), an online checklist program archiving bird sightings submitted by professional and amateur birdwatchers.
Statistical analyses
We standardized our compiled relative species abundances across methods by normalization after correcting for sampling effort for each season (see details below). Compiled relative abundances were used to estimate diversity indices, categorize abundances, determine species dominance, and visualize differences in species composition by seasonality.
Diversity indices
We estimated overall alpha diversity using Simpson, Shannon-Weiner, and Margalef indices. Similarity of community assembly between seasons was assessed with Jaccard similarity index – adjusted by sampling effort [Citation49] – and Pielou’s evenness index.
Species abundance categorization
Differences in species relative abundance between seasons were evaluated with paired t-tests weighted by sampling effort. We used the orderNorm function built in the R package bestNormalize [Citation50] to normalize our relative abundance data per season (dry season: SD = 0.951, mean = 0.014; rainy season: SD = 0.906, mean = 0.036). Species relative abundances were then classified into five categories, according to the magnitude of the standard deviation: Rare (<2), Uncommon (−2), Common (± 1), Very Common (+2) and Abundant (>2).
Species dominance and composition by seasonality
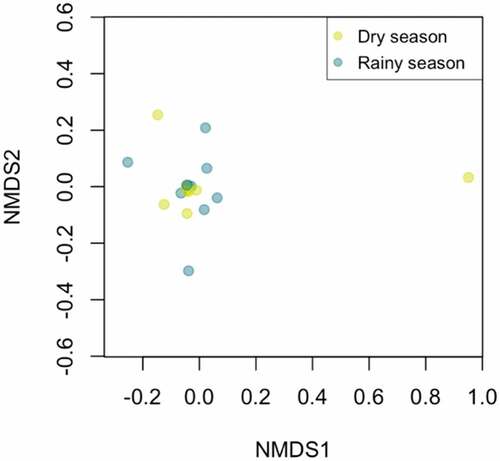
To assess species dominance by seasonality, we fitted our dataset to the following models of relative species abundance: brokenstick (null), niche preemption, log-Normal, Zipf and Zipf-Mandelbrot [Citation51], using the following functions in the R package vegan [Citation52]: rad.null, rad.preempt, rad.lognormal, rad.zipf and rad.zipfbrot. We used the AICc statistic to choose the best fit model for each season and generated rank-abundance curves using the radfit function in vegan [Citation52]. We used the function metaNMDS in vegan [Citation52], with the following parameters: “distance = euclidean”, “k = 2” and “tymax = 100,” to generate a Non-Metric Multidimensional Scaling (NMDS) plot and visualize the position of communities during the dry versus rainy season in multidimensional space.
Species accumulation curves
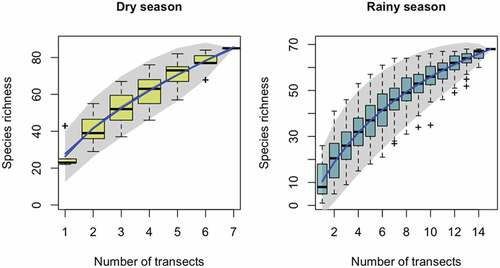
Because the majority of our records were detected by visual observations, we plotted a species accumulation curve of the total number of species detected by number of transects sampled to see whether or not the probability of detecting new species increased with increased number of observational transects on each season. We used the exact method of the function specaccum to find the expected species accumulation curve using sample-based rarefaction [Citation53] in the R package vegan [Citation52]. Then, we used the random method to weigh each site by sampling effort, considering that the sampling effort observational transects during the rainy season was lower than in the dry season.
Change in community assembly over time
Changes in the overall bird community assembly of the BP Puyango during the last two decades was determined by analyzing the only previous rather comprehensive species list from Puyango available: “Conozca las aves del Bosque Petrificado de Puyango” [Citation44]. We compared Platt’s survey from 1991 to our updated field records. Because methods and sampling effort are unfortunately not detailed in Platt’s survey, we limited this analysis to provide a general descriptive overview of potential changes in species composition over time based on presence-absence.
Results
In our field surveys, we recorded 106 species, belonging to 24 families, occurring at the BP Puyango []. In total, including our records and those reported in the literature, 161 bird species (40 families) have been documented at the BP Puyango []. During the dry season, 91 species were recorded (sampling effort = 288.92 person-hours/km2) and 73 species in the rainy season (sampling effort = 165.5 person-hours/km2), with 16 species only recorded during the rainy season (despite its lower sampling effort). Most species were recorded through direct observational techniques (point-counts, transects and mist-netting). However, we identified a total of 42 species throughout the analysis of song spectrograms, 2 of which were not detected by either observations nor mist-netting: Grallaria watkinsi and Ciccaba virgata. Overall, we found that the avian community of the site is speciose and diverse but uneven. Jaccard’s similarity index of species composition – adjusted by sampling effort between seasons was 0.55. Margalef index, which relates species number and total amount of individuals, was 15.64 for the dry season and 16.78 for rainy season. In addition, we found a considerable dominance of few species, indicating that the evenness between species in the community was low (Simpson index: λ = 0.98; Shannon-Wiener index = 3.93; Pielou’s evenness index = 0.21),
Table 1. List of species at BP Puyango. (e) Endemic, (*) Present only in one season. Abundances reported by Platt in 1991 are shown in italics and abundances reported from bibliographic sources are shown in bolded italics
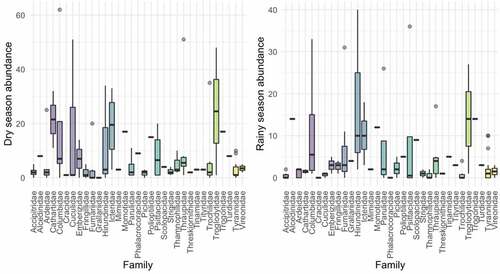
Figure 3. Boxplot of the avian community in BP puyango by family and seasonality. Dots represent the abundance of different species within a family.
Seasonality and abundances
Overall, species abundances were significantly different between the dry and rainy seasons (t210 = 3.48, P < 0.001). During the rainy season, the following species were less abundant: Amazilia Hummingbird (Amazilia amazilia), Red-Masked Parakeet (Psittacara erythrogenys), Striated Heron (Butorides striata), Blue-Ground Dove (Claravis pretiosa), Black Vulture (Coragyps atratus), Groove-Billed Ani (Crotophaga sulcirostris), White-Edged Oriole (Icterus graceannae), White-Tipped Dove (Leptotila verreauxi), Tropical Parula (Setophaga pitiayumi), Neotropic Cormorant (Phalacrocorax brasilianus) and Southern-Rough-Winged Swallow (Stelgidopteryx ruficollis). In contrast, the following species increased their abundance during the rainy season: Plain-Brown Woodcreeper (Dendrocincla fuliginosa), Yellow-Tailed Oriole (Icterus mesomelas), Pallid Dove (Leptotila pallida), Gray-Breasted Martin (Progne tapera) and Tumbes Swallow (Trachycineta stolzmanni).
We found that the structure of dominant species changed between seasons [, ]. During the dry season, our best fit model of species dominance followed a log-Normal model. We found a greater dominance of conspicuous species such as Leptotila verreauxi, Sicalis flaveola, Amazilia amazilia, Crotophaga_sulcirostris and Campylorhynchus_fasciatus. During the rainy season, our data best fitted the Zipf-Mandelbrot model. The predominant detected species in this season were Tachycineta_stolzmanni, Brotogeris_pyrrhoptera, Columbina_buckleyi, and Furnarius leucopus. Differences in community assembly between seasons can be also visualized in our NMDS plot [].
Table 2. Results of rank-abundance dominance (RAD) models by seasonality. The best fit models display the lowest deviance, lowest AIC and lowest AICc (*)
Figure 4. Rank-Abundance dominance curves of the bird species from BP puyango by seasonality. best fit model of species dominance is log-Normal during the dry season (green line) and Zipf-Mandelbrot during the rainy season (Orange line). Blue dots represent different species.
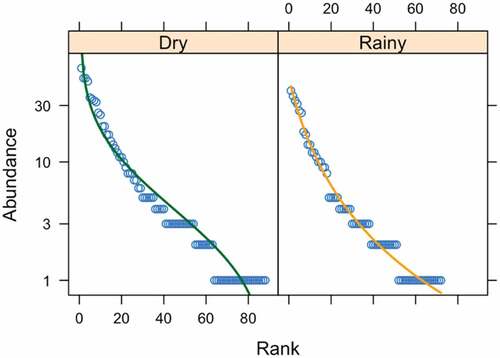
Figure 5. Non-metric multidimensional scaling (NMDS) for the abundance of bird species observed during the dry (yellow dots) and rainy (blue dots) season in BP puyango. Dots represent species’ abundances found within a sampling unit.
The species accumulation curve shows an increasing trend of species detection when increasing the number of transects sampled in both seasons. However, our curves do not stabilize and the magnitude of detection of new species starts to get constrained after the last transect [].
Figure 6. Species accumulation curve by number of transects sampled on each season. The expected curve under 100 permutations is shown in dark blue. Gray shade is showing the 0.95 confidence area. Boxplots show the averaged species richness weighted by sampling effort found from linear interpolation of single random permutations.
Change in community assembly over time
Platt [Citation44] identified a total of 101 bird species from the site. Forty-one species documented on her list were also detected in our survey, whereas 40 species were not detected in our study. After validating taxonomic names, we found 20 misidentifications in her inventory, corresponding to species that do not belong to the Ecuadorian tropical dry forest range. The families that seem to have gained species (e.g. species that Platt’s study failed to detect) are the following: Tinamidae (1), Columbidae (4), Cuculidae (2), Trochilidae (3), Scolopacidae (1), Ardeidae (3), Threskiornithidae (1), Accipitridae (3), Strigidae (1), Trogonidae (1), Momotidae (1), Picidae (3), Psittacidae (2), Thamnophilidae (3), Furnariidae (5), Grallariidae (1), Tyrannidae (14), Vireonidae (1), Hirundinidae (2), Troglodytidae (2), Polioptilidae (1), Thraupidae (2), Emberizidae (2), Parulidae (4), and Fringillidae (2). In contrast, families that presumably lost species are the following: Podicipedidae (1), Cuculidae (2), Trochilidae (1), Accipitridae (4), Tytonidae (1), Psittacidae (1), Alcedinidae (1), Falconidae (3), Psittacidae (1), Tyrannidae (5), Tityridae (3), Corvidae (1), Hirundinidae (1), Troglodytidae (1), Thraupidae (6), Cardinalidae (2), Parulidae (1), Icteridae (2), and Fringilidae (2).
Discussion
Our study provides an updated and detailed survey of the bird community present in the BP Puyango, including information on patterns of seasonal turnover and changes of species composition overtime. Our results demonstrate that BP Puyango is an important hotspot of avian diversity and endemism of the Tumbesian region, by showing high levels of species richness (Shannon-Wiener index = 3.93 and Pielou evenness index = 0.21) along the very few forest remnants of the area. We recorded a total of 161 bird species occurring within the BP Puyango, 106 of which were recorded during our fieldwork.
Tropical dry forest ecosystems are typically dominated by ecologically restricted taxa, which are the most sensitive to ecological disturbance [Citation54]. The species occurring within BP Puyango showed a typical avian species composition of the Tumbesian dry forests, with high diversity and dominance of few species [Citation55]. Patterns of community assembly were similar in both seasons, with a remarkable dominance of few avian species (up to 15% of the total number of species). Our results resemble the patterns found in other tropical dry forests, such as the dry forests of southwestern Mexico [Citation56] and Dominican Republic [Citation57]. The best fit model of species dominance was log-Normal during the dry season, which assumes that the logarithmic species abundances are normally distributed among the community. Thus, a few species have either high or low abundances and most of the species possess intermediate abundances. These results suggest that during this season the majority of species might be specialists, likely restricted to occur in single habitat types or that might adjust their diet in response to seasonality. For instance, Des Granges [Citation58] demonstrated that the broad-billed Hummingbird (Cynanthus latirostris) adjusts its diet to feed exclusively on insects during periods of flower scarcity. Despite correcting our analyses for differences in our sampling efforts between seasons, we consider that these differences might have influenced the number of species recorded at each season.
During the rainy season, the best fit model of species dominance was Zipf-Mandelbrot, which estimates a decay coefficient based on the proportion of the most abundant species. The model predicts a concave dominance-diversity of the community, with a larger number of rare species. In fact, despite most species (80%) were detected from direct observations during the dry season, in the rainy season we identified 16 species that were not recorded in the dry season. During the rainy season, we only found year-round residents. Year-round residents are adapted to seasonal changes and often synchronize their breeding season with the time of food availability [Citation25]. However, the presence or absence of intra-tropical migrants was also expected in both seasons, as these species have the ability to move across forests to track their preferred food resources (usually fruits and nectar [Citation59]), which might be abundant or scarce depending on the season. Asterisks in indicate the species that were only found in one season and not in other, from those species only Tyrannus niveigularis – found in the dry season only – is recognized as an intra-tropical migrant [Citation60]. We found a similarity index of 0.55 for species composition – after correcting for sampling effort – between seasons, suggesting that 45% of the community assembly changes between seasons.
We noticed a similar association pattern between species dominance and forest structure to previous studies of avian diversity in dry forests [Citation31,Citation61,Citation62]. During the dry season, the most abundant species are those that prefer open and arid habitats, whereas dominant species in the rainy season are those that prefer foraging in forested/shrubby areas. Most birds breed during the rainy season in tropical dry forests [Citation63,Citation64] and thus, species likely increased their frequency of vocal displays – marking territoriality or searching for a mate – and were probably detected more often during this season in our audio surveys. We noticed that the Southern Rough-winged Swallow was probably nesting during the sampling season in October 2013, as this species was observed in flocks of numerous individuals in bank areas. According to the registers of Ridgely and Greenfield [Citation60], Miothlypis fraseri is commonly found in both seasons; however, we documented this species as more abundant during the rainy season – specially in our song detections.
In our brief comparative analysis of change in species composition over the last two decades within the BP Puyango, we found that Platt’s species survey form 1991 – who lived around 2 years on the site birdwatching – includes 40 species that we failed to detect during our sampling period. Therefore, it is possible that those species are actually present in the site but were not detected in our sampling or that such species were replaced by others – due to human-related or climate-induced changes of the natural vegetation of the area. Habitat fragmentation plays an important role lowering connectivity of local species with source populations, resulting in a rapid extrapolation of local endemics. Local extinction might promote ecological opportunity for other species – with higher dispersal abilities than those extrapolated populations – to rapidly colonize those recently opened niches. In theory, when a species becomes locally extinct, the expectation is that it will be replaced by a close relative – as closely related species often share similar traits that allow them to easily adapt to that particular niche [Citation65]. However, when the cause of local extinction is habitat loss, recently extrapolated species are often replaced by opportunistic generalist species [Citation66], which might be the case in BP Puyango.
We found a positive trend of species detection by number of transect sampled. We found 50% of the species diversity of BP Puyango within 4 transects during the rainy season. However, our species accumulation curves of both seasons do not stabilize, indicating that we likely failed to detect all species present in the area during our limited field expeditions. The more effort (more transects) the greater the chances of encountering less common and even rare species. For future studies of avian species detection in Tumbesian forests, we suggest increasing the sampling effort of direct observations.
Conservation
Dry forests from central-western Ecuador to northwestern Peru have been regarded as a distinct biogeographic unit, the Ecuadorian province (sensu Morrone [Citation67] – also called Tumbesian centre), including tropical dry forests and shrublands distributed across the Pacific lowlands, western Andean versant, and inter-Andean valleys from central and southern Ecuador to northern and central Peru [Citation68–71]. The Ecuadorian biogeographic province (EBP) is a region of global conservation priority and one of the most important areas of avian endemism worldwide, with 54 IBAs and over 60 endemic species [Citation27,Citation60,Citation72–75]. Most landscapes in the EBP are nowadays a patchwork of croplands with small, forested relicts – usually confined to spaces unsuitable for cultivation. Even in the few areas where forests stretch unbroken for more than few kilometers, the understory is sometimes degraded by overgrazing mostly [Citation27]. In Ecuador, only three IBAs preserving large tracks of dry forest from the EBP have official national protection status (Machalilla National Park, Manglares-Churute Ecological Reserve, and Arenillas Ecological Reserve). All other IBAs with important fragments of dry forest are small, immersed in a deforestation matrix, and managed by local governments, communities or private owners [Citation26,Citation27]. To date, little information of the biological diversity present in these latter is available.
Unfortunately, there is a concerning lack of knowledge about the fauna diversity inhabiting the area. Due to the high threat of human disturbance in these forests – logging and overgrazing – many species could be critically endangered to local extinction [Citation76]. The forestry, natural areas and wildlife conservation law [Citation77] establish that areas with vegetative formations both public and private are considered as protected forests where climatic conditions and soil are not suitable for agriculture or livestock. Thus, the function of protective forests is to protect and conserve soil, landscape, flora and fauna of the site. BP Puyango is managed by the autonomous provincial governments of El Oro and Loja. Its headquarters are located at the entrance of the town of the same name, on the northern bank of the Puyango River. Park facilities include a tourist interpretation centre and housing for staff. The protected area overlaps with the Puyango Petrified Forest, a fossil deposit of petrified wood officially declared as part of Ecuadorian Natural/Cultural Heritage. Most management efforts at Puyango have focused on promoting tourism to the petrified forest and unfortunately, any conservation actions have been done to conserve soil, landscape, flora and fauna.
During our fieldwork, we witnessed logging activity and observed that more than 80% of the landscape forming the protected forest consisted of grasslands. Although there is a very good legal framework for management of protected areas in Ecuador, no action has been taken to control extractive activities that seriously threaten the integrity of the few remaining dry forests of the region, which is characterized by a high biological importance. Protected forests are not part of the state´s forestry heritage [Citation78] and are handled by municipal governments, so perhaps the absence of direct intervention from the Ministry of Environment makes more difficult its effective management. The importance of preserving the south-western dry forests of Ecuador underlies on its occurrence to the highly endemic Tumbesian region [Citation79]. Ecuador is one of the favorite places for bird watching, primarily due to its wide species richness and high levels of endemism [Citation80]. Thus, in order to prevent further diversity loss and keep attracting birdwatchers, it is necessary not only to increase knowledge about population dynamics and plasticity of biological species inhabiting these forests but also to improve the conservation management of the area. Our results show that despite BP Puyango has been subject of a concerning anthropogenic disturbance over time, remnants of this forest are still highly speciose. Although the composition of avian species in BP Puyango has apparently changed over a two-decade time period, the number of species present in the area has been maintained. In our field expeditions, we recorded 30 endemic species. We suggest an urgent implementation of conservation actions in the area, especially by engaging the local community through environmental education and non-extractive economic activities such as birdwatching.
Acknowledgments
We thank T. Scott Sillett, Ernesto Ruelas Inzunza and anonymous reviewers for their positive feedback of the manuscript. We thank A. Montalvo, A. N. Acosta, M. Carrera and J. Valdés for their assistance and companionship in the field; to M. Sánchez, for continuously supporting the development of this project; to I. Encalada Ludeña; and P. Beltrán and D. Proaño, for logistics support.
Disclosure statement
No potential conflict of interest was reported by the author(s).
Additional information
Funding
References
- Janzen DH. Management of habitat fragments in a tropical dry forest: Growth. Ann Missouri Bot Garden. 1988a;75(1):105–116.
- Mass JM. Conversion of tropical dry forest to pasture and agriculture. In: Mooney SH, Bullock H.a, Medina E, editors. Seasonally dry tropical forest. Cambridge UK: Cambridge University Press; 1995. p. 399–422.
- Portillo-Quintero CA, Sánchez-Azofeifa GA. Extent and conservation of tropical dry forests in the Americas. Biol Conserv. 2010;143(1):144–155.
- Murphy PG, Lugo AE. Ecology of tropical dry forest. Annu Rev Ecol Evol Syst. 1986;17(1):67–88.
- Janzen DH. Tropical dry forests: the most endangered major tropical ecosystem. In: Wilson EO, editor. Biodiversity. Washington, USA: National Academy Press; 1988b. p. 130–137.
- Miles L, Newton AC, DeFries RS, et al. A global overview of the conservation status of tropical dry forests. J Biogeograph. 2006;33(3):491–505.
- Cueva Ortiz J, Espinosa CI, Quiroz Dahik C, et al. Influence of anthropogenic factors on the diversity and structure of a dry forest in the central part of the Tumbesian region (Ecuador–perú). Forests. 2019;10(1):1–31.
- Fahrig L. Effects of habitat fragmentation on biodiversity. Annu Rev Ecol Evol Syst. 2003;34(1):487–515.
- Wilson MC, Chen XY, Corlett RT, et al. Habitat fragmentation and biodiversity conservation: key findings and future challenges. Landscape Ecol. 2016;31(2):219–227.
- Miller-Rushing AJ. How does habitat fragmentation affect biodiversity? A controversial question at the core of conservation biology. Biol Conserv. 2019;232:271–273.
- Murcia C. Edge effects in fragmented forests: implications for conservation. Trends Ecol Evol. 1995;10(2):58–62.
- Olden JD, Poff NLR, Douglas MR, et al. Ecological and evolutionary consequences of biotic homogenization. Trends Ecol Evol. 2004;19(1):18–24.
- Clavel J, Julliard R, Devictor V. Worldwide decline of specialist species: toward a global functional homogenization? Front Ecol Environ. 2011;9(4):222–228.
- Dar PA, Reshi ZA. Components, processes and consequences of biotic homogenization: a review. Contemp Probl of Ecol. 2014;7(2):123–136
- Gámez-Virués S, Perović D, Gossner M, et al. Landscape simplification filters species traits and drives biotic homogenization. Nat Commun. 2015;6(1):8568.
- Graves GR, Rahbek C. Source pool geometry and the assembly of continental avifaunas. Proc Nat Acad Sci. 2005;102(22):7871–7876.
- Mittelbach GG, Schemske DW. Ecological and evolutionary perspectives on community assembly. Trends Ecol Evol. 2015;30(5):241–247.
- Gómez JP, Bravo GA, Brumfield RT, et al. A phylogenetic approach to disentangling the role of competition and habitat filtering in community assembly of Neotropical forest birds. J Anim Ecol. 2010;79(6):1181–1192.
- Wilson EO. Causes of ecological success: the case of the ants. J Anim Ecol. 1987;56(1):1–9.
- Newbold T, Scharlemann JPW, Butchart SHM, et al. (2013). Ecological traits affect the response of tropical forest bird species to land-use intensity. , 280:20122131.
- Salgado-Negret B, Paz H. Escalando de los rasgos funcionales a procesos poblacionales, comunitarios y ecosistémicos. In: Salgado-Negret B, editor. La ecología funcional como aproximación al estudio, manejo y conservación de la biodiversidad. Bogotá Colombia: Protocolos y aplicaciones Instituto de Investigación de Recursos Biológicos Alexander von Humboldt; 2015. p. 12–35.
- Paz Silva C, Sepúlveda RD, Barbosa O. Nonrandom filtering effect on birds: species and guilds response to urbanization. Ecol Evol. 2016;6(11):3711–3720.
- Olmos F, Silva WADG, Albano CG. Aves em oito áreas de Caatinga no sul do Ceará e oeste de Pernambuco, nordeste do Brasil: composição, riqueza e similaridade. Papéis Avulsos de Zoologia (São Paulo). 2005;45(14):179–199
- Albuquerque UP, de Lima Araújo E, El-Deir ACA, et al. Caatinga revisited: ecology and conservation of an important seasonal dry forest. Sci World J. 2012;2012:1–18.
- Ceballos G. Vertebrate diversity, ecology and conservation in neotropical dry forests. In: Bullock SH, Mooney HA, Medina E, editors. Seasonally dry tropical forests. 1st ed. Cambridge UK: Cambridge University Press; 1995. p. 195–220.
- Sierra R, Campos F, Chamberlin J. Assessing biodiversity conservation priorities: ecosystem risk and representativeness in continental Ecuador. Landscape Urban Plann. 2002;59:95–110.
- BirdLife International. (2017a). Important Bird Areas factsheet: Bosque Protector Puyango. Accessed on: 2017-04-09. http://www.birdlife.org.
- Orihuela-Torres A, Tinoco B, Ordóñez-Delgado L, et al. Knowledge Gaps or Change of Distribution Ranges? Explaining New Records of Birds in the Ecuadorian Tumbesian Region of Endemism. Divers. 2020;12:66.
- Freile JF, Moreano M, Bonaccorso E, et al. Notas sobre la historia natural, distribución y conservación de algunas especies de aves amenazadas del suroccidente de Ecuador. Cotinga. 2004;21:18–24.
- Bonaccorso E, Santander T, Freile JF, et al. Avifauna and conservation of the Cerro Negro-cazaderos area, tumbesian Ecuador. Cotinga. 2007;27:61–66.
- Tinoco BA. Estacionalidad de la comunidad de aves en un bosque deciduo tumbesino en el sur occidente de Ecuador. Ornitología Neotropical. 2009;20:157–170.
- INAMHI: Instituto Nacional de Meteorología e Hidrología (2012). Anuario Meteorológico N° 52-2012. Accessed on: 2016-02-19. http://www.serviciometeorologico.gob.ec/wp-content/uploads/anuarios/meteorologicos/Am%202012.pdf.
- Ralph CJ, Droege S, Sauer JR. Managing and monitoring birds using point counts: standards and applications. Albany (CA): Department of Agriculture, Forest Service, Pacific Southwest Research Station; 1995. p. 161–168.
- Moore JV, Krabbe N, Janh O. Bird sounds of Ecuador. MP3 DVD ed. San Jose CA, USA: Jhon V. Moore Nature Recordings; 2013.
- Bioacoustics Research Program.Raven pro: interactive sound analysis software (version 1.5) computer software.Ithaca (NY):The Cornell Lab of Ornithology; 2014. Ithaca, NY, USA.
- Remsen JV Jr., Areta JI, Bonaccorso E, et al. Version 2021. A classification of the bird species of South America. American Ornithological Society.
- Chapman FM. Descriptions of proposed new birds from Venezuela, Colombia, Ecuador, Peru, and Chile. Am Mus Novit. 1923;96:1–12.
- Chapman FM. Descriptions of new birds from Ecuador, Colombia, Peru, and Bolivia. Am Mus Novit. 1924;138:1–16.
- Chapman FM. Descriptions of new birds from Colombia, Ecuador, Peru, and Argentina. Am Mus Novit. 1925;160:1–14.
- Zimmer JT. Studies of Peruvian birds. No. XLI. the genera hylophilus, smaragdolanius, and cyclarhis. Am Mus Novit. 1942;1160:1–16.
- Zimmer JT. Studies of Peruvian birds. No. 54, the families catamblyrhynchidae and parulidae. Am Mus Novit. 1949;1428:1–59.
- Bond J (1954). Notes on Peruvian Piciformes Proceedings of the Academy of Natural Sciences of Philadelphia. 106:45–61.
- Wiedenfeld DA, Schulenberg TS, Robbins MB. Birds of a tropical deciduous forest in extreme northwestern Peru. Ornithol Monogr 1985; 36 305–315 doi: 10.2307/40168288
- Platt D. Conozca las aves de bosque petrificado de puyango. Quito Ecuador: FEPROTUR; 1991.
- Parker TA III, Schulenberg TS, Kessler M, et al. Natural history and conservation of the endemic avifauna in north-west Peru. Bird Conserv Int. 1995;5(2–3):201–231.
- Cook AG. Avifauna of North-western Peru biosphere reserve and its environs. Bird Conserv Int. 1996;6(2):139–165.
- Weller AA. Biogeography, geographic variation and habitat preference in the Amazilia Hummingbird, Amazilia amazilia Lesson (Aves: trochilidae), with notes on the status of Amazilia alticola Gould. Journal Für Ornithologie. 2000;141(1):93–101.
- Sánchez JC, Yánez-Muñoz M. Herpetofauna. Capítulo IV: manglares y Zona Marino Costera. En: una Guía para Ecosistemas Andino-Costeros Mena-Valenzuela, Patricio, Garzón-Santomaro, César . In: Publicación Miscelánea N°. Vol. 7. Quito Ecuador: Serie de Publicaciones MECNINB – GADPEO; 2015.
- Chao A, Chazdon RL, Colwell RK, et al. A new statistical approach for assessing similarity of species composition with incidence and abundance data. Ecol Lett. 2005;8(2):148–159.
- Peterson RA, Cavanaugh JE. Ordered quantile normalization: a semiparametric transformation built for the cross-validation era. Journal of Applied Statistics. 2020. 47:13-15 ;2312–2327.
- Wilson JB. Methods for fitting dominance/diversity curves. J Veg Sci. 1991;2(1):35–46.
- Oksanen J, Blanchet FG, Kindt R et al, et al. vegan: Community Ecology Package R package version 2.5-7. 0–2 ed. 2020. https://CRAN.R-project.org/package=vegan
- Chiarucci A, Bacaro G, Rocchini D, et al. Discovering and rediscovering the sample-based rarefaction formula in the ecological literature. Community Ecol. 2008;9(1):121–123
- Prieto-Torres DA, Rojas-Soto OR, Santiago-Alarcon D, et al. Diversity, endemism, species turnover and relationships among avifauna of neotropical seasonally dry forests. Ardeola. 2019;66(2):257–277.
- Garmendia A, Samo A. Prácticas de ecología. Valencia Spain: Universidad Politécnica de Valencia; 2005.
- Almazán-Núñez RC, Alvarez-Alvarez EA, Pineda-López R, et al. Seasonal variation in bird assemblage composition in a dry forest of southwestern Mexico. Ornitología Neotropical. 2018;29:215–224.
- Latta SC, Brouwer NL, Mejía DA, et al. Avian community characteristics and demographics reveal how conservation value of regenerating tropical dry forest changes with forest age. PeerJ. 2018;6:e5217.
- Des Granges JL. Organization of a tropical nectar feeding bird guild in a variable environment. Living Bird. 1987;17:199–236.
- Levey DJ, Stiles FG. Evolutionary precursors of long distance migration: resource availability and movement patterns in Neotropical landbirds. Am Natur. 1992;140(3):447–476.
- Ridgely RS, Greenfield PJ. Aves del Ecuador: guía de campo. Quito Ecuador: Fundación de conservación Jocotoco and Academia de Ciencias Naturales de Filadelfia; 2006.
- Mischler T. Status, abundance, seasonality, breeding evidence and an updated list of the birds of Cerro Blanco, Guayaquil, Ecuador. Cotinga. 2012;34:60–72.
- Almazán-Núñez RC, Charre GM, Pineda-López R, et al. Relationship between bird diversity and habitat along a pine- oak successional forest in Southern Mexico. In: Dos Santos Viana HF, Morote FAG, editors. New Perspectives in Forest Science. London UK: IntechOpen; 2017. p. 185.
- Wikelski M, Hau M, Wingfield JC. Seasonality of reproduction in a neotropical rainforest bird. Ecology. 2000;81(9):2458–2472.
- Araujo HFP, Vieira-Filho AH, Barbosa V, et al. Passerine phenology in the largest tropical dry forest of South America: effects of climate and resource availability. Emu - Austral Ornithology. 2017;117(1):78–91.
- Webb C, Ackerly D, McPeek MA, et al. Phylogenies and community ecology. Annu Rev Ecol Syst. 2002;33(1):475–505.
- Vázquez-Reyes LD, Arizmendi M, Godínez-Álvarez HO, et al. Directional effects of biotic homogenization of bird communities in Mexican seasonal forests. Condor. 2017;119(2):275–288.
- Morrone JJ. Biogeographical regionalisation of the neotropical region. Zootaxa. 2014;3782(1):1–110.
- Gentry AH. Diversity and floristic composition of neotropical dry forests. In: Bullock SH, Mooney HA, Medina E, editors. Seasonally dry tropical forests. Cambridge UK: Cambridge University Press; 1995. p. 146–194.
- Pennington RT, Prado DE, Pendry CA. Neotropical seasonally dry forests and Quaternary vegetation changes. J Biogeograph. 2000;27(2):261–273.
- Linares-Palomino R. Los bosques tropicales estacionalmente secos: i. El concepto de los bosques secos en el Perú. Arnoldia. 2004;11:85–102.
- Espinosa CI, De la Cruz M, Luzuriaga AL, et al. Bosques tropicales secos de la región Pacífico Ecuatorial: diversidad, estructura, funcionamiento e implicaciones para la conservación. Ecosistemas. 2012;21:167–179.
- Müller P. The dispersal centres of terrestrial vertebrates in the Neotropical realm. Netherlands:The Hague;1973. Junk.
- Cracraft J. Historical Biogeography and patterns of differentiation within the South American avifauna: areas of endemism. Ornithol Monogr. 1985;36(36):49–84
- Best BJ, Kessler M. Biodiversity and conservation in tumbesian Ecuador and Peru. Cambridge UK: BirdLife International; 1995.
- Stattersfield AJ, Crosby MJ, Long AJ, et al. Endemic Bird Areas of the World. Priorities for biodiversity conservation Brooks, Duncan. In: BirdLife conservation series. Vol. 7. Cambridge UK: BirdLife International; 1998.
- Balcázar CI, Díaz AP (2008). Alternativas de manejo para el bosque Suquinda, parroquia Yamana, cantón Paltas, provincia de Loja. Undergraduate thesis. Loja Ecuador: Universidad Nacional de Loja.
- Registro Oficial Nº 418 10 09. 2004. N° 74 - Ley forestal y de conservación de áreas naturales y vida silvestre. Edición Especial, Quito, Ecuador.
- Puente MC. Perdidos entre las leyes y los árboles: propiedad y posesión de un bosque protector ecuatoriano. Quito Ecuador: Abya-Yala; 2008.
- Aguirre Z, Kvist L. Floristic composition and conservation status of the dry forests in Ecuador. Lyonia, a J of Ecol and Appl. 2005;8:41–67.
- Castillo B (2012). Identificación y dinamización del Corredor de Endemismo Tumbesino, sector Bosque Petrificado de Puyango. Undergraduate thesis. Loja, Ecuador: Universidad Nacional de Loja.