
ABSTRACT
In Northwest Argentina, nothing is known about the relationship of Araneae and Coleoptera with sugar cane crops. Using pitfall traps in three continuous native forest sites (N) and three native forest windbreaks surrounded by sugar cane crops (W) in the province of Salta, we assessed a)- whether the native diversity of epigeal Araneae and Coleoptera in the Chaco Serrano forest changes as a result of the fragmentation of the habitat caused by the sugar cane plots, and b)- whether the diversity of predatory species increases in native forest windbreaks as a consequence of the contribution of species that come from crops. In the spring of 2006 and the summer of 2007, we collected 599 Araneae and 555 Coleoptera, with community W (S = 132, N = 535) containing much more species but fewer individuals than community N (S = 111, N = 619). We found that the spatial and phenological patterns of the alpha and beta diversities of N were altered in W communities. Thus, habitat fragmentation generated by sugar cane plots led to the local extinction of native Araneae and Coleoptera species. The abundance of generalist Araneae and herbivorous Coleoptera increased in W habitats, but the coprophagous and detritivorous beetles decreased. The diversity of predatory species (Araneae and some Coleoptera) increased in W habitats, although their abundance declined relative to N habitats. Species turnover determined beta diversity between N and W sites; however, between the W sites, nestedness increased and spiders showed a greater loss of species. The spatial heterogeneity between sites, seasons, and habitats had a substantial effect on the composition of the Araneae and Coleoptera assemblages, hence influencing regional diversity. Eight species were habitat indicators, particularly Leprolochus birabeni (Zodariidae), which responds unfavourably to perturbations in the agricultural landscape, and could be deployed as environmental monitors in the Chaco Serrano.
Introduction
The expansion of the agricultural frontier is one of the principal causes of native forest decline [Citation1], resulting in habitat fragmentation, loss, and degradation [Citation2]. In this regard, the South American Chaco is a significant ecoregion that requires conservation efforts, as it is the only remaining dry subtropical forest in the world [Citation1,Citation3], and various productive ventures have replaced its natural ecosystems. The Argentine Chaco has the greatest rates of deforestation in the country [Citation4], and the Serrana subregion has lost 94% of its forests over the past 30 years [Citation5]. The principal threat to Chaco’s biodiversity is the decrease and fragmentation of its habitats [Citation6]. Due to its vulnerability, the Chaco is one of the most important ecoregions of the country to conserve [Citation7,Citation8]. In order to mitigate the detrimental impacts of agricultural growth in the Argentine Chaco, a number of regulations were enacted in the country thirty years ago regulating the preservation of forest windbreaks [Citation9]. These were created to prevent and alleviate wind erosion in agricultural fields, as well as to preserve and connect the remaining woodland remnants inside the agricultural matrix. However, these restrictions were ineffective, compliance was limited, and the size of forest windbreaks, particularly in Chaco regions, declined over time until they disappeared [Citation9].
In Argentina, the cultivation of sugar cane (Saccharum spp.) has increased in recent years and is expanding in the Chaco Serrano and Yungas forests of Tucumán, Salta, and Jujuy provinces in the country’s Northwest. The aforementioned provinces produce 98% of the nation’s sugar cane, with their cultivated area increasing by almost 24% between 2004 and 2018 [Citation10]. This change in land use has resulted in the fragmentation of continuous forest regions into patches of varying sizes and degrees of isolation. Habitat fragmentation affects the functioning of the ecosystem [Citation11] and has severe effects on biodiversity [Citation12] due to the disruption of population and biotic community organisation [Citation13], the extinction of local species [Citation14], and the increase in genetic isolation [Citation15].
Using guilds [Citation16] is a useful method for determining how biotic communities react to habitat modification. Guilds are non-phylogenetic groups of animals that share one or many valuable resources [Citation17]. This approach is interesting because, regardless of taxonomic composition, the majority of the time its members respond similarly to the same environmental changes, and they can also play similar functional roles in the community [Citation16].
The agricultural landscape can affect Araneae and Coleoptera because they respond significantly to habitat structure and are the most sensitive taxa to small-scale spatial changes [Citation18]. This resulted in the proposal of these taxa as bio-indicators for assessing the effects of agriculture on biodiversity [Citation19,Citation20]. Araneae are among the most diverse terrestrial arthropod predators in the world [Citation16], distinguished by their ubiquity and great sensitivity to habitat quality and environmental change [Citation21], and exhibiting taxon-guild responses [Citation22]. On the other hand, Coleoptera are the most diverse group of insects, they are found in all ecosystems [Citation23], and their different feeding patterns represent all trophic roles [Citation24], therefore they can be extremely valuable as tools for environmental monitoring and assessment [Citation25,Citation26].
In northwestern Argentina, the expansion of sugar cane cultivation may have had various consequences on the biodiversity of arthropods, particularly Araneae and Coleoptera. According to studies conducted in other sugar cane producing nations [Citation27,Citation28], this crop supports a rich diversity of Araneae and predatory Coleoptera. However, nothing is known in Argentina about the relationship between these two arthropod taxa and sugar cane crops. There is only one publication that deals with a Curculionidae (Coleoptera) species which is considered a pest of sugar cane [Citation29]. Recent investigations in the Chaco Serrano of Salta province have improved our understanding of spiders [Citation30–33], although information on coleopterans is sparse [Citation30,Citation34]. In this study, we evaluate whether the diversity of epigeal Araneae and Coleoptera in the Chaco Serrano forests changes as a result of the fragmentation of the habitat caused by sugar cane plots, which alter the shelter, feeding, dispersal, and reproduction conditions of these organisms. For this reason, we expect a decrease in species richness, abundance, family composition, and trophic guilds in their communities inhabiting native forest windbreaks within the sugar cane agricultural landscape compared to those inhabiting the continuous native forest. In addition, since agricultural fields and the semi-natural habitats that surround them probably maintain a large diversity of predatory arthropods that move between the two habitats depending on the availability of prey, the phenology of the crop, and the techniques of tillage and field maintenance [Citation35], we predict that the diversity of predatory species will be greater in native forest windbreaks.
Materials and methods
Study area
This study was conducted in the Argentine province of Salta, General Martín Miguel de Güemes and Metán Departments (). This area is part of the Chaco Seco ecoregion, the Serrana subregion, between 600 and 1,400 metres above sea level [Citation36]. The climate is semi-arid, with average annual precipitation between 500 and 700 millimetres, except on the eastern slopes, where it reaches 1,500 millimetres in orographic rainfall regions [Citation36]. The mean annual temperature is 23 °C [Citation37], and during winter there is a large daily thermal amplitude. The Chaco Serrano forms a broad ecotone (transition zone) between the Yungas and the Monte ecoregions [Citation38], where the altitude decreases eastward, and the environment is rocky with steep slopes and strong river erosion. On a broader scale, the matrix of the Serrano foothills is a semi-deciduous high open woodland with patches of grassland; yet, as one ascends, one encounters mountain pastures [Citation36]. In the highland forests, hardwood plant species such as Schinopsis haenkeana, Aspidosperma quebracho-blanco, Prosopis alba, and P. nigra, Handroanthus chrysanthus, Ceiba chodatii, and an endemic cardon species, Trichocereus terscheskii, predominate [Citation36,Citation38]. Opuntia quimilo is a major invader in the highland grasslands, gaining the degraded systems (overgrazed grasslands or abandoned crop plots) of the Chaco Serrano with the tar Parkinsonia praecox and many species of acacias (Acacia aroma, A. caven, and A. furcatispina) [Citation36].
Figure 1. Map of the sampling area located in northwestern Argentina showing the location of the sites considered. Abbreviations N = continuous native forests and W = native forest windbreaks.
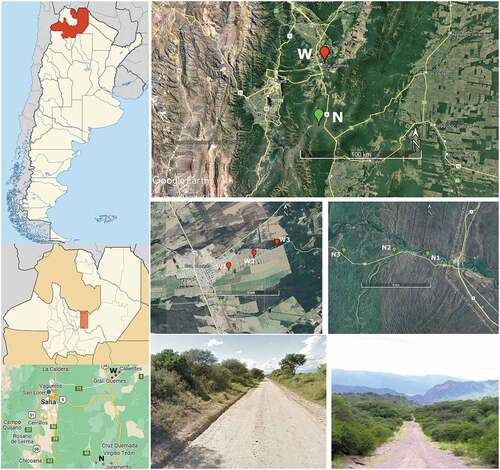
For the collection of epigeal Araneae and Coleoptera, six sampling sites were chosen (), three of which correspond to a continuous native forest (N) and the other three to native forest windbreaks (W) in the middle of a sugar cane agricultural matrix. The distance between plots N and W was 50 kilometres. To maintain the independence of the samples in each habitat, the sampling locations were more than 500 metres apart [Citation39]. Thus, 3 km separated the N sites while the W sites were separated by around 2.5 km. We selected the native forest areas as part of a continuous 1,150-ha serrano forest area in a good condition of conservation and without human intervention for over 50 years; we consider them to be natural ecosystems of the Chaco Serrano in the Juramento River Valley in the Metán Department (N1: 25° 07’ 31.44”S 65° 02’ 16.92”W, 755 m.a.s.l.; N2: 25° 07’ 22.8”S 65° 03’ 44.4”W, 813 m.a.s.l. and N3: 25° 07’ 25.2”S 65° 05’ 52.8”W, 829 m.a.s.l.). The vegetation is dominated by Schinopsis haenkeana, Trichocereus terscheckii, Aspidosperma quebracho-blanco, Ziziphus mistol, Acacia sp., and Capparis sp. Native forest windbreaks comprise a 10 km long and 30–40 m wide continuous windbreak of native serrano forest that is flanked by sugar cane crops in the El Algarrobal neighbourhood of the Gral. Martín Miguel de Güemes Department (W1: 24° 40’ 13.54”S 65° 1’ 43.74”W, 719 m.a.s.l.; W2: 24° 39’ 45.48”S 65° 0’ 40.90”W, 690 m.a.s.l. and W3: 24° 39’ 17.94”S 64° 59’ 35.94”W, 666 m.a.s.l.). Acacia visco, Tipuana tipu, Enterolobium contortisiliquum, Opuntia quimilo, Prosopis ruscifolia, and Ruprechtia trailer were the prevailing plant species.
Sampling
Sampling was performed in the spring and summer of 2006 and 2007, respectively. At each sampling site, a rectangular area of 4,500 m2 (150 x 30 metres) was delineated; at its center and along a 100 m linear transect (random start), 10 pitfall traps were positioned 10 metres apart to assure sample independence [Citation40,Citation41]. These traps were 12.5 cm in diameter, transparent plastic containers containing saline solution (sodium chloride (kg): water (lt) in a 1:8 ratio) and detergent drops as a preservative. Per sampling season, each trap was active for seven days. This interval of time permits the achievement of higher capture rates [Citation40] and would not have unintended consequences due to higher disturbance levels at the study site [Citation42]. We accessed the sampling period’s temperature and precipitation values from the Windows 10 application meteored.com.ar [Citation43].
Identification of spiders and beetles
We utilised the dichotomous keys published by Grismado et al. [Citation44] and Bentancourt et al. [Citation45] for the identification of Araneae and Coleoptera families. Following Cardoso et al. [Citation16] for spiders, Susilo et al. [Citation19] and Norfolk et al. [Citation46] for coleopterans, families were matched with guilds. In the case of the Coleoptera families Tenebrionidae and Scarabaeidae, whose species belong to multiple guilds due to their diverse feeding patterns, we analysed each species prior to assigning them to guilds. The morphospecies of Carabidae and Coccinellidae (Coleoptera) were assigned to guilds based on the dietary preferences of the majority of species within each family. We considered the original descriptions and dichotomous keys of Mello-Leitao [Citation47], Marvaldi and Lanteri [Citation48], Aguirre-Tapiero [Citation49], Aballay et al. [Citation50], Bílý [Citation51], the World Spider Catalog version 22.5 [Citation52], and Lanteri and del Río [Citation53] to identify habitat indicator species. Specimens were recognised at the genus or specific taxonomic level, and when this was not possible, they were classified into morphospecies based on distinguishable structural and morphological characteristics [Citation54]. A morphospecies is a recognised entity equivalent to a species, but not formally designated as such. They can be used to classify and describe diversity without compromising precision, keeping in mind that species richness is the most commonly used measure of diversity [Citation55]. Therefore, the term “species” will be used throughout this work to refer to both morphospecies and specimens recognised at a particular level.
Data analysis
Alpha diversity and inventory
Due to the fact that the data did not conform to normality (Bartlett test of goodness of fit and homogeneity of variances), non-parametric statistical tests were conducted.
The quality of the inventories for each habitat (N and W) was determined by the sample coverage, whose values range from 0 to 1 and are reported as a percentage. This determines the proportion of the total number of individuals in the community that belongs to the sampled species [Citation56]. We calculated the completeness of the inventories obtained for each taxon as the relationship between the observed species richness and the species richness estimated by ACE, whose value was obtained using the SPADE programme [Citation57]. We evaluated the completeness values of the inventories according to Chao et al. [Citation58] and Cardoso’s [Citation59] criteria, which provide three categories: “reasonable” (50–70 percent completeness), “complete” (70–80 percent completeness), and “exhaustive” (80 percent or more). Species richness was compared between habitats (N and W) by extrapolating the rarefaction of Hill numbers for q = 0 (species richness), q = 1 (Shannon exponential), and q = 2 (Simpson’s inverse) (see calculation formulas in Jost [Citation60]). This technique assures that samples are comparable regardless of sample size, allowing for robust statistical inferences of species richness patterns in communities [Citation56]. The calculations were performed using the programme iNEXT [Citation61] and were based on individuals with the same degree of sample coverage, confidence intervals of 95 percent, and 100 permutations.
Families, guilds and community structure
A bootstrapping method [Citation62] calculated by the PAST 3.08 programme [Citation63] was used to determine if there were statistically significant differences in the values of species abundance and species richness between habitats (N and W) and between seasons (spring and summer). We compared the richness and abundance of predatory species per habitat for both orders of arthropods using the same methodology. We used graphs of the relative abundances and species richness to compare the guilds between habitats (N versus W). According to the type of food consumed, epigeal coleopterans were categorised into seven guilds: fungivores (feed on mushrooms) (F), xylophages (feed on wood) (X), necrophagous (feed on dead animals) (N), detritivorous (feed on decaying organic materials) (D), herbivores (feed on plants) (H), predators (feed on living animals) (P), and coprophagous (feed on faeces) (C). Following Cardoso et al. [Citation16], epigeal spiders were classified into seven guilds according to the used hunting strategies: Ambush hunters (AH), Ground hunters (GH), Other hunters (OH), Orb web weavers (OWW), Specialists (S), Sheet web weavers (ShWW) and Space web weavers (SpWW). We analysed and compared the structure of Araneae and Coleoptera family assemblages in each habitat type using rank-abundance curves (N and W) [Citation64], wherein the position denotes the decreasing abundance order of the families.
Beta diversity
To assess the degree of association/similarity of the assemblages of families and their relationship with the habitats selected a priori and with the phenological seasons, a Principal Component Analysis (PCA) was conducted using PC-Ord v.7.0 [Citation65] on a variance/covariance matrix.
Beta diversity is a crucial term for quantifying biodiversity and comprehending the functioning of ecosystems [Citation66]. Changes in species composition between communities (beta diversity) can represent two underlying phenomena: turnover (βSIM) and nestedness (βSNE), which are caused by distinct mechanisms (replacement of species and species loss, respectively) [Citation67]. Due to fragmented habitats frequently generate nestedness patterns in beta diversity [Citation68], the effect of sugar cane plots on species composition was evaluated by comparing beta diversity between habitats, sampling sites, and seasons for both taxonomic groups collectively and individually, to reveal underlying patterns. Beta diversity was measured using the Sorensen dissimilarity index (βSOR), and its value was partitioned applying the Baselga additive approach [Citation67] by the Betapart package in R [Citation69]. The partition distinguishes what proportion of beta diversity is due to species turnover (βSIM) and what proportion is attributable to the nestedness of assemblages (βNES).
Importance of beta diversity on a regional scale
To analyse how the alpha and beta diversities of epigeal Araneae and Coleoptera are distributed across the Serrano forest landscape of the dry Chaco, a multiplicative partition of regional species richness (gamma diversity) was carried out using the PARTITION 3.0 programme [Citation70]. In this analysis, we took into account four hierarchical levels: γ = α1 (within the sample = microhabitat) x β1 (between samples) x β2 (between sites) x β3 (between seasons) x β4 (between habitats = native and disturbed). The observed α and β values were compared to the values predicted by a random sample distribution [Citation71]. If p = 1 or a close approximation of this number, the species are distributed randomly at the considered level, and the samples are therefore independent. If p is closer to zero, the distribution of species at that level is not random.
Indicator species of each habitat
To determine whether a species has significant preferences for a particular habitat type, an analysis of the indicator value (IndVal) was conducted. The indicator value is computed as the product of the degree of specificity (exclusive to a particular habitat) and the degree of fidelity (frequency of occurrence within the same habitat) [Citation72]. We determined the statistical significance of the indicator value obtained for each species using the Monte Carlo test with 9999 permutations using PC-Ord v.7.04 programme [Citation65]. Species with indicator value greater than 70% were considered “indicator species” following McGeoch et al. [Citation73].
Results
Alpha diversity and inventory
In the Chaco Serrano forests of Salta province, a total of 1,154 adult individuals (599 Araneae and 555 Coleoptera) belonging to 89 species of spiders (Annex ) and 111 species of coleopterans (Annex ) were recorded. Coverage of the sample reached 91% for habitats N and 88% for habitats W. There were no statistically significant differences in their values; hence, the environments are equivalent. The completeness of the Araneae inventory achieved 76% (ACE = 117 species), whereas the inventory of Coleoptera reached 55% (ACE = 203 species). Interpolation-extrapolation analysis based on individuals at the same coverage level found that habitats W supported a more diverse community ().
Figure 2. Species richness analysis by interpolation and extrapolation of continuous native forest (N) and native forest windbreak (W) assemblages by sugar cane plots in the province of Salta. Bars indicate 95% confidence intervals. Abbreviations Sobs. = observed species richness, Sexp. = estimated species richness, LCL and UCL = the bootstrap lower and upper confidence limits for the diversity of order q (with a default value of 0.95) and C. hat = the estimated sample coverage.
Families, guilds and community structure
Significantly more (p = 0.05) epigeal Araneae were observed in habitats N (N = 347) than in W (N = 252). The number of Araneae families varied between collection sites, with greater diversity in the W habitats (). Both the species richness and abundance of Araneae in habitats N differed significantly between spring and summer (p = 0.05), with summer being the most species-rich and abundant season. In habitats W, there were only significant differences in Araneae abundances between seasons (p = 0.05), with summer having the highest number of individuals.
Table 1. Abundance and richness of the families and guilds of Araneae and Coleoptera recorded in the Chaco Serrano.
The abundance of epigeal Coleoptera was substantially greater in W (p = 0.05), with a larger number of families (). We observed in N habitats a similar pattern reported in Araneae, where abundance and species richness were considerably greater in the summer (p = 0.05). In W habitats, the only significant difference in the abundance of Coleoptera was observed during the spring. During the sampling period, the average spring temperature was 20 °C, while precipitation peaked at 169 mm from October to December. In contrast, the average summer temperature was 21 °C, with 556 mm of precipitation falling between December and March.
All seven guilds of epigeal Araneae were found in both habitats (). In native forest windbreaks, the abundance of specialist spiders (S) decreased significantly, but the communities of ambush hunters (AH), orb-web weavers (OWW), and sheet web weavers (ShWW) increased significantly (). The species diversity of spider guilds of ground hunters (GH), other hunters (OH), space web weavers (SpWW), and specialists (S) increased in the same habitats ().
Figure 3. Relative abundance and richness of Araneae (a) and Coleoptera (b) guilds recorded in continuous native forest (N) and native forest windbreak (W) habitats; Abbreviations 3a: AH = Ambush hunters, GH = Ground hunters, OH = Other hunters, OWW = Orb web weavers, S = Specialists, ShWW = Sheet web weavers, SpWW = Space web weavers; Abbreviations 3b C = Coprophagous, D = Detritivorous, F = Fungivores, H = Herbivores, N = Necrophagous, P = Predators, and X = Xylophages.
We recorded six guilds of Coleoptera in native forest windbreaks (W) and seven in the N habitats (). Compared to the N habitats, the native forest windbreaks exhibited a considerable abundance of xylophages (X) and necrophagous (N) coleopterans and a marked decrease in the number of coprophagous (C) and detritivores (D) species (). In addition, the species richness of herbivores (H), xylophagous (X), and necrophagous (N) increased in the W habitats (). Fungivores (F) have only been documented in N habitats.
The abundance of predatory species (spiders and some coleopterans) was substantially greater in N (NN = 416, NW = 310, p = 0.05) compared to W. The number of predatory species was higher in native forest windbreaks (S = 86) than in continuous native forest habitats (S = 75), although the difference was not statistically significant (p = 0.2).
In terms of the composition of families and the distribution of their abundances, the epigeal Araneae communities of the two environments (N and W) were distinct (). In the native communities, three families accounted for 75.7% of the total abundance. The Zodariidae family dominated (N = 167) with 48.13 %, followed by the Lycosidae family (N = 66) with 19 % and the Salticidae family (N = 8) with 8.64 %. This usual pattern of N habitats in the dry Chaco Serrano was distinct from W habitats, where Lycosidae constituted 32%, followed by Linyphiidae (12%), and Theridiosomathidae (11%) ().
Figure 4. Range / abundance curves of families Araneae (a) and Coleoptera (b) collected in continuous native forest (N) and native forest windbreak (W) habitats in northwestern Argentina.
The composition and dominance of families in the epigeal communities of the studied Coleoptera differed between habitats, as shown in . Chrysomelidae represented 21% of the total abundance in the N habitats, followed by Tenebrionidae (13%), Buprestidae (11%), and Geotrupidae (11%). In contrast, Nitidulidae dominated W habitats with 21% of the total abundance, followed by Buprestidae with 18% and Dermestidae with 13%; the latter family was only found in native forest windbreaks.
Beta diversity
The PCA for Araneae displayed a pattern of the ordering of the sites impacted mostly by the differences between the N and W habitats (), with the first two axes (p = 0.05) explaining 42% of the total variation (27% and 15%, respectively). The first axis organised all native communities along a short gradient involving the seasons (spring to summer). Both Araneidae and Zodariidae were abundant throughout both seasons. Other families were particularly numerous during the summer (Salticidae, Micropholcommatidae, Pholcidae and Clubionidae). The second axis could better explain the divergence of communities within the W habitats, where the effect of seasonality was notably evident. On these sites, the abundance varied dramatically from season to season. Thus, Miturgidae, Anyphaenidae, Pisauridae, Thomisidae, and Mimetidae prevailed in the spring, and in the summer, typical weaver spiders dominated the W communities, including Theridiosomathidae, Tetragnathidae, and Hahniidae, as well as Linyphiidae, Amphinectidae, and Trachelidae; the latter families were present only in the W habitats.
Figure 5. Ordination obtained by PCA of the assemblages of families and guilds of Araneae (a) and Coleoptera (b) in relation to the habitats selected a priori (N and W) and with the phenological seasons (Spring= Spr and Summer=Sum).
For the Coleoptera, the PCA produced a distinct ordering pattern, which is mostly driven by the seasonality of the Chaco, with the first two axes (p = 0.05) explaining 46% of the total variation (30% and 16%, respectively) (). On the first axis, the N and W communities were organised with similar assemblages during the spring; the most abundant families were Hybosoridae, Glaresidae, and Buprestidae, which are characteristic of N habitats. Dermestidae, together with Melyridae, were typical of W habitats. On the second axis, two distinct groups were distinguished: the summer N communities, represented by Lyctidae, Corylophydae, and Scarabaeidae; but also Cleridae, Histeridae, Chrysomelidae, Geotrupidae, Tenebrionidae, and Carabidae. The summer W communities were negatively associated with the second axis, with Meloidae, Pselaphidae, Cicindelidae, and Anobiidae, typical of this habitat, as well as Nitidulidae, Elateridae, and Curculionidae, composing the assemblages.
All comparisons showed moderate to high beta diversity levels (βSOR values between 0.5 and 0.9) (). The spatial pattern identified in the partition of beta diversity (βSOR), in its two components (species turnover and nestedness), was the same regardless of whether Araneae or Coleoptera were considered separately or together. Species turnover (βSIM) was the primary factor determining variations between N and W habitats (). When partitioning the beta diversity within each habitat, we found that the turnover of species influenced the pattern of these arthropods in the Chaco Serrano’s pristine environments, whereas nestedness was higher in the assemblages of W habitats (βSNE). When comparing the beta diversity patterns of Araneae and Coleoptera separately, Araneae showed a higher species loss (βSNE).
Table 2. Values of beta diversity (βSOR) and their components of turnover (βSIM) and nestedness (βNES) for Araneae and Coleoptera comparing between habitats, between sites and between seasons (spring and summer).
When analyzed the whole phenological pattern of beta diversity, the differences between the composition of the assemblages of species recorded in habitats N and W were likewise related to the species turnover (69.3 and 95.9%, respectively), whereas nestedness was very high in habitats N (30.7%) ().
When analysed independently, Araneae and Coleoptera exhibited the same pattern; however, in N habitats, the loss of Araneae species was approximately double (40.7%) that of Coleoptera species.
Importance of beta diversity on a regional scale
For both Araneae and Coleoptera, the multiplicative partition of gamma diversity into its two components (alpha and beta) followed the same pattern. Thus, at the sample level, the alpha and beta diversities did not differ significantly from what would be predicted by chance (p = 1); hence, the samples are independent. In contrast, the beta diversity between sites within the same habitat, between seasons, and between habitats was much higher than predicted by chance. Consequently, the spatial heterogeneity present at these three levels of analysis influenced the composition of the Araneae and Coleoptera assemblages. At the regional level, alpha diversity contributed just 26% to Araneae and 23% to Coleoptera, whereas beta diversity contributed more to gamma diversity at each hierarchical level analysed. Thus, for Araneae, beta diversity between samples contributed 33%, between sites 17%, and 12% for both seasons and habitats; for Coleoptera, the respective values were 35%, 18%, 12%, and 12%.
Indicator species for each habitat
Eight species of Coleoptera and one species of Araneae were identified as having a strong relationship with one of the two environments evaluated and so having the potential to be utilized as indicators. In Araneae communities of N habitats, Leprolochus birabeni Mello-Leitao, 1942 (Zodariidae) (89%, p = 0.003) recorded abundance peaks in the spring, whereas the Coleoptera Euspilotus (Hesperosaprinus) strobeli Steinheil, 1880 (Histeridae) (74.7%, p = 0.01) during the summer.
In the W habitats, six species of coleopterans performed as indicators: Heilus tuberculosus Perty, 1832 (Curculionidae) (100%, p = 0.01); Systena sp. 2 (Chrysomelidae) (100%, p = 0.01); Conoderus sp. (Elateridae) (100%, p = 0.01); Paederinae sp. (Staphylinidae) (86.5%, p = 0.02); Systena sp. 1 (Chrysomelidae) (74.9%, p = 0.03); and Pantomorus setulosus Hustache, 1923 (Curculionidae) (73.9%, p = 0.03). Tetragonoschema undatum Steinheil, 1874 (Buprestidae), was abundant in all habitats during spring (97.1%, p = 0.0006), however, it was most abundant at W1.
Discussion
Alpha diversity and inventory
This is the first study to explore how epigeal Araneae and Coleoptera in the Chaco Serrano forest respond to changes in habitat structure caused by sugar cane crops. The Araneae and Coleoptera species richness observed here is greater than in Chaco Serrano of Córdoba province (Argentina) [Citation74] and other ecoregions of Salta province such as Monte de Sierras y Bolsones and Puna [Citation33,Citation75]. Also, the species richness outnumbers the Araneae richness of families recorded by Rubio [Citation31] and Cruz et al. [Citation33] for Salta’s Chaco Serrano forests. Obtaining thorough animal inventories is typically challenging [Citation76], especially when working with hyper-diverse groups [Citation77] such as Araneae and Coleoptera. However, according to Chao et al. [Citation58], the inventories obtained for both groups were adequate. According to Cardoso [Citation59], the inventory for Araneae is “complete,” while the inventory for Coleoptera is “reasonable”. This allows us to believe that the collecting data protocol is efficient, allowing us to make meaningful judgments regarding alpha diversity in each community.
Families, guilds and community structure
The fragmentation of habitat has a significant impact on biodiversity, species composition, and ecosystem function [Citation78,Citation79]. These arguments are supported by our findings. When compared to continuous native forest habitats (N), native forest windbreaks (W) demonstrate changes in alpha and beta diversity patterns, as well as in the abundance and composition of Araneae and Coleoptera families and guilds. Epigeal coleopteran abundance and species richness rise in W habitats, as does epigeal Araneae species richness; but the abundance of the latter is greatly reduced. In N communities, both the abundance and species richness of the two taxonomic groups increase throughout the summer, whereas in W, only the abundance of spiders and coleopterans altered significantly across seasons: Araneae rose in the summer, while Coleoptera did so in the spring.
The reproductive season and the emergence of offspring coincide with the summer peak of the abundance of Araneae in the Chaco Serrano. These stages are related to the rapid growth of vegetation during the wet season. As a result, the spiders manage to occupy the new micro-habitats as refugee sites or to seek prey [Citation80], which is also related to the phenology and dynamics of arthropods in crops and surrounding habitats. In the case of Coleoptera, the increase in species richness and abundance found during the summer in continuous native forests coincides with months of more copious rain and elevated monthly average temperature, both of which influence their diversity [Citation81]. Crop irrigation, particularly during dry seasons (such as spring 2006), may have favoured the humid conditions of the native forest windbreaks. The last point could explain the increase in Coleoptera abundance in W during the spring.
Both collection sites’ Araneae guilds exhibit changes in abundance, richness, and composition. Thus, 90% of Araneae in N habitats belong to the specialist guild (48%), ground hunters (28%), and other hunters (14%). The increased concentration of the specialist spider guild is linked to Leprolochus birabeni (Zodariidae) which is an indicator spider of the Chaco environment with high abundance values [Citation32,Citation33]. Specimens of this species have also been identified in two other dry Argentine ecoregions, the Espinal [Citation82] and the Monte [Citation83], but no study corroborates that it also works as an indicator taxon in these ecoregions. In this study, which coincided with that of Torres et al. [Citation32], agricultural disturbance reduced the abundance of this species and resulted in its extinction in native forest windbreaks. This species’ extremely specialised food could explain this effect, which has been linked to the extinction of the species in anthropically modified landscapes [Citation84]. Leprolochus birabeni only preys on ants [Citation85], a rich resource in the Chaco’s natural forests, but less so in forest remnants surrounded by monocultures [Citation86]. Potentially, the local extinction of L. birabeni in native forest windbreaks could be attributed to its susceptibility to crop-applied pesticides [Citation32].
Our findings suggest that ground hunter spiders (43%) exceed orb weavers and ambush hunter spiders in native forest windbreaks. Authors such as Buddle et al. [Citation87], Gurdebeke et al. [Citation88], and Magura et al. [Citation89] have reported that generalist spider species invade degraded forest patches from the surrounding matrix. The great majority of hunting spiders are generalists [Citation90], and their species are pioneers, invading and dominating highly damaged agricultural landscapes [Citation89,Citation91]. This would explain the increased species diversity and abundance of the ground hunter and ambush hunter spiders in the Chaco Serrano native forest windbreaks in an agricultural matrix with sugar cane crops. Web-building spiders, on the other hand, are often habitat specialists [Citation92,Citation93] and represent a sizable portion of the crop spider community [Citation94]. Sugar cane, corn, sorghum, and cotton have a higher proportion of orb-weavers and ambush hunters [Citation27]. This would also add credibility to the finding of a rise in the abundance and diversity of weaver spiders in W habitats.
Our observations for Coleoptera reveal that six of the seven guilds are shared between N and W environments, albeit with differences in abundance, richness, and assemblage composition. Herbivores and predators are the most diverse and abundant guilds in both environments; nevertheless, the first guild increased its abundance and species richness in W habitats. In the aforementioned environment, the coprophagous and detritivores Coleoptera guilds fall significantly, whilst the necrophagous and xylophages guilds increase. The fungivores guild, represented by a single Corylophydae species, is only found in the N habitats. The guild species richness changed between N and W, indicating an increase in herbivores, xylophages, and necrophagous in W.
One possible explanation for these observations is that sugar cane plots alter the trophic structure of native Coleoptera communities. Monocultures restrict food supply for multiple species while allowing overexploitation by a few herbivore species [Citation19]. Predatory insects dominate the entomofauna linked with sugar cane in other nations, according to Atencio et al. [Citation95] and Castro Herrera et al. [Citation28]. Although predatory beetles were more diverse and abundant in N (S = 25, N = 69) in our study, they were also well represented in W (S = 24, N = 58).
The detrimental consequences of agriculture and its tillage techniques have resulted in a significant drop in the abundance and species richness of coprophagous and detritivore Coleoptera species in native forest windbreaks. These actions damage micro-niches and available feeding places [Citation19]. Geotrupidae and Scarabaeidae are among the families most affected by this because they are epigeal build nests by digging tunnels in the soil under the faeces or in its proximity [Citation96,Citation97], and are sensitive to environmental changes caused by habitat fragmentation [Citation98,Citation99]. This conclusion is critical to note since these associations could perform valuable ecological functions to balance agroecosystems [Citation98] due to the transformation of organic matter into mineral elements that promote soil fertility [Citation98,Citation100]. Gardner et al. [Citation101] and Molina et al. [Citation102] underlined the importance of detritivore insects as macro-decomposers in arid and semi-arid environments, where other decomposing agents have restricted action because of unfavourable climatic conditions.
Conserving semi-natural environments around crops promotes pest natural enemies (predators and parasitoids) and increases biocontrol services in crops worldwide [Citation35]. Semi-natural vegetation, which provides alternative resources for natural enemies of pests (such as food, hibernation/wintering places, and shelter), might influence biocontrol within crops [Citation103]. In particular, woody vegetation in optimal conditions (no grazing, middle stratum and undergrowth, and good ground cover) supports a wide range of natural enemies that go to crops in search of prey and then return to semi-natural habitats when crop conditions deteriorate [Citation35]. This could explain the observed increase in the richness of predatory species (Araneae and certain Coleoptera) in the Chaco Serrano’s native forest windbreaks.
Araneae from the families Zodariidae, Lycosidae, and Salticidae dominate the Chaco Serrano’s continuous native forest environments. Spider abundance changes in native forest windbreaks, with an increase in the number of Lycosidae, Linyphiidae, and Theridiosomathidae. Zodariidae is often dominant in the Chaco Serrano, Monte, and Espinal environments [Citation32,Citation33,Citation82,Citation83], with high specificity to the Chaco Serrano habitats in Salta province [Citation32,Citation33]. Salticidae is extremely dependent on habitat type [Citation31] and the structural complexity of its plants [Citation104]. Lycosidae, on the other hand, are numerous in both the studied habitats and the Chaco Humedo forests [Citation105]. Because they are a generalist spider family, they have increased in number in anthropized habitats [Citation106]. These species are active hunters on the ground, and in disturbed habitats, they can swiftly exploit unoccupied niches in search of food [Citation107].
Agrobiont spiders like Lycosidae and Linyphiidae are abundant in the Chaco Serrano’s native forest windbreaks. The last family is one of the best adapted to disturbed ecosystems [Citation108,Citation109]. These spiders are abundant in crops during the summer [Citation110]. Sugar cane harvests in Louisiana (USA) [Citation111], India [Citation112,Citation113], Pakistan [Citation114], and South Africa [Citation115] have a great abundance of both families. This would imply that the rise in the abundance of both spider families in the W habitats could be due to a contribution from the araneofauna of the neighbouring sugar cane plots.
We captured two Coleoptera families that are not considered ground-active, such as Chrysomelidae and Buprestidae, in both environments (N and W). This somewhat correlates with the findings of Flores et al. [Citation83], who studied epigeal arthropods in the Monte dry forest by capturing seven species of Buprestidae using the same sampling technique. Only two Buprestidae species were found in our study, Tetragonoschema undatun and Buprestidae sp. 1, being the first more abundant in both environments. This buprestid species is related to the genus Trichocereus and Opuntia (Cactaceae) [Citation116,Citation117], both of which are part of the usual vegetation of the collection sites.
Chrysomelidae and Tenebrionidae dominated the structure of the Chaco Serrano’s natural forest; in W habitats, these families are replaced by Nitidulidae and Buprestidae (). Grez [Citation118] found results comparable to ours in Chile because Chrysomelidae predominated in continuous forest habitats against remnant fragments in an agricultural matrix. This family has also been reported as one of the most diverse, although not particularly abundant, in Panama’s sugar cane crops [Citation28]. Tenebrionidae are found in dry and semi-arid habitats [Citation119], as well as in the forests of Argentina’s western Chaco [Citation105]. They are important in the fragmentation of plant and animal resources [Citation120,Citation121], nutrient cycling, and trophic networks as components of other eating species’ diets [Citation119]. Tenebrionidae species collected are herbivorous [Citation120], necrophagous [Citation121], and detritivorous [Citation119]. Tenebrionidae family accounts for 65% of detritivorous species in N habitats but disappears in W habitats. Trichoton rotundatum (Curtis, 1845) (Tenebrionidae) and Psectrascelis ursina (Burmeister, 1875) (Tenebrionidae) dominate the Chaco Serrano’s native forest, but show local extinction in W habitats, reducing family abundance by 80%. The significant abundance of the buprestid Tetragonoschema undatum in W habitats could be attributed to the increased availability of food, because this species has been observed feeding on pollen from various Opuntia species in the humid Chaco [Citation117]. Opuntia quimilo is typical of agriculturally degraded environments in the Chaco Serrano [Citation36].
Beta diversity
The beta diversity values in all comparisons are moderate or high (βSOR values between 0.5 and 0.9), and species turnover is the main component (). However, the nestedness component of beta diversity increases in W habitats, particularly between W1 and W2, for both Araneae and Coleoptera. Species turnover indicates environmental sorting or dispersal processes [Citation122], whereas nestedness across sites occurs because of changes in species richness [Citation67] and represents an orderly loss of Araneae and Coleoptera species in W sites. This species loss happens due to a higher number of local extinctions of species in W habitats due to reduced production, historical reasons, and harsh environmental conditions [Citation67]. Because landscapes are mosaics of patches of varying sizes and degrees of isolation, habitat fragmentation causes ordered species’ extinction events [Citation68,Citation123]. That could have happened to Leprolochus birabeni (Zodariidae), Trichoton rotundatum (Tenebrionidae), Psectrascelis ursina (Tenebrionidae), and other species that went extinct locally in W habitats.
Indicator species of each habitat
It is vital to remember that L. birabeni (Zodariidae) is a specialist spider, whereas E. (Hesperosaprinus) strobeli (Histeridae) is a predator beetle that prefers the Chaco Serrano’s continuous natural forest habitats. Rather, P. setulosus (Curculionidae), H. tuberculosus (Curculionidae), Systena sp.1, Systena sp.2 (Chrysomelidae), Paederinae sp. (Staphylinidae), Conoderus sp. (Elateridae), and T. undatum (Buprestidae) are associated with native forest windbreak habitats.
Torres et al. [Citation32] and Cruz et al. [Citation33] previously documented a strong association between L. birabeni (Zodariidae) and the natural habitats of the Chaco Serrano and advocated this species as a viable future environmental monitor for this ecoregion. This claim is based on the negative species behaviour to anthropic disturbances, such as the cattle ranch documented by Torres et al. [Citation32] and, in this case, the agricultural landscape.
Importance of beta diversity on a regional scale
Finally, our findings support the notion advanced by Gobbi and Fontaneto [Citation124] and Magura et al. [Citation89] that species richness alone is insufficient to determine the effect of human impact on biodiversity. To acquire a more realistic view of the situation, it is essential to consider the responses of different functional groups [Citation90] in the analysis. In the instance of the windbreaks of the Chaco Serrano native forest surrounded by a sugar cane agricultural matrix, the increase in Araneae and Coleoptera diversity is related to the incorporation of agrobiont species, resulting in local extinctions of native and typical species of that ecoregion. The pattern of increased nestedness in their communities could have resulted from the agricultural frontier’s expansion over the original woodlands. As species similarity increases across space, this will result in progressive and future biotic homogenisation [Citation125] in these habitats. As a result of colonisation by generalist agrobiont species, biotic homogenisation increases the loss of native species [Citation126,Citation127], contributing to changes in habitat quality and the distribution of species abundance [Citation128].
Acknowledgments
We would like to thank Victor Torres, Mariana Chani-Posse, Analía Lanteri, Gerardo Arriagada, and Federico Agrain for their assistance in identifying the species that were habitat indicators. HBM and AXG-R are grateful for the financial support of the CIN (Argentina’s National Inter-University Council), as this work was completed as part of a “Scholarship Stimulus to Scientific Vocations.” We also thank CONICET (Argentina) for its ongoing assistance.
Disclosure statement
No potential conflict of interest was reported by the author(s).
Additional information
Funding
References
- Mónaco CG. El avance de la frontera agrícola y su impacto: 9 de Julio, Chaco 1990-2010. Rev Depto Cs Soc. 2016;3(1):117–138.
- Tscharntke T, Clough Y, Wanger TC, et al. Global food security, biodiversity conservation and the future of agricultural intensification. Biol Conserv. 2012;151(1):53–59.
- Morello J, Matteucci, SD, et al. Biodiversidad y fragmentación en los bosques en la Argentina. In: Matteucci SD, Solbrig OT, Morello J, Halffter, Geditors. Biodiversidad y uso de la Tierra. Conceptos y ejemplos de Latinoamérica. Buenos Aires: Eudeba; 1999. p. 463–498.
- Gasparri NI, Grau HR. Deforestation and fragmentation of Chaco dry forest in NW Argentina (1972-2007). For Ecol Manage. 2009;258(6):913–921.
- Zak MR, Cabido M, Hodgson JG. Do subtropical seasonal forest in the Gran Chaco, Argentina, have a future? Biol Conserv. 2004;120(4):589–598.
- Torrella SA, Adámoli J, et al. Situación Ambiental de la Ecorregión del Chaco Seco. In: Brown A, Martínez Ortiz U, Acerbi M, Corcuera, J editors. La Situación Ambiental Argentina 2005. Fundación Vida Silvestre Argentina: Buenos Aires; 2005. p. 75–82.
- Dinerstein E, Olson D, Graham D, et al. Una evaluación del estado de conservación de las ecorregiones terrestres de América Latina y el Caribe. Washington DC: IUCN and World Bank; 2015.
- Bertonatti C, Corcuera J. Situación Ambiental Argentina 2000. Buenos Aires: Fundación Vida Silvestre; 2000.
- Ginzburg GR, Torrella SA, Adámoli JM. Las cortinas forestales de bosque nativo, ¿son eficaces para mitigar los efectos de la expansión agrícola? Rev Asoc Argent Ecol Paisajes. 2012;3:34–42.
- INTA. Primer relevamiento del cultivo de caña de azúcar de la República Argentina a partir de imágenes satelitales para la campaña 2018. Buenos Aires: INTA; 2018.
- Bommarco R, Kleijn D, Potts SG. Ecological intensification: harnessing ecosystem services for food security. Trends Ecol Evol. 2013;28(4):230–238.
- Fahrig L. Effects of habitat fragmentation on biodiversity. Annu Rev Ecol Evol Syst. 2003;34(1):487–515.
- Watling JI, Orrock JL. Measuring edge contrast using biotic criteria helps define edge effects on the density of an invasive plant. Landsc Ecol. 2010;25(1):69–78.
- Kuussaari M, Bommarco R, Heikkinen RK, et al. Extinction debt: a challenge for biodiversity conservation. Trends Ecol Evol. 2009;24(10):564–571.
- Banks SC, Cary GJ, Smith LA, et al. How does ecological disturbance influence genetic diversity? Trends Ecol Evol. 2013;28(11):670–679.
- Cardoso P, Pekár S, Jocqué R, et al. Global patterns of guild composition and functional diversity of spiders. PLoS ONE. 2011;6(6):e21710.
- Blondel J. Guilds or functional groups: does it matter? Oikos. 2003;100(2):223–231.
- Pearce JL, Venier LA. The use of ground beetles (Coleoptera: carabidae) and spiders (Araneae) as bioindicators of sustainable forest management: a review. Ecol Indic. 2006;6(4):780–793.
- Susilo FX, Indriyati I, Hardiwinoto S. Diversity and Abundance of Beetle (Coleoptera) functional groups in a range of land use system in Jambi, Sumatra. Biodiversitas. 2009;10(4):195–200.
- Theron KJ, Gaigher R, Pryke JS, et al. High quality remnant patches in a complex agricultural landscape sustain high spider diversity. Biol Conserv. 2020;243:108480.
- Gerlach J, Samways MJ, Pryke JS. Terrestrial invertebrates as bioindicators: an overview of available taxonomic groups. J Insect Conserv. 2013;17(4):831–850.
- Toti DS, Coyle FA, Miller JA. A structured inventory of Appalachian grass bald and heath bald spider assemblages and a test of species richness estimator performance. Journal of Arachnology. 2000;28(3):329–345.
- Lawrence JF, Newton AF Jr. Families and subfamilies of Coleoptera (with selected genera, notes, references and data on family-group names). In: Pakaluk J, Silpinski SA, editors. Biology, phylogeny, and classification of Coleoptera: papers celebrating the 80th birthday of Roy A. Crowson. Warsaw-Poland: Museum i Instytut Zoologii PAN; 1995: 779–1006.
- Alonso-Zarazaga MA, Coleoptera O. Revista IDE@-SEA. 2015;55:1–18.
- Abdel-Dayem MS, Orabi GM, Semida FM. Assessing the potential role of beetles as bioindicators in south Sinai, Egypt. Proc 2nd Internal Confer Entomol Soc Egypt. 2007;1:147e216.
- Aldhafer HM, Abdel-Dayem MS, Aldryhim YN, et al. Diversity and composition of ground-dwelling beetle assemblages (Insecta: coleoptera) in Rawdhat Khorim National Park, Kingdom of Saudi Arabia. J Arid Environ. 2016;127:187–191.
- Uetz GW, Halaj J, Cady AB. Guild structure of spiders in major crops. J Arachnol. 1999;27(1):270–280.
- Castro Herrera R, Chirinos DT, Vega A, García Ortega, Y Entomofauna asociada al cultivo de caña de azúcar en Vainillo, Ecuador, et al. El Misionero del Agro, Universidad Agraria del Ecuador. 2016; 13(3): 23–34.
- Pérez Ml de P, Isas MG, Salvatore AR, et al. Acrotomopus atropunctellus (Coleoptera: curculionidae) preference for large sugarcane shoots mitigates damage to sugarcane crop. Fla Entomol. 2017;100(3):678–679.
- Olivo VI, Corronca JA, González-Reyes AX. Dinámica de la comunidad de artrópodos asociada a cultivos de frutilla con plantas de diferentes edades en el noroeste de la Argentina. Agriscientia. 2015;32(1):29–39.
- Rubio GD. Diversidad de arañas (Araneae, Araneomorphae) en la selva de montaña: un caso de estudio en las Yungas argentinas. Graellsia. 2015;71(2):e029.
- Torres VM, González-Reyes AX, Rodriguez-Artigas SM, et al. Efectos del disturbio antrópico sobre las poblaciones de Leprolochus birabeni (Araneae, Zodariidae) en el Chaco Seco del noroeste de Argentina. Iheringia Ser Zool. 2016;106:e2016009.
- Cruz IG, Torres VM, González-Reyes AX, et al. Eficiencia de trampas de caída y suficiencia taxonómica en comunidades de arañas (Araneae) epigeas en tres ecorregiones del noroeste argentino. Rev Biol Trop. 2017;66(1):204–217. https://www.redalyc.org/articulo.oa?id=44955366016.
- Di Iorio OR. Plantas hospedadoras y biogeografía de Cerambycidae (Coleoptera) del noroeste y centro de la Argentina. Rev Biol Trop. 1996;44(3)(45(1)):149–158.
- Gagic V, Paull C, Schellhorn NA. Ecosystem service of biological pest control in Australia: the role of non-crop habitats within landscapes. Austral Entomol. 2018;57(2):194–206.
- Morello J, Matteucci SD, Rodríguez AF, et al. Ecorregiones y complejos ecosistémicos argentinos, 1ed. Buenos Aires: Argentina: Buenos Aires: Orientación Gráfica Editora; 2012.
- Chébez JC. Guía de las reservas naturales de la Argentina. Noroeste. Buenos Aires: Albatros; 2005.
- Naumann M. Atlas del Gran Chaco Sudamericano. In: Sociedad Alemana de Cooperación Técnica (GTZ). Buenos Aires: ErreGé & Asoc. 2006: 92.
- Koenig WD. Spatial autocorrelation of ecological phenomena. Trends Ecol Evol. 1999;14(1):22–26.
- Hohbein RR, Conway CJ. Pitfall Traps: a review of methods for estimating arthropod abundance. Wildl Soc Bull. 2018;42(4):597–606.
- Brown GR, Matthews IM. A review of extensive variation in the design of pitfall traps and a proposal for a standard pitfall trap design for monitoring ground-active arthropod biodiversity. Ecol Evol. 2016;6(12):3953–3964.
- Schirmel J, Lenze S, Katzmann D, et al. Capture efficiency of pitfall traps is highly affected by sampling interval. Entomol Exp Appl. 2010;2010(136):206–210.
- Meteored.com.ar. [Accessed 20 Jun 2020]. Available from: https://www.meteored.com.ar/
- Grismado CJ, Ramírez MJ, Izquierdo MA. Araneae: taxonomía, diversidad y clave de identificación de familias de la Argentina. In: Roig-Juñent S, Claps LE, Morrone JJ, editors. Biodiversidad de Artrópodos Argentinos Vol. 3. San Miguel de Tucumán- Tucumán (Argentina): Editorial INSUE-Universidad Nacional de Tucumán; 2014: 55–93.
- Bentancourt CM, Scatoni IB, Morelli E. . In: Insectos del Uruguay. Montevideo-Uruguay: UdelaR. Facultad de Agronomía- Facultad de Ciencias, 2009: 658.
- Norfolk O, Abdel-Dayem MS, Gilbert F. Rainwater harvesting and arthropod biodiversity within an arid agro-ecosystem. Agri Ecosyst Environ. 2012;2012(162):8–14.
- Mello-Leitão CF. Arañas del Chaco y Santiago del Estero. Rev Mus La Plata NS Zool. 1942;2:381–426.
- Marvaldi AE, Lanteri AA. Key to higher taxa of South American weevils based on adult characters (Coleoptera, Curculionoidea). Rev Chil Hist Nat. 2005;78(1):65–87.
- Aguirre-Tapiero MP. Clave de identificación de géneros conocidos y esperados de Elateridae Leach (Coleoptera: elateroidea) en Colombia. B Mus Entomol Univ Del Valle. 2009;10(2):25–35.
- Aballay F, Arriagada G, Flores G, et al. An illustrated key to and diagnoses of the species of Histeridae (Coleoptera) associated with decaying carcasses in Argentina. ZooKeys. 2013;61:61–84.
- Bílý S. A study on the Neotropical Anthaxiini (Coleoptera, Buprestidae, Buprestinae). ZooKeys. 2013;304:17–47.
- World Spider Catalog. 2021. World Spider Catalog. Version 22.5. Natural History Museum Bern, [2021 Jul 20]. Available from: http://wsc.nmbe.ch
- Lanteri AA, Del Río MG Naupactini (Coleoptera: curculionidae) species from Argentina and Uruguay. [September 2021]. Available from: https://biodar.unlp.edu.ar/naupactini/
- Krell FT. Parataxonomy vs. taxonomy in biodiversity studies-pitfalls and applicability of ‘morphospecies’ sorting. Biodiversity and Conservation. 2004;13(4):795–812.
- Samways MJ, McGeoch MA, New TR. Insects conservation: a handbook of approaches and methods. Techniques in Ecology and Conservation Series. New York: Oxford University Press Inc.; 2010.
- Chao A, Jost L. Coverage-based rarefaction and extrapolation: standardizing samples by completeness rather than size. Ecology. 2012;93(12):2533–2547.
- Chao A, Shen TJ Program SPADE (Species Prediction and Diversity Estimation). 2010. [Cited 2020 Jul 1]. Available from: http://chao.stat.nthu.edu.tw
- Chao A, Colwell RK, Lin CW, et al. Sufficient sampling for asymptotic minimum species richness estimators. Ecology. 2009;90(4):1125–1133.
- Cardoso P. Standardization and optimization of arthropod inventories: the case of Iberian spiders. Biodivers Conserv. 2009;18(14):3949–3962.
- Jost L. Entropy and diversity. Oikos. 2006;113(2):363–375.
- Hsieh TC, Ma KH, Chao A iNEXT online: interpolation and extrapolation. 2013. Available form: https://chao.shinyapps.io/iNEXTOnline/
- Krebs CJ. Ecological methodology. New York: Harper & Row; 1999.
- Ø H, Harper DAT, Ryan PD Past: paleontological statistics software package for education and data analysis. 2001. [accessed 2020 Mar 22]. Available from: http://folk.uio.no/ohammer/past
- Magurran AE. Measuring biological diversity. Oxford: Blackwell Publishing; 2004.
- McCune B, Mefford MJPC-ORD. Multivariate analysis of ecological data, versión 7.04. Gleneden Beach: MjM Software Design; 2016.
- Calderón-Patrón JM, Moreno CE, Zuria I. La diversidad beta: medio siglo de avances. Rev Mex Biodivers. 2012;83:879–891.
- Baselga A. Partitioning the turnover and nestedness components of beta diversity. Glob Ecol Biogeogr. 2010;19(1):134–143.
- Ulrich W, Almeida-Neto M, Gotelli NJ. A consumer’s guide to nestedness analysis. Oikos. 2009;118(1):3–17.
- Baselga A, Orme CDL, Villéger S, et al. Betapart: partitioning beta diversity into turnover and nestedness components. R package version 1.3. 2013. Available from: http://CRAN.R-project.org/package=betapart
- Veech JA, Crist TO PARTITION: software for hierarchical partitioning of species diversity. 2009. Available from: http://www.users.muogio.edu/cristto/partition.htm.
- Crist TO, Veech JA, Gering JC, et al. Partitioning species Diversity across landscape and regions: a hierarchical analysis of α, β and γ diversity. Am Nat. 2003;162(2):734–743.
- Dufrêne M, Legendre P. Species assemblages and indicator species: the need for a flexible asymmetrical approach. Ecol Monogr. 1997;67:345–366.
- McGeoch MA, Van Rensburg BJ, Botes A. The verification and application of bioindicators: a case study of duna beetles in a savanna ecosystem. J Appl Ecol. 2002;39(4):661–672.
- González E, Salvo A, Valladares G. Sharing enemies: evidence of forest contribution to natural enemy communities in crops, at different spatial scales. Insect Conserv Diver. 2015;8(4):229–236.
- Gónzalez-Reyes AX, Corronca JA, Arroyo NC. Differences in alpha and beta diversities of epigeous arthropod assemblages in two ecoregions of Northwestern Argentina. Zool Stud. 2012;51(8):1367–1379.
- Adler PB, Lauenroth WK. The power of time: spatiotemporal scaling of species diversity. Ecol Lett. 2003;6(8):749–756.
- Jiménez-Valverde A, Hortal J. Las curvas de acumulación de especies y la necesidad de evaluar la calidad de los inventarios biológicos. SEA, Rev Iberica Aracnol. 2003;8:151–161.
- Altieri MA. The ecological role of biodiversity in agroecosystems. Agr Ecosyst Environ. 1999;74(1–3):19–3l.
- Hooper DU, Chapin FS, Ewel JJ, et al. Effects of biodiversity on ecosystem functioning: consensus of current knowledge. Ecol Monogr. 2005;75(1):3–35.
- Armendano A, González A. Spider fauna associated with wheat crops and adjacent habitats in Buenos Aires, Argentina. Rev Mex Biodivers. 2011;82:1176–1182.
- Medina-Reyes G, Jiménez-Sánchez E, Zaragoza-Caballero S. Diversidad estacional y vertical de coleópteros en la sierra de Guadalupe. Entomol Mex. 2019;6:373–378.
- Pompozzi GA, Tizón FR, Pelaéz DV. Effects of different frequencies of fire on an epigeal spider community in Southern Caldenal, Argentina. Zool Stud. 2011;50(6):718–724.
- Flores GE, Lagos SJ, Roig-Juñent S. Artrópodos epigeos que viven bajo la copa del algarrobo (Prosopis flexuosa) en la reserva Telteca (Mendoza, Argentina). Multequina. 2004;13:71–90.
- Kotiaho JS, Kaitala V, Komonen A, et al. Predicting the risk of extinction from shared ecological characteristics. Proc Natl Acad Sci U S A. 2005;102(6):1963–1967.
- Jocqué R. An updating of the genus Leprolochus (Araneae: zodariidae). Stud Neotrop Fauna E. 1988;23(2):77–87.
- Pereyra M, Pol RG, Galetto L. Ant community patterns in highly fragmented Chaco forests of central Argentina. Austral Ecol. 2019;44(4):668–679.
- Buddle CM, Spence JR, Langor DW. Succession of boreal forest spider assemblages following wildfire and harvesting. Ecography. 2000;23(4):424–436.
- Gurdebeke S, De Bakker D, Vanlanduyt N, et al. Plans for a large regional forest in eastern Flanders (Belgium): assessment of spider diversity and community structure in the current forest remnants. Biodivers Conserv. 2003;12(9):1883–1900.
- Magura T, Horváth R, Tóthmérész B. Effects of urbanization on ground-dwelling spiders in forest patches, in Hungary. Landscape Ecol. 2010;25(4):621–629.
- Duan M, Hu W, Liu Y, et al. The influence of landscape alterations on changes in ground beetle (Carabidae) and spider (Araneae) functional groups between 1995 and 2013 in an urban fringe of China. Sci Total Environ. 2019;689:516–525.
- Borchard F, Buchholz S, Helbing F, et al. Carabid beetles and spiders as bioindicators for the evaluation of montane heathland restoration on former spruce forests. Biol Conserv. 2014;178:185–192.
- Pearce J, Venier L, Eccles G, et al. Influence of habitat and microhabitat on epigeal spider (Araneae) assemblages in four stand types. Biodivers Conserv. 2004;13(7):1305–1334.
- Entling MH, Stämpffi K, Ovaskainen O. Increased propensity for aerial dispersal in disturbed habitats due to intraspecific variation and species turnover. Oikos. 2011;120(7):1099–1109.
- Simó M, Laborda A, Jorge C, et al. Las arañas en agroecosistemas: bioindicadores terrestres de calidad ambiental. INNOTEC. 2011;6:51–56.
- Atencio R, Goebel F, Miranda RJ. Entomofauna associated with sugarcane in Panama. Sugar Tech. 2019;21(4):605–618.
- Byk A. Abundance and composition of Geotrupidae (Coleoptera: scarabaeoidea) in the developmental cycle of pine stands in Człuchów Forest (NW Poland). Balt J Coleopterol. 2011;11(2):171–186.
- Cárdenas-Castro E, Páez-Martínez A. Comportamiento reproductivo de coleópteros coprófagos (Coleoptera: scarabaeidae) en condiciones de laboratorio. Rev Cienc Agr. 2017;34(1):74–83.
- Nichols E, Spector S, Louzada J, et al. Ecological functions and ecosystem services provided by Scarabaeinae dung beetles. Biol Conserv. 2008;141(6):1461–1474.
- Silva RJ, Pelissari TD, Krinski D, et al. Abrupt species loss of the Amazonian dung beetle in pastures adjacent to species-rich forests. J Insect Conserv. 2017;21(3):487–494.
- Basto-Estrella GS, Rodríguez-Vivas RI, Delfín-González H, et al. Escarabajos estercoleros (Coleoptera: scarabaeidae: scarabaeinae) de ranchos ganaderos de Yucatán, México. Rev Mex Biodivers. 2012;83(2):380–386.
- Gardner SM, Cabido M, Valladares G, et al. The influence of habitat structure on arthropod diversity in Argentine semi-arid Chaco forest. J Veg Sci. 1995;6(3):349–356.
- Molina S, Valladares G, Gardner S, et al. Comunidad de insectos capturados en trampas de intercepción (pitfall traps) en una reserva del Chaco semiárido en el centro de Argentina. Acta Entomol Chile. 1998;22:57–62.
- Rusch A, Valantin-Morison M, Sarthou JP, et al. Biological control of insect pests in agroecosystems. Effects of crop management, farming systems, and seminatural habitats at the landscape scale: a review. Adv Agron. 2010;109:219–260.
- Rubio GD, Baigorria JEM, Scioscia CL. Arañas Saltícidas de Misiones: guía para la identificación: tribus basales. 1a Ed. ampliada. Ciudad Autónoma de Buenos Aires: Universidad Maimónides: Ediciones Fundación Azara; 2018.
- Montero GA, Carnevale NJ, Magra G. Ensambles estacionales de artrópodos epigeos en un bosque de quebracho (Schinopsis balansae) en el Chaco Húmedo. Rev Colomb Entomol. 2011;37(2):294–304.
- Ruzicka V. Biodiagnostic evaluation of epigeic spider communities. Ekol (CSSR). 1987;6(4):345–357.
- Sánchez-Ruiz A. Efecto de los cambios en el uso del suelo sobre la fauna de arañas (Arachnida, Araneae) en el macizo montañoso Sagua-Baracoa (Cuba). AvaCient. 2001;32:3–12.
- Samu F, Szinetár C. On the nature of agrobiont spiders. J Arachnol. 2002;30(2):389–402.
- Thorbek P, Bilde T. Reduced numbers of generalist arthropod predators after crop management. J App Ecol. 2004;41(3):526–538.
- Schmidt M, Tscharntke T. Landscape context of sheetweb spider (Araneae: linyphiidae) abundance in cereal fields. J Biogeogra. 2005;32(3):467–473.
- Ali AD, Reagan TE. Influence of selected weed control practices on araneid faunal composition and abundance in sugarcane. Environ Entomol. 1986;15(3):527–531.
- Easwaramoorthy S, David H, Kurup NK, et al. Studies on the spider fauna of sugarcane ecosystem in Southern peninsular India. J Biol Control. 1994;8(2):85–93.
- Rajeswaran J, Duraimurugan P, Shanmugam P. Role of spiders in agriculture and horticulture ecosystem. J Food Agric Environ. 2005;3:147–152.
- Malik S, Ursani TJ, Khokhar JA, et al. Spider guilds in the sugarcane fields of two districts of Sindh, Pakistan. Int J Zool Stud. 2018;3(6):8–11.
- Dippenaar-Schoeman AS, van den Berg AM, Haddad CR, et al. Current knowledge of spiders in South Africa agroecosystems (Arachnida: araneae). T R Soc S Afr. 2013;68(1):57–74.
- Moya MI, Meneses RI, Sarmiento J. Historia natural de un valle en Los Andes: la Paz. Segunda edición. La Paz: Bolivia: Museo Nacional de Historia Natural; 2015.
- Agüero J, Galati B, Torretta J. Structure and ultrastructure of floral nectaries of two Opuntia species (Cactaceae) in relation to their floral visitors. Plant Syst Evol. 2018;304(8):1057–1067.
- Grez AA. El valor de los Fragmentos pequeños de bosque maulino en la conservación de la fauna de coleópteros epigeos. In: Smith-Ramírez C, Armesto JJ, Valdovinos C, editors. Historia, biodiversidad y ecología de los bosques de la Cordillera de la Costa. Chile: Editorial Universitaria, Santiago; 2005: 565–572 .
- Flores GE. Tenebrionidae. In: Morrone JJ, Coscarón S, editors. Biodiversidad de artrópodos argentinos: una perspectiva biotaxonómica. Argentina: Ediciones Sur, Buenos Aires; 1998. p. 232–257.
- Flores GE, Debandi GO, et al. Coleoptera: tenebrionidae. In: Cordo HA, Logarzo G, Braun K, Di Iorio, O editors. Catálogo de insectos fitófagos de la Argentina y sus plantas asociadas. Argentina: Buenos Aires: Sociedad Entomológica Argentina Ediciones; 2004. p. 197–201.
- Aballay FH, Flores GE, Silvestro VA, et al. An illustrated key to and diagnoses of the species of Tenebrionidae (Coleoptera) associated with decaying carcasses in Argentina. Ann Zool. 2016;66(4):703–726.
- Si X, Baselga A, Leprieur F, et al. Selective extinction drives taxonomic and functional alpha and beta diversities in island bird assemblages. J Anim Ecol. 2016;85(2):409–418.
- Martínez-Morales MA. Nested species assemblages as a tool to detect sensitivity to forest fragmentation: the case of cloud forest birds. Oikos. 2005;108(3):634–642.
- Gobbi M, Fontaneto D. Biodiversity of ground beetles (Coleoptera: carabidae) in different habitats of the Italian Polowland. Agr Ecosyst Environ. 2008;127(3–4):273–276.
- McKinney ML. New Pangea: homogenizing the future biosphere. Proc California Acad Sci. 2005;56(1):119–129.
- Olden JD, Poff NL. Toward a mechanistic understanding and prediction of biotic homogenization. Am Nat. 2003;162(4):442–460.
- Rooney TP, Wiegmann SM, Rogers DA, et al. Biotic impoverishment and homogenization in unfragmented forest understory communities. Conserv Biol. 2004;18(3):787–798.
- González-Reyes AX, Rocha AM, Corronca JA, et al. Effect of urbanization on the communities of tardigrades in Argentina. Zool J Linn Soc-Lond. 2020;188(3):900–912.
Appendix
Table A1. Araneae: Supplementary material.
Table A2. Coleoptera: Supplementary material.