
ABSTRACT
In 2012, 32% of Kazakhstan’s population nationwide, including 70% of rural households, used coal as a primary source of space heating energy. Equally dramatic is the statistic that the average household annual consumption of coal increased by 44% between 2002 and 2012, from 3.9–5.8 tons to 5.6–8.4 tons depending on the region. This paradoxical increase and the high use of coal in a country with plentiful oil and gas reserves along with coal’s negative effects stimulated our interest in investigating the determinants of household coal demand, how subsidies may have shaped its use, and how the government might put its money to better use in providing a cleaner and more sustainable landscape. By estimating two demand models (based on household-level cross-section and household-cohort pseudo-panel data), we demonstrate that energy subsidy reform will reduce coal demand by 30% in the short run and 50% in the long run. In addition, increasing efficiency of all rural houses to that of the houses built after 1990 will decrease coal demand by at least 12%. Finally, we discuss the importance of natural gas and renewable energy sources in enabling the transition of rural households away from coal.
1. Introduction
Kazakhstan is one of a number of countries where coal use for space heating purposes remains widespread. For example, in Mongolia 94.7% of peri-urban households in Ulaanbaatar use coal for heating purposes.Citation1 In China, coal is the primary source of heating energy for 21.4% of rural and 10.5% of urban households.Citation2 In China’s northern provinces, 80%–100% of rural households derive energy for home heating from coal, which accounts for 60% of total per capita energy use.Citation2,Citation3 In Poland, 70% of single-family houses representing 3.5 million households are heated with coal.Citation4 So why do we care? According to Niu et al.,Citation5 coal use accounts for 41% of CO2 emissions, 46% of CH4 emissions, 93% of SO2 emissions, and 66% of NOx emissions from total rural household energy use in the Gansu province in northwest China. In Poland and four other EU countries, 76% of total GHG emissions from rural energy use is associated with coal and heating oil consumption.Citation6 Finally, household coal use is a key factor of outdoor and indoor air pollution that leads to high incidence of lung cancer, respiratory disorders, and other diseases.Citation7,Citation8 In addition, in Kazakhstan cases of carbon monoxide poisoning, including fatalities, happen every winter. The reasons include cracks in coal furnaces, plugged chimneys, and uncontrolled coal burning during the nighttime.
Coal use tends to be a feature of rural communities where poverty and the health status of the population represent a major challenge for public policy. As a result, understanding factors that determine household demand for coal is important for designing effective policies that could minimize the harmful impacts of coal use on the environment and quality of life of rural households. However, research on residential or household coal demand is minimal. AndersonCitation9,Citation10 and Zhang and KotaniCitation11 are some of the few studies that report findings on properties of residential energy demand including coal. Our study is specifically focused on identifying and measuring the impact of determinants of household coal expenditures and demand. It is the only study that estimates both the household-level cross-section and dynamic pseudo-panel data models of per capita coal demand. We find that rising income level, low energy efficiency of the housing stock, and limited availability of alternative heating systems were the driving forces behind the growth of coal demand of an average household. We find that increasing energy efficiency of older houses to that of the ones built after 1990 would reduce per capita coal consumption by at least 12%. We propose funding this energy efficiency investment by phasing out Kazakhstan’s current coal subsidy. In addition, we believe that renewable energy sources, due to their decentralized nature of production, may replace coal used by the highly dispersed rural population and thus reduce Kazakhstan’s dependence on fossil fuels.
These findings and our approach are elaborated in the following sections. Section 2 provides background information on household heating energy use in Kazakhstan. Section 3 reviews existing relevant studies. Section 4 discusses specifications of the coal demand model. Section 5 describes the data. Section 6 describes our estimation procedure and results as well as discusses policy implications. Section 7 concludes.
2. Household space heating options in Kazakhstan
In Kazakhstan, detached or semi-detached houses (see for their prevalence by region) are usually heated by coalFootnotei and/or wood. Eighty-four percent of all coal consumers reside in rural areas. In urban and suburban areas, some coal-consuming households have access to central heating or network natural gas. Access to the latter is restricted to the west, where Kazakhstan’s oil and gas industry is located, and the south,Footnoteii where there is a developed network of pipelines transporting natural gas from Uzbekistan. presents information on types of primaryFootnoteiii energy heating systems used by all households, both rural and urban. Based on this information, one may conclude that during 2002–2012 there was a dramatic increase in the share of households using natural gas in the south and the west. However, coal use remained unchanged in both regions, accounting for 42% and 12% of households in the south and west, respectively. In the north, the share of households using coal increased from 29% in 2002 to 37% in 2012.
Table 1. Geographic zones of Kazakhstan and their socioeconomic characteristics.
Figure 1. Heating systems used in 2002 and 2012 (percent of households, by region).
Next we analyze costs of heating 1 square meter of living area of a dwelling depending on type of the primary heating system. shows that in 2002, coal and wood represented the cheapest fuels to heat a house in all three regions of the country. Admittedly, these calculations ignore the pollution cost and labor input necessary to burn coal or wood in domestic furnaces. Evidence from Fairbanks, Alaska indicates that the value of this labor input in a developed country is approximately 6% of average household income.Citation12
Figure 2. Heating costs per square meter in 2002 and 2012 (KZT, by region).
However, by 2012 relative costs of heating energy in Kazakhstan changed (see ). Coal became the most expensive source of heat energy country-wide, especially in the west. The fact that in 2012, coal represented the most expensive heating system in Kazakhstan, even in regions close to coal mining, is not consistent with additional handling and pollution costs not reflected in expenditures. As a result, it is reasonable to attribute differences in heating costs in Kazakhstan in 2012 to varying degrees of subsidization and availability of energy products. The current pricing practice has led to a situation where coal users, i.e., the majority of Kazakhstan’s rural population, have a higher burden of heating costs compared to those who use central heating or network natural gas, i.e., primarily urban residents.
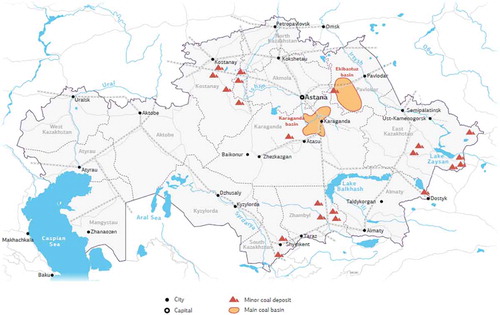
In Kazakhstan, residential coal is sold in an unregulated retail market with many small retailers offering coal from a number of mines,Citation13,Footnoteiv which are concentrated in the north and northeast of the country (location of coal deposits are illustrated on However, the prices of electricity, natural gas, and central heat are regulated. This may explain why prices for these energy products rose at rates below the rate of growth of overall consumer prices (see ).
Table 2. Nominal consumer energy prices in Kazakhstan (KZT/gigajoule).
During 2002–2012, these regulated prices declined in real terms, while the real price of coal increased. Furthermore, all energy prices in Kazakhstan are heavily subsidized. In 2013, the IEACitation14 estimated the average energy subsidization rate in Kazakhstan at 32.8%. The mechanism
Figure 3. Kazakhstan’s major coal basinsCitation15
Finally, space heating in Kazakhstan, as in many formerly centrally planned economies, is highly inefficient. For instance, an OECDCitation17 study reports that the average heat consumption per square meter in apartment buildings in Kazakhstan is 273 kWh, compared to 82 kWh in Sweden.Footnotevi According to the Kazakhstan Ministry of Regional Development,Citation18 most energy-saving measures have undiscounted payback periods of more than 10 years. Such long payback may be related to the low level of energy prices, and these prices create disincentives for efficiency investment. As far as rural houses are concerned, there are no studies that investigate their thermal comfort and energy efficiency. However, as 84% of rural houses were built prior to 1990, and 15% of rural population live below the official poverty line, it is reasonable to expect that rural housing energy efficiency is low.
3. Related literature on household access, affordability, and demand for energy
Our research falls into two strands of literature on resource economics and policy. First of all, our study contributes to the literature on household and residential energy demand. Such studies are based on either the discrete-continuous or the conditional models. Discrete-continuous models use a two-step estimation procedure based on the fact that the demand for energy services represents a joint demand for appliances (discrete) and fuel (continuous). This approach was used by Dubin and McFaddenCitation19 to estimate residential electricity demand in the United States and Baker and BlundellCitation20 to analyze UK residential energy demand. A similar approach was used by Anderson,Citation9,Citation10 who estimated the demand for space heating among US households in 1960 and 1970 using state-level data.
Restrictive assumptions on price expectations and housing market conditions were necessary for the use of the discrete-continuous approach. Therefore, the conditional demand approach to modeling energy demand was developed, which considers demand for fuel as conditional on the stock of energy-using appliances in the household. Baker et al.Citation21 developed and applied this approach to the study of UK household demand for gas and electricity using pooled micro-level data over 1972–1983. The authors proposed a two-stage budgeting model whereby a household first allocates its budget between fuel and non-fuel and then chooses levels of specific fuel use. In the conditional demand approach, the marginal rate of substitution between specific energy types depends on durable stocks, as well as demographic and other characteristics of a household. A more recent application of this approach was by Rehdanz,Citation22 who used German household data for 1998 and 2003 to analyze the influence of socioeconomic characteristics, dwelling properties, and regional effects on household space heating expenditures. Due to a lack of data on regional energy prices, the author used country-wide prices in combination with regional dummy variables. The author found that owner-occupied properties were characterized by lower space heating expenditures compared to tenant-occupied properties. This was explained by different incentives to adapt energy efficiency improvements by owners versus landlords and tenants.
Another study that employs conditional demand was done by Zhang and Kotani.Citation11 The authors analyzed per capita household energy demand in rural Beijing using a survey of 756 households. A demand function for coal was estimated as determined by energy prices, household income, household characteristics, regional variables, and available renewable energy technologies. Of the seven renewable energy technologies, solar heating systems and energy-efficient new houses were found to be most effective in reducing coal consumption.
In addition to contributing to the literature on household energy demand, our study falls into the strand of research on households’ access to energy and its affordability in emerging economies. For example, Freund and WallichCitation23 analyzed welfare effects of raising household energy prices in Poland during the 1990s. They provided evidence that subsidizing energy prices, which was common in Eastern Europe and the former Soviet Union, was regressive. Similarly, Wu et al.Citation24 studied demand for space heating by urban poor in the former Soviet Union during the late 1990s. The authors showed that in Armenia, Moldova, and Kyrgyz Republic, the budget share of heating expenditures of the poor was twice the share of the non-poor. Barnes et al.Citation25 and Khandker et al.Citation26 analyzed household energy demand in Bangladesh and India, respectively. They showed that as household income decreased, energy consumption decreased, but only to a certain minimum level required to maintain a lower bound of welfare. This subsistence level of energy consumption was then used as the fuel poverty line. The results demonstrate that access to modern sources of energy such as electricity and LPG reduced the likelihood of fuel poverty.
To conclude, on the one hand, analysis of the existing literature reveals limited knowledge of properties of household coal demand. On the other hand, the literature review indicates wide usage of the conditional demand model. Finally, interpretation of properties of household coal demand may benefit from understanding challenges faced by the households in emerging countries such as fuel poverty and limited access to subsidized energy products.
4. Specification of the coal demand model
We assume that coal quantity, the furnace, and the heat-capturing characteristics of the dwelling are inputs in the household’s production of space-heating service. The household’s utility function is dependent on this space-heating service, a composite good of all other market goods and services, and observable and unobservable characteristics of the household. The household is assumed to take all prices and income as given and maximize utility subject to its budget constraint and expectations regarding the requirement of the space-heating service during the upcoming heating season. Given a large number of small consumers in the coal market, we assume that a household faces a perfectly elastic coal supply curve. Following the conditional energy demand modeling approach, we assume that the household’s furnace has been completely capitalized, and, therefore, there are no annualized capital costs or “rental prices” of the heating system. Therefore, per capita coal demand of household i in a given period depends on that period’s coal price, per capita income, access to alternative heating systems, observed dwelling characteristics, observed characteristics of the household, the expected length of the heating season and associated outdoor temperature, and other unobserved factors. As a result, the cross-section econometric model of household per capita coal demand is specified as follows:
Under model specification (1) coefficient estimates represent estimates of elasticity for those explanatory variables that are in the natural logarithm form. If an explanatory variable X is a dummy, then coal quantity demanded by a household for which X = 1 will differ from that of a household for which X = 0 by percent.Citation27,Citation28
Next, we assess the robustness of price and income elasticities as well as estimate long-run values for both according to specification (2). Here our data (described in the following section) are from annual surveys of different sets of households and the definitions of many of the regressors are significantly different in comparison with the cross-sectional model. Following the procedure outlined in Bernard et al.,Citation29 we build a pseudo-panel based on four independent cross-sections that come from Kazakhstan’s household budget surveys for 2005, 2007, 2009, and 2011.Footnotevii ,Footnoteviii Similar to Bernard et al.,Citation29 who analyzed electricity demand in the Canadian province of Quebec, where electricity is widely used for space heating, we use the location of a household and its dwelling size as the criteria of identifying cohort membership. We divide households into three groups based on their living space areaFootnoteix: small (less than 39 square meters), medium (between 39 and 58 square meters), and large (greater than 58 square meters). Next, we drop observations on households from 3 out of 14 of Kazakhstan’s oblastsFootnotex (i.e., Atyrau, Mangistau, and West Kazakhstan) because of very few observations. As a result, we have 3 × 11 = 33 cohorts. Our average cohort size is 89 households, which is deemed large enough so that measurement errors of population means are not a concern.
As a result, we assume that household coal demand can be represented by the following dynamic pseudo-panel data per capita demand model:
where ,
,
, and
are similar to the variables specified in the cross-section specification; however, the values represent averages in cohort c during period t. The variable
is the share of households in cohort c that have access to other fuel sources, specifically network gas and central heating. Similarly, both the dwelling and household variables indicate the share of dwellings and households that have specific characteristics in cohort c. The variable
is an unobserved cohort effect, while
is the error term.
To deal with the problem that the lagged dependent variable is correlated with the error term, we follow Bernard et al.’sCitation29 approach based on instrumental variables. The authors’ method makes use of the fixed-effects estimator with cohort means.Footnotexi We regress the lagged endogenous variable on heating degree days and price of coal, as well as dwelling and household variables.
Factors related to cohort size, cohort location, and the nature of regional economic activities create the possibility that the error term can be heteroskedastic. Furthermore, the error terms between two periods may be serially correlated. Therefore, we use the panel data generalized least squares estimator, similar to Bernard et al.,Citation29 and assume that the AR(1) process is common to all of the panels and obtain consistent estimators of cohort variances.
Under model specification (2), the coefficient estimates of and
are interpreted as estimated short-run and long-run price elasticities; whereas
and
are short-run and long-run income elasticities. The coefficient estimate of
can be interpreted by taking the exponential of
. Therefore, we can say that for a one-unit increase in the share of access to another fuel source, we would see an
increase in coal demand. As
represents the effect of one unit change in share of access to another fuel source (or a 100% change in the share), a 0.01 increase in the share of access to another fuel source would have an
increase in coal demand. The values of
and
can be interpreted in the same manner.
A comparison of the pseudo-panel and cross-section estimated coefficients must be cautiously made as in many cases the variables have been defined differently. Furthermore, in the cross-section model, each observation is weighted to ensure that each rural household that uses coal as its primary fuel for space heating is allocated a weighting factor to ensure that the sample closely represents the population of rural households that use coal as their primary source of space heating in the country. This is important in Kazakhstan as coal consumption is more widespread in north and east Kazakhstan, and the cross-section specification weighs these areas more heavily in the estimation process. In contrast, in the pseudo-panel data model each observation is used to calculate a mean value for its corresponding cohort in each oblast for each year. These cohort values (e.g., means, shares) are then used to estimate the coefficient values. As a result, the pseudo-panel data model does not take into account the greater use of coal users in the north and east oblasts beyond the fact that certain oblasts were omitted from the estimation process due to limited number of observations (i.e., Atyrau, Mangistau, and West Kazakhstan).
5. Data sources and description
We use data from the annual Household Budget Survey (HBS) and publications of the Kazakhstan National Statistics Agency (KNSA). The HBS represents a stratified multi-stage cluster sample of 12,000 households and is meant to be representative at the oblast level for both rural and urban regions. Data on household annual coal expenditures are collected by the HBS as part of the questionnaire on housing and utility costs. As in many national HBSs, household-level data on energy prices and quantities consumed are not part of the Kazakhstan HBS. As a result, we use data on average coal prices in oblast centers. These data are published in “Consumer Prices in Kazakhstan,” an annual report by KNSA.
A key variable in our study of coal demand is energy efficiency of capital used in the production of heat energy. We assume that the type of coal furnace is fixed, consistent with the logic of the conditional energy demand model. Therefore, energy efficiency improvements would be represented by increasing the thermal efficiency of a dwelling. As a result, we use three separate variables to capture efficiency characteristics of a dwelling. First, we use the post-1990 variable, a dummy variable for dwellings built in 1990 or later, as a proxy for the original energy efficiency of the dwelling. The year 1990 was chosen as threshold period to account for the structural changes that began in Kazakhstan as a result of the breakup of the Soviet Union and transition from a central planning economy to a market economy. Second, similar to studies by Rehdanz,Citation23 we use dummies for tenant-occupied properties. The assumption is that such dwellings would be characterized by lower efficiency, as tenants often have no capacity and landlords have no incentive to invest in efficiency improvements. Third, we use a dummy variable for renovations expenditures to reflect a potential effect of weatherization on coal usage. Last, we consider dummy variables for the type of dwelling: an apartment, semi-detached, and detached house. Data on these variables that proxy energy efficiency of the dwelling are available from the HBS.
Furthermore, household coal demand depends on the outdoor temperature and the length of the heating season. Thus we use heating degree days (HDDs), which represent the product of the number of days when average daily temperature is less than 65°F and the value of the difference between 65°F and the actual average daily temperature. HDD data source is Weather Underground.Citation30
Finally, household monetary income, dwelling area, and a dummy variable for pensioners are obtained from the HBS. The latter variable is indicative of the time spent at home and thermal comfort levels of household members. To summarize, all data other than coal prices and HDDs are from the HBS and reported at the household level. Household monetary income, coal expenditures, and living area are determined on a per capita basis. In addition, household monetary income, coal expenditures, and coal price values to be used in the dynamic model estimation are deflated using the Consumer Price Index. Summary statistics for the 2012 dataset are presented in .
Table 3. Characteristics of coal-consuming rural households in 2012.
6. Estimation procedure and results
Our empirical framework is set up based on Kazakhstan’s HBS data, which do not have information on household-level coal prices and quantities. Therefore, for the initial stage of our analysis we use annual household expenditures on coal as the dependent variable. This approach is used by RehdanzCitation22 in studies of household energy spending and Barnes et al.Citation25 and Khandker et al.Citation26 in studies of energy poverty. Using coal expenditures instead of coal quantity as the dependent variable does not affect estimation results, with one exception. Price elasticity of coal demand is equal to the price elasticity of coal expenditures minus one.
Applying cross-section model (1) above to the 2012 household-level dataset, we obtain parameter estimates obtained using the ordinary least squares (OLS) estimation procedure (see ). We justify using the OLS by the assumption of the perfectly elastic coal supply curve faced by an individual household. This assumption is plausible due to the large number of small buyers and sellers in the residential coal market.
Table 4. Cross-section model estimation results (2012 household-level data).
Our results from estimating the cross-section model (1) indicate that price and income elasticities of coal demand are -0.50 and 0.47, respectively. The estimate of price elasticity of coal demand is close to the value of -0.38 reported for the residential coal demand in China reported in Zhang and Kotani’sCitation11 cross-section study (see ). However, the unit value of income elasticity reported by that study is much higher than our estimate of 0.47. Differences in per capita income in Kazakhstan versus China may be the reason of discrepancies in the associated income demand elasticity estimates. In addition, the fact that in China coal is used for both cooking and heating, while in Kazakhstan it is used primarily for heating purposes, may be another reason for differences in estimated demand elasticities.
Table 5. Coal demand elasticity estimates.
Now, let us consider the effects of other explanatory variables from the cross-section estimation. The impact of a colder and longer heating season on household coal demand is positive and highly significant (both statistically and economically), as expected. Presence of pensioners is associated with higher use of coal. Size of the dwelling is significant, but its type is not. Next, households with access to either network gas or central heating tend to spend 14.5% less on coal. However, this estimate needs to be interpreted together with the information on the share of such households, which represents only 3% of our sample. As we have demonstrated in Section 2, in 2012 coal represented the most expensive household heating fuel. As a result, households that would have access to central heat or network natural gas should be expected to completely switch away from coal.
Proxies for efficiency are all statistically significant, but their economic significance is relatively small. Specifically, households residing in dwellings built after 1990 use 12% less coal. Those households whose dwellings are not rented use 11.5% less coal. The magnitude of this coefficient is similar to the one reported by RehdanzCitation22 for space heating expenditures of German households. Next, households who have done renovations use 8% less coal. Analysis of this latter estimated effect should take into account that our renovation dummy captures only the non-zero expenditures on renovations made during the last 12 months, and the extent or the nature of such renovations are not reported in the data. In addition, magnitudes of estimated effects of the three efficiency proxies should be considered in the context of subsidized coal prices. In other words, if coal prices were not subsidized, those households who adopt energy efficiency improvements should experience larger cost savings than those reported above.
Next, we assess the robustness of price and income elasticities as well as estimate long-run values for both according to the pseudo-panel dynamic specification (2). Results (see ) indicate that short-run income elasticity of coal demand estimated at the oblast level is 0.37, and associated short-run price elasticity is -0.58. Corresponding long-run income and price elasticities are 0.64 and -1.00, respectively. The short-run elasticities from the panel data estimation are generally consistent with the findings from our household-level cross-section model estimation.
Table 6. Panel data model estimation results.
A less important reason to estimate the pseudo-panel data model is to assess the robustness of the other coefficients. Unlike the cross-section model, the panel-data model estimates indicate that the share of households with access to alternatives and the share of households residing in newer dwellings are not statistically significant, and they have opposite signs than expected by theory (and in the cross-section specification). These differences are likely to be the result of the weighting issue of individual observations in the estimation process that was discussed in Section 4 as well as the variables being defined differently. Another reason why the estimated coefficient for access to alternative fuels was not statistically significant may be that the number of communities in Kazakhstan connected to network gas increased from only 424 in 2006 to 736 in 2012,Citation31,Citation32 and many of these communities were located in southern and western Kazakhstan. Therefore, even in 2012, most of the oblasts did not have access to network gas. The data on access to alternative fuels from the household budget survey conforms to the geographic restriction of natural gas, with positive values for 2005 and 2007 occurring in only southern and western oblasts. Even with the significant increase in communities with network natural gas, the 2012 data indicate only 3% of rural households had access to alternative fuels.
Similarly, the coefficient to dwellings built in 1990 or later may not be statistically significant because there is a wide variance in the number of “new homes” for each cohort in each oblast for each year. For example, the data indicate that no “new homes” were recorded for the Aktobe oblast in 2007 and for the West Kazakhstan oblast in 2009. In contrast, almost two thirds of all houses greater than 58 square meters in the North Kazakhstan oblast sampled in 2007 were built in 1990 or after. As a result, the results suggest that there may be a tendency to build larger dwellings since 1990, and these new homes consume more coal for heating purposes. Using cohort averages and pseudo-panels may overweigh the effect of large dwellings in the analysis.
Finally, in the pseudo-panel data specification the estimated coefficient for renovations is statistically significant with the correctly anticipated sign; however, the value (-0. 401) is significantly larger than the estimated coefficient for the cross-section model (-0.082). This difference, beyond the effect of the variables being defined differently, may be in part the result of the large-house cohorts receiving a higher weighting in the pseudo-panel estimation than in the cross-section specification. The data indicate that only in 3 of the 11 oblasts does the largest cohort have the greatest number of observations.
Below we provide two direct applications of our findings and an extension of related research.
Currently in Kazakhstan there is no indication of the government’s plans to phase out coal subsidies. However, if the government decides to eliminate the 60% coal subsidyCitation33 “overnight,” our findings suggest that the quantity of coal demanded would drop by 30%–36% in the short run. Based on the price elasticity of coal expenditures estimated at 0.496, an average household’s expenditure would increase by 30% in real terms. However, for poor households whose coal consumption prior to the coal price increase is at or below subsistence level, coal expenditures would grow by more than 30%, and such households may have to heat their houses to below the subsistence level. If the coal subsidy is removed over 10 years rather than instantly, then based on our long-run elasticity estimates and the assumed annual real income growth of 2%,Citation34 coal demand will decline by 8.2% per year. After 10 years of this relatively aggressive coal pricing policy, coal demand would decrease by 58% compared to its current level, but up to 30% of rural households will continue depending on coal in the winter.
In 2012, 84% of rural households resided in houses built prior to 1990. Let us assume that all such houses were renovated so that they become as efficient as those built after 1990. Then using information from and , average per capita coal consumption will decrease by 0.22 tons from 1.79 tons per year, or by 12.3%. As the efficiency levels of houses built in the 1990s, i.e., during the economic collapse due to the breakdown of the Soviet Union, is likely to be very far from the technological frontier, additional significant efficiency gains are likely for both the newer and the older rural houses.
Due to its decentralized production flexibility, renewable energy is well suited to match demand from small consumers, scattered across large areas. This permits saving on energy transportation over long distances. Most importantly, renewable energy potential in KazakhstanFootnotexii is exceptionally high. According to Howie and Pak,Citation35 converting from coal to electricity would require that a household purchase equipment for $2700 and weatherize their house for $7700 (in 2014 prices). Given that the average rural household income in Kazakhstan in 2014 was $9500, such a conversion is not feasible without some form of a loan or grant. Assume that the government finances the full cost of conversion of 50% of rural households. In that case, a one-time cash grant to 1.856 million relevant households would amount to $8.2 billion. Compare this one-time amount to the annual coal subsidy in Kazakhstan estimated at $12.09 billion in 2013 and $14.33 billion in 2015.Citation36 In other words, the cost of subsidizing rural households’ conversion to electricity represents a fraction of the annual coal subsidy in Kazakhstan. Note that the IMFCitation36 estimated that the current subsidy on electricity at 0.4%, 80% of which is produced by coal-fired generators, is much smaller than the subsidy for coal, which was estimated at 5.8%.Citation36 Confirming this finding in the context of other relevant economies such as China and Poland is likely given the magnitude of their subsidies. The IMFCitation36 estimated Poland’s coal subsidy at 8.0% and China’s coal subsidy at 18.9%. Furthermore, the IMFCitation36 stated that both Poland and China are not subsidizing their electricity. However, further research is required to confirm the economics of converting from coal to electricity for household space heating in both Poland and China.
7. Conclusions
To conclude, in countries such as Kazakhstan, China, and Poland, urbanization and extension of natural gas networks may partially alleviate environmental and poverty-sustaining impacts of household coal use. However, coal consumption in rural areas will continue to be a challenge for policy makers due to the high cost of providing access to natural gas in sparsely populated areas. High poverty incidence, which limits private funds for weatherization, and uncertainty regarding the longer-run viability of rural communities complicate policy development and implementation, an issue that requires further research. However, our study finds that elimination of coal subsidies in Kazakhstan will reduce coal demand by half in the long run. In addition, the indirect impact of coal subsidy reform is expected to be very substantial if funds released are used for financing energy efficiency and renewable energy sources in rural areas.
Notes
i Cooking and water heating are ancillary services obtained from coal furnaces during the heating season. LPG, network natural gas, and electricity are the primary sources of energy for cooking in Kazakhstan.
ii See . provides definitions of south, north, and west of Kazakhstan.
iii If a household’s expenditures on coal were greater than expenditures on wood, natural gas, or central heat, we considered coal to be this household’s primary source of heating energy.
iv Botatyr Komir supplies 43% of the nationwide production; Eurasian Energy Corporation 21%; Maikuben West 3%; ArselorMittal Temirtau 12%; and Borly Corporation Kazakhmys 9%. Together these five operations account for almost 88% of coal production in the country.
v E.g., the state owns 50% of Bogatyr Komir, which accounts for 43% of annual coal production in Kazakhstan.
vi In 2011, heating degree days (based on 18°C or 65°F) in Stockholm and the two largest cities of Kazakhstan, Almaty and Astana, were 7777, 6941, and 11,141, respectively.
vii Intermediate years are not included because not all variables are consistently collected each year. Furthermore, daily temperature values are not consistently available for all regions before 2005.
viii The numbers of observations drawn from each household budget survey are: 3517 in 2005, 1790 in 2007, 3451 in 2009, and 2987 in 2011.
ix Living space of a house is defined as all surface area excluding the kitchen, bathrooms, and storage space; 39 and 58 square meters represent roughly the 33rd and 66th percentiles of the distribution of living area in the entire sample covering the four years.
x An oblast is the regional administrative unit in Kazakhstan.
xi Bernard et al.Citation29 state that the within estimator with cohort means is consistent if there are a large number of cohorts.
xii More than 50% of Kazakhstan’s territory has a wind speed of 4–5 m/s at 30 meters height. Industrial-scale wind farms are being developed in locations with a wind speed of 8–10 m/s at 30 meters height. In addition, average annual insolation in Kazakhstan is 1300–1800 kW/mCitation2, and average annual insolation duration is 2200–3000 hours, indicating significant potential for application of solar energy technologies. Currently, wind, solar energy, and small hydro plants account for only 0.6% of 19 TW of installed capacity in Kazakhstan. However, technical potential for installed renewable electricity capacity is 354 TW for wind energy and 3760 TW for solar PV.Citation3Citation7
References
- World Bank. Mongolia: Heating in Poor, Peri-Urban Ger Areas of Ulaanbaatar. World Bank: Washington, DC, 2009. http://documents.worldbank.org/curated/en/339891468247270369/Mongolia-Heating-in-poor-peri-urban-ger-areas-of-Ulaanbaatar (accessed Jun 10, 2016).
- Duan, X.; Yong, J.; Wang, B.; Zhao, X.; Shen, G.; Cao, S.; Huang, N.; Qian, Y.; Chen, Y.; Wang, L. Household Fuel Use for Cooking and Heating in China: Results from the First Chinese Environmental Exposure-Related Human Activity Patterns Survey (CEERHAPS). Appl. Energ. 2014, 136, 692–703.
- Liang, L.; Wu, W.; Lal, R.; Guo, Y. Structural Change and Carbon Emission of Rural Household Energy Consumption in Huantai, Northern China. Renew. Sustain. Energ. Rev. 2013, 28, 767–776.
- Pytlinski, L. Coal, Old Stove, and Poor Insulation. In Energy Efficiency in Poland: 2013 Review; Dworakowska, A., Ed.; Institute of Environmental Economics: Krakow, Poland, 2014. https://europeanclimate.org/wp-content/uploads/2014/09/Energy-Efficiency-in-Poland-Review-2013.pdf (accessed Apr 13, 2016).
- Niu, H.; He, Y.; Desideri, U.; Zhang, P.; Qin, H.; Wang, S. Rural Household Energy Consumption and Its Implications for Eco-Environments in NW China: A Case Study. Renew. Energ. 2014, 65, 137–145.
- Groenenberg, H.; van Breevoort, P.; Deng, Y.; Noothout, P.; van den Bos, A.; van Melle. T. Rural Energy in Europe. Country Studies for France, Germany, Italy, Poland, and the UK. Ecofys: Utrecht, Netherlands, 2011. http://www.ecofys.com/files/files/ecofysreportruralenergyintheeu09_2011.pdf (accessed Aug 30, 2016).
- Zhang, J.; Smith, K. Household Air Pollution From Coal and Biomass Fuels in China: Measurements, Health Impacts, and Interventions. Environ. Health Perspect. 2007, 115, 848–855.
- World Health Organization. WHO Guidelines for Indoor Air Quality: Household Fuel Combustion. World Health Organization: Geneva, Switzerland, 2015. http://apps.who.int/iris/bitstream/10665/141496/1/9789241548885_eng.pdf (accessed Oct 14, 2016).
- Anderson, K. P. Residential Energy Use: An Econometric Analysis. Rand Corporation Report R-1297-NSF. Rand Corporation: Santa Monica, 1973. https://www.rand.org/content/dam/rand/pubs/reports/2007/R1297.pdf ( accessed Feb 2, 2016).
- Anderson, K. P. The Price Elasticity of Residential Energy Use. Rand Corporation Report P-5180. Rand Corporation: Santa Monica, 1974. https://www.rand.org/pubs/papers/P5180.html ( accessed Feb 2, 2016).
- Zhang, J.; Kotani, K. The Determinants of Household Energy Demand in Rural Beijing: Can Environmentally Friendly Technologies Be Effective? Energ. Econ. 2012, 34, 381–388.
- McDowell Group. Energy and Economic Impact of Coal in Interior Alaska. Juneau, Alaska. http://www.usibelli.com/pdf/EEIC-report.pdf (accessed Dec 10, 2015).
- Uvaisova, S. Kazakhstan Coal Industry: Current State and Approaches to Transition to an Innovative Type of Development. Middle-East J. Sci. Res. 2013, 15, 1200–1205.
- IEA Fossil Fuel Subsidies Database. International Energy Agency, 2014. www.iea.org/media/statistics/Subsidies20132015.xlsx (accessed Jan 12, 2016).
- Kazenergy. The National Energy Outlook. Kazakhstan Energy Association: Astana, Kazakhstan, 2015. http://www.kazenergy.com/images/NationalReport15_English.pdf (accessed Jan 10, 2016).
- International Monetary Fund, 2013. Energy Subsidy Reform: Lessons and Implications. http://www.eisourcebook.org/cms/March_2013/Energy%20Subsidy%20Reform,%20Lessons%20&%20Implications.pdf (accessed Jan 11, 2016).
- Organization of Economic Cooperation and Development. Promoting Energy Efficiency in the Residential Sector in Kazakhstan: Designing a Public Investment Program. Organization of Economic Cooperation and Development: Paris, France, 2012. https://www.oecd.org/env/outreach/KAZ%20report_programme%20design_ENG_web%20version.pdf (accessed Jan 11, 2016).
- Methodological Instructions for Energy Efficiency Activities Based on the Energy Audit of Residential and Public Buildings (in Russian). Kazakhstan Ministry of Regional Development, 2014.
- Dubin, J. A.; McFadden, D. L. An Econometric Analysis of Residential Electric Appliance Holdings and consumption. Econometrica 1984, 52, 345–362.
- Baker, P.; Blundell, R. The Microeconometric Approach to Modelling Energy Demand: Some Results for UK Households. Oxford Rev. Econ. Pol. 1991, 7, 54–76.
- Baker, P.; Blundell, R.; Mickelwright, J. Modelling Household Energy Expenditures Using Micro Data. Econ. J. 1989, 99, 720–738.
- Rehdanz, K. Determinants of Residential Space Heating Expenditures in Germany. Energy Econ. 2007, 29, 167–182.
- Freund, C.L.; Wallich, C. I. The Welfare Effects of Raising Household Energy Prices in Poland. Energy J. 1996, 17, 53–77.
- Wu, X.; Lampietti, J.; Meyer, A. S. Coping with the Cold: Space Heating and the Urban Poor in Developing Countries. Energ. Econ. 2004, 26, 345–357.
- Barnes, D. F.; Khandker, S. R.; Samad, H. A. Energy Poverty in Rural Bangladesh. Energ. Pol. 2011, 39, 894–904.
- Khandker, S. R.; Barnes, D. F.; Samad, H. A. Are the Energy Poor Also Income Poor? Evidence from India. Energ. Pol. 2012, 47, 1–12.
- Giles, D. E. Interpreting Dummy Variables in Semi-Logarithmic Regression Models: Exact Distributional Results. University of Victoria Department of Economics Working Paper EWP 1101. Victoria, BC. Unpublished work, 2011.
- Derrick, F. W. Interpretation of Dummy Variables in Semilogarithmic Equations: Small Sample Implications. Southern Econ. J. 1984, 50, 1185–1188.
- Bernard, J.-T.; Bolduc, D.; Yameogo, N.-D. A Pseudo-Panel Data Model of Household Electricity Demand. Res. Energ. Econ. 2011, 33, 315–325.
- Weather Underground. https://www.wunderground.com/global/KZ.html (accessed Feb 10, 2016).
- Committee of Statistics of the Republic of Kazakhstan. Housing and Public Utilities, 2011. http://www.stat.gov.kz/getImg?id=WC16200014851 ( accessed Jan 30, 2016).
- Committee of Statistics of the Republic of Kazakhstan. Housing and Public Utilities, 2015. http://www.stat.gov.kz/getImg?id=ESTAT159878 ( accessed Jan 30, 2016).
- IEA Energy Subsidies Database. International Energy Agency, 2013. http://www.iea.org/subsidy/index.html ( accessed Jan 12, 2016).
- International Monetary Fund. Regional Economic Outlook: Middle East and Central Asia. International Monetary Fund: Washington, DC, 2015. http://www.imf.org/~/media/Websites/IMF/imported-flagship-issues/external/pubs/ft/reo/2015/mcd/eng/pdf/_menap1015.ashx (accessed Feb 7, 2016).
- Howie, P.; Pak, A. Reducing Fossil-Fuel Subsidies and the Implications for Inequality and Poverty in Kazakhstan: A First Estimate. Proceedings of IAEE 38th International Conference. Antalya, Turkey, May 25–27, 2015.
- Coady, D.; Parry, I.; Sears, L.; Shang, B. How Large Are Global Energy Subsidies? International Monetary Fund Working Paper WP/15/105, 2015. https://www.imf.org/external/pubs/ft/wp/2015/wp15105.pdf (accessed Feb 21, 2016).
- United Nations Development Programme, 2014. Renewable Energy Snapshot: Kazakhstan. http://www.eurasia.undp.org/content/dam/rbec/docs/Kazakhstan.pdf?download (accessed Mar 21, 2016).
