
 ?Mathematical formulae have been encoded as MathML and are displayed in this HTML version using MathJax in order to improve their display. Uncheck the box to turn MathJax off. This feature requires Javascript. Click on a formula to zoom.
ABSTRACT
The D'Hondt method is the most popular proportional apportionment procedure, as well as one of the oldest. Despite this, the method is not fully understood, with serious normative and empirical implications for democratic representation. This paper provides insights into the D'Hondt method through a generalization that is based on a finite mixture model, extends to situations with missing data (e.g. imperfect records), and applies to allocation problems outside of elections. The generalization disproves several widely accepted beliefs, clarifying that the method maximizes the fraction of exactly proportionally represented votes, and providing intuitive measures of overall and party-level disproportionality. The crucial insights of this interpretation are easily communicated in natural language without any mathematical formalisms, which makes it particularly useful for lay audiences and civic education. I illustrate these features with the 1999–2014 British European Parliament elections.
1. Introduction
Most national proportional representation systems and one in five mixed ones now use the D'Hondt method (Bormann and Golder Citation2013), as do some other elections or allocations of parliamentary committee chairs and executive body seats (O'Leary, Grofman, and Elklit Citation2005). Its uses extend into a variety of domains, including allocating claims on indivisibilities (Herrero and Martínez Citation2008) and constrained portfolio selection (Baixauli-Soler, Alfaro-Cid, and Fernandez-Blanco Citation2011) in economics, rounding numbers in statistics (Dorfleitner and Klein Citation1999), codon usage fitting in biochemistry (Takai Citation2016), and within algorithms in computer science (Kruse et al. Citation2016; Zhang et al. Citation2016; Aritsugi and Kubota Citation2017). It is also one of the oldest proportional apportionment methods – the Jefferson method, which apportions identically, was first used two and a quarter centuries ago.
The D'Hondt (Citation1882) method is easy to learn and apply, as was the goal of its designer. It is less easy to see how it maximizes proportionality, because it implies an unintuitive concept of disproportionality. Sainte-Laguë (Citation1910) observed that it minimizes the largest ratio of seat share over vote share, known now as the D'Hondt index, or maximum over-representation. Due to not optimizing other quantities instead, some consider the method less proportional than its alternatives (e.g. Blondel Citation1969; Loosemore and Hanby Citation1971; Lijphart Citation1986; Benoit Citation2000; Farrell Citation2011). Similarly reserved are conclusions about the D'Hondt index as a measure of disproportionality (Monroe Citation1994; Taagepera and Grofman Citation2003).
This paper revisits the D'Hondt method building on two insights. The first is that any seat allocation splits the votes into exactly proportionally represented ones and non-negative residual ones. The second is that apportioning seats is model fitting if it minimizes a distance between the seat shares and the vote shares. Together, these insights connect seat apportionment with statistical mixture models, showing that the D'Hondt method and its equivalents maximize the proportionally represented vote fraction, clarifying what kind of disproportionality they do minimize, and invalidating several published results. The main finding of this paper is that because of this property, the D'Hondt method and its equivalents are a special case of the mixture framework associated with the mixture index of fit (Rudas, Clogg, and Lindsay Citation1994). This generalization provides an easily interpretable measure of who lost and who won under a D'Hondt apportionment in fractions of residual votes. While the D'Hondt index meets only 3.5 out of the 12 influential operational criteria for disproportionality indices given by Taagepera and Grofman (Citation2003), the mixture index meets 8.5 of them, and would place joint third in their ranking of indices. The second finding is that the generalization extends to situations with missing data, such as invalidated votes cast in good faith. The third finding is that the generalization invalidates several results on the D'Hondt method and index by Gallagher (Citation1991); Monroe (Citation1994); Grilli di Cortona et al. (Citation1999), and Van Puyenbroeck (Citation2008).
The paper proceeds in this order, illustrating some of the findings with the 1999–2014 European Parliament elections in England, Scotland, and Wales, which used the D'Hondt method within multi-member constituencies in a single-tier system without a preset threshold. The paper is accompanied by seatdist, an R package that implements 14 apportionment algorithms and 24 disproportionality measures, described in the online appendix.
2. The D'Hondt method within a mixture generalization
The large interdisciplinary literature on proportional apportionment procedures approaches them either by analyzing deviations from proportionality in observed or simulated elections (e.g. Blondel Citation1969; Taagepera and Laakso Citation1980; Taagepera and Shugart Citation1989; Gallagher Citation1991; Pennisi Citation1998; Benoit Citation2000), or in terms of their formal properties (e.g. Loosemore and Hanby Citation1971; Balinski and Young Citation1982; Lijphart Citation1986; Ibaraki and Katoh Citation1988; Gallagher Citation1992; Schuster et al. Citation2003; Grilli di Cortona et al. Citation1999; Niemeyer and Niemeyer Citation2008). This paper takes the second approach. It connects apportionment research with statistical literature on model fit by building on the insight that the seat allocation in a legislature can be considered as a model of the votes. In turn, apportioning seats can be considered as model fitting, and evaluated in terms of goodness-of-fit measures (Pukelsheim Citation2014).
Seat apportionment is concerned with distributing S seats to P parties to reflect the distribution of V votes over the parties.Footnote1 Since S does not have to equal V , it is convenient to consider the problem in terms of shares, so that are the seat fractions,
the vote fractions. When choosing the method, it is often seen as desirable that the resulting allocation is close to proportionality. Since the seats are not divisible, a necessary condition for proportionality under all possible vote distributions is that the number of seats equals the number of votes times a positive integer. This is rarely the case in practice, making exact proportionality unobtainable. The apportionment task is to find such seat shares in the set of admissible seat shares
that best approximates the votes shares in terms of some loss function. Since the seats are indivisible and finite, the set of the possible seat shares is also finite. On the other hand, since there is only one way for a seat allocation to be proportional, but an infinite number of ways in which it can diverge from proportionality, the set of possible loss functions is infinite. This is reflected in the variety of methods to minimize and measure disproportionality (see e.g. Balinski and Young Citation1982; Gallagher Citation1991, Citation1992; Monroe Citation1994; Grilli di Cortona et al. Citation1999; Taagepera and Grofman Citation2003; Karpov Citation2008).
The D'Hondt methodFootnote2 minimizes(Sainte-Laguë Citation1910), also known as the D'Hondt index or as
, where
is the advantage ratio of party p (Taagepera and Shugart Citation1989; Gallagher Citation1991). illustrates the method with a simulated scenario. Hereafter, all the apportionment methods that minimize δ in the sense that out of all the admissible seat distributions they give the one with the smallest value of the D'Hondt index,
are considered as equivalent to the D'Hondt method. The most prominent examples are the Jefferson method and the Hagenbach-Bischoff system.
Figure 1. A graphical illustration of the D'Hondt method. The first two panels show the votes and the seats. The middle panel shows seat shares and vote shares, the fourth panel their ratios, and the last panel shows the seat shares ‘shrunk’ under the vote shares by multiplying them with inverse of the largest ratio, . Data: Gallagher (Citation1991, 35); votes in thousands.
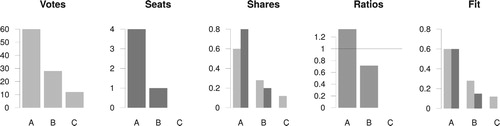
The δ index can be computed for any arbitrary probability distribution of seats.Footnote3 The smallest possible value of δ is one, when for each party its seat share equals its vote share. When this is not the case, at least one party will receive a seat share larger than its vote share, and δ will exceed one. The reciprocal of δ is the largest factor that scales the seat shares to be lower or equal than the vote shares for parties,(1)
(1) Subtracting the scaled seat shares from the vote shares yields the residual vote shares
,
The residual shares sum up to the Real Residuals index
by Lebeda (Citation2006), who considers the D'Hondt divisor as giving the largest possible quota that will award all mandates. Multiplying its reciprocal with
gives a probability distribution
of the residual votes,
This gives rise to a mixture representation of the vote distribution,
(2)
(2)
Any seat allocation can be described by the two-point mixture(3)
(3) that represents the seat shares as a convex combination of the vote shares and some density
. Because of (Equation1
(1)
(1) ), setting π in (Equation2
(2)
(2) ) to
yields the smallest such mixture weight for which the mixture decomposition holds perfectly, making
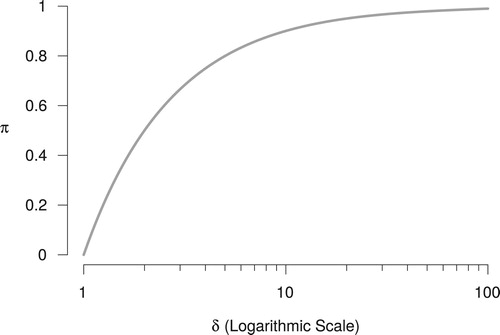
. shows π as a function of δ in such case. The admissible seat shares that minimize δ also minimize π. Defining
as the lowest π possible with
gives
(4)
(4) which is a special case of the mixture index of fit (Rudas, Clogg, and Lindsay Citation1994). The mixture index is a goodness-of-fit measure that measures model fit with the lowest fraction of the population that the model cannot describe. In its general form, the observed density takes the place of
, the model the place of
, a density that belongs to the model the place of
, and a residual density the place of
in (Equation4
(4)
(4) ). The residual density takes the shape that minimizes π, and consequently the mixture (Equation4
(4)
(4) ) will always fit perfectly for
. For a discrete distribution the mixture index is
where
is a density that belongs to the model and
the observed one (Rudas Citation1999). Hereafter, the special case of the mixture index applied to seat apportionment is called the D'Hondt
(
), the smallest possible residual vote fraction in a legislature with S indivisible seats under vote shares
. The mixture index for fixed seat and vote shares will be called
.
Figure 2. The fraction of residual votes π as a function of the D'Hondt index δ (shown on logarithmic scale) for .
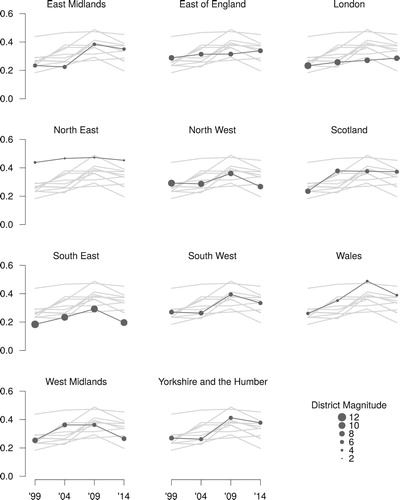
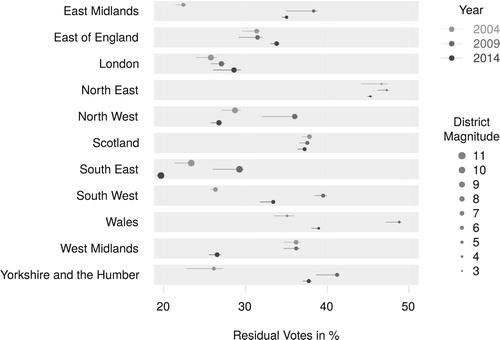
Since 1999, British elections to the European Parliament use the D'Hondt method. shows the residual fractions computed by constituency. The total residual fractions by election were 26%, 29%, 36%, and 31%. Simultaneously, the correlation of residual fractions and district magnitude kept strengthening, starting from −0.63 and reaching −0.94 (see Figure B.2 in the appendix). An interesting question not pursued here is to what extent this change refects potential gradual adaptations of the parties and the voters to the electoral system.
Figure 3. Residual fractions of valid votes by constituency. Each plot shows the values for all constituencies, and highlights one. Point size indicates the number of seats (district magnitude).
3. Measuring party representation
The D'Hondt method minimizes the D'Hondt index, which is thus a measure of disproportionality that evaluates the method on its own terms. The index describes the overall misfit. It is less clear how to measure misfit for individual parties. Conventionally, the advantage ratio, votes per a single seat, or difference between seat and vote share are used to this aim. However, these measures do not imply the same concept of disproportionality as the D'Hondt method, and thus cannot evaluate it on its own terms. The mixture generalization gives measures that do, within a new kind of residual analysis enabled by the mixture index (Rudas, Clogg, and Lindsay Citation1994; Clogg, Rudas, and Xi Citation1995). In the context of D'Hondt, residuals are
where
are residual votes of party p as a fraction of all votes. Weighting by the reciprocal of party vote shares yields
where
is the fraction of votes of party p that are residual. These two kinds of residuals capture how is the cost of maximizing the mixture index distributed over the parties.
McLean and Johnston (Citation2009) and Johnson, Johnston, and McLean (Citation2014) evaluated the proportionality of the British EP 2009 and 2014 elections unfavourably, arguing that the D'Hondt method distributes seats less proportionally that the Sainte-Laguë method. However, this holds only under the concept of disproportionality embodied by the latter method. As discussed above, there are multiple concepts of disproportionality, and which of them is preferable is an inescapably normative question. The concept of disproportionality embodied by the D'Hondt method prioritizes maximizing the fraction of exactly proportionally represented votes. It is thus useful to reassess the British EP elections from this perspective without taking a normative position on disproportionality concepts.
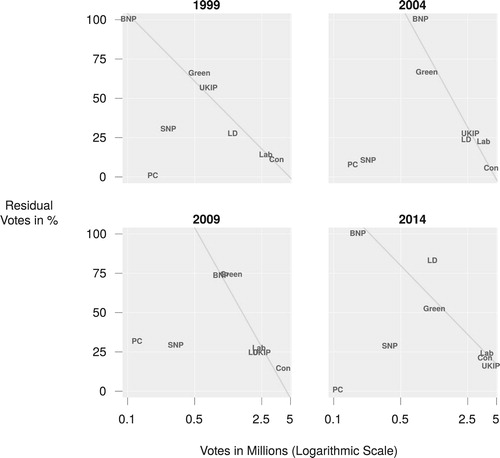
shows such weighted residuals in the British EP elections, by party, constituency, and year. Unlike the other small parties, SNP and PC avoided large fractions of residual votes by competing in a single constituency. Larger parties did not face this issue, as seen also on Liberal Democrats before their national vote share fell, and UKIP after its rose. shows that this relationship was approximately log-linear, as was that of residual votes to seats won, shown in Figure B.3 in the appendix. The costs of maximizing the overall fraction of proportionally represented votes were paid by small nationally competing parties. Even under the concept of disproportionality embodied by the D'Hondt method larger parties did better, but small regional parties avoided having large fractions of residual votes.
Figure 4. Residual fractions by party, year, and constituency. Histograms show total vote shares of the parties by year. Constituency area proportional to valid votes. Cartograms with Eurostat (Citation2017) and Jeworutzki (Citation2016). Shetland and Orkney added to the main area of Scotland. Table B.2 in the appendix reports the vote fractions.
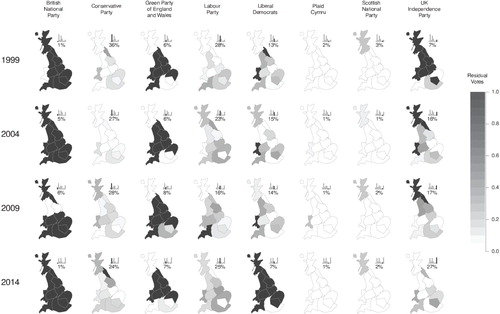
Figure 5. Votes won and unrepresented fractions by party and year. Diagonal lines show OLS slopes for all parties except SNP and PC.
4. Generalization to partially unobserved vote
The mixture index has been generalized to missing data (Rudas Citation2005; Rudas, Verdes, and Medzihorsky Citation2019). This allows to define a more general index, , under which the vote distribution can take a different meaning, and denote not the observed vote, but a hypothetical vote under different conditions. Examples of such conditions are lack of procedural errors by the voters, wider suffrage, mandatory voting, or perfect access to polling stations. The definition of the unobserved vote might differ accordingly and consist for instance of invalid ballots, abstentions, or legally disenfranchized populations.
For any electorate it is true thatwhere
are the vote shares in case all voters of interest – a category which can be given different definitions under different contexts – would vote,
the observed one,
the unobserved one, and ρ the fraction of unobserved votes. In the case of
, ρ is assumed to be zero and
equal to
. Lifting this assumption leads to the generalized index
(5)
(5) which is the best case value of
for a given unobserved vote rate ρ.Footnote4
Under the best case index, the unobserved votes are distributed in the way that minimizes π. In practice, the unobserved votes might not have this distribution, and it might be of interest to compare the best case value to some other possible unobserved vote distributions. Another reference point is available in the form of the worst case scenario for the fixed observed seat distribution. The worst case scenario can correspond to cases such as the incumbent fraudulently invalidating some of the opposition vote to gain seats. Unlike the best case index, the worst case index is not a case of . It is computed by adding the unobserved votes to the residual ones,
for fixed seat and vote shares and
under D'Hondt and its equivalents. When there is some information available on the unobserved votes, substantive inferences on
and the residual fractions can be further informed by comparing them to their distributions under intermediate scenarios that impose some restrictions on the unobserved distribution. Finally, the precision with which the rate of missing observations might be known varies, it might be of interest to inspect the values of
for a range of rates. Since with increasing rate of missingness
can only decrease, the exploration can be done over a grid of rates (Rudas Citation2005).
illustrates this on the three British EP elections, taking invalid votes as unobserved. The invalid rates were low, ranging from 0.05% to 0.63%. This left little space to worsen the fits of the observed seat distributions, but in some cases they could be noticeably improved under the best case scenario.
Figure 6. Residual vote fractions and intervals between the worst case and best case scenarios under the observed rates of invalid votes. Invalid rates in 1999 are unavailable.
5. Discussion
The generalization of the D'Hondt method presented here leads to a reconsideration of several arguments in the literature on electoral proportionality.
Gallagher (Citation1991, 42) argues that the D'Hondt method does not optimize some overall quantity and dismisses CitationLijphart and Gibberd's (Citation1977, 235) observation that the method minimizes the sum of the ratios of party vote totals over divisors computed by the algorithm and not rewarded with a seat. The mixture generalization invalidates Gallagher's (Citation1991) argument and gives a more intuitive quantity than Lijphart and Gibberd's (Citation1977).
Also incorrect is CitationMonroe's (Citation1994, 141–142) claim that the D'Hondt method minimizeswhere V is the vote total. Consider Gallagher's (Citation1991) example of parties A, B, and C with 60, 28, and 12 votes, respectively (, with votes in thousands). Allocating five seats, the D'Hondt method assigns A four, B one, and C zero seats, which gives a
of 25% and an
of 0.026. However,
is minimized when A gets three, B two, and C zero seats, which lowers it to 0.023, but increases π* to 30%.
Grilli di Cortona et al. (Citation1999) argue that the D'Hondt method minimizeswhere S and V are the total numbers of seats apportioned and votes cast, which they consider equivalent with the Schultz index used in income inequality measurement.Footnote5 Just as for
, only all over-represented parties contribute to the misfit. Consequently, under some vote distributions and legislature sizes, moving a seat from one party to another can lower
while increasing π*. Consider parties A, B, and C with 62, 26, and 12 votes, respectively. Allocating six seats, D'Hondt gives A four, B two, and C zero, with a
of 0.22 and an
of 0.0214. Moving one seat from B to A minimizes
to 0.0206 but increases π* to 0.256.
Taagepera and Grofman (Citation2003) pass the D'Hondt index on 3.5 of their 12 criteria for disproportionality measures. The D'Hondt meets five more of them. Specifically, it takes into account all the seat and vote shares (the first criterion) meeting also the criterion of uniformity (second), lies on the unit interval (fourth), equals to zero if
(fifth), and equals to one if no party with seats did receive votes and all parties without seats did (sixth). Thus, it meets 8.5 of their 12 criteria, placing joint third among the evaluated indexes, in contrast with the D'Hondt index which took the last place.
Van Puyenbroeck (Citation2008, 510) claims that the D'Hondt index corresponds to the Schutz (Citation1951) index of inequality. However, in this context the equivalent of the Schutz index isthe Loosemore and Hanby (Citation1971) index of distortion, a special case of the Gini (Citation1914) dissimilarity index. It is minimized by the largest remainders (or Hamilton) method (Grilli di Cortona et al. Citation1999). D equals to the smallest fraction of vote shares that would need to be redistributed to achieve perfect proportionality under a fixed seat distribution, and will always equal
only under Hamilton and its equivalents. Just like the mixture generalization, it captures a notion of residuals, but a different one.Footnote6 Most importantly in this context, D residuals can be negative, because one party's vote surplus inevitably creates a deficit. In contrast,
gives the smallest fraction of votes that would need to be removed simultaneously to achieve perfect proportionality under a fixed seat distribution, will always equal
only under D'Hondt and its equivalents, and always yields non-negative residuals.
Riedwyl and Steiner (Citation1995, 359) and Borisyuk, Rallings, and Thrasher (Citation2004, 60) argue that the D index captures the fraction of wasted or excess votes. Whether or not do the residuals capture wasted votes depends on how such votes are defined. If wasted votes mean those a party could lose and the seat distribution would stay the same providing the other parties' votes didn't change, then they depend on the apportionment method. Under D'Hondt, the wasted votes fraction of party p with at least one seat can be computed by taking its largest rewarded votes-to-divisor ratio , and the overall largest unrewarded votes-to-divisor ratio of any other party,
,
and if the party has no seats, then all its votes are wasted.Footnote7 Neither the D nor the
residuals correspond to this quantity.
The mixture interpretation applies also to uses of the D'Hondt method outside of seat apportionment. Perhaps the most interesting of these to political scientists is equitable distribution of indivisible resources (Herrero and Martínez Citation2008). Where indivisibilities are distributed minimizing maximum overcompensation, it follows that satisfied claims are maximized and unsatisfied disregarded. Generalizing to inequity measurement for non-negative assets and expectations, the analogue to the D'Hondt index iswhere
are assets of unit i, and
its expectation. Minimizing it also minimizes
interpretable as the fraction of unsatisfied expectations.
6. Conclusion
The D'Hondt method is the most popular proportional apportionment procedure (Bormann and Golder Citation2013), and the equivalent Jefferson method was in use already at the end of the 18th century. Neither Jefferson (Citation1792) nor D'Hondt (Citation1882, Citation1885) did consider their methods in terms of minimizing some measure of disproportionality.Footnote8 The method minimizes the largest ratio of seat share over vote share, known as the D'Hondt index. This property is not seen as particularly appealing, nor is the index considered an appealing measure of disproportionality. Generalizing the method with a finite mixture model shows that it also maximizes the fraction of proportionally represented votes and sets the rest aside as residuals. This invalidates several influential beliefs about the method, with normative and empirical implications for democratic representation and more generally for equitable resource allocation.
The practical significance of this paper's findings to broader debates on proportional representation systems and electoral reform rests on two factors. First, the D'Hondt method is the most common PR system in national elections. Thus, clarifying how the method transforms votes into seats – i.e. its mechanical effects – means understanding better most national elections under PR. Furthermore, the mixture generalization not only invalidates several established findings, but is also more intuitive. Its plainest statement is that the D'Hondt method maximizes the share of proportionally represented votes and discards the rest. This statement can be conceptually understood without recourse to mathematical formulas. Consequently, it can help many voters and candidates to understand what exactly happens with their votes, making it suitable for civic education. Second, since different apportionment methods minimize different types of disproportionality, the normative valuation of the former depends on that of the latter. The findings presented here might thus contribute to a normative reevaluation of the D'Hondt method. Whether or not such reevaluation will be favourable is beyond the scope of this paper.
Supplemental Material
Download PDF (216.5 KB)Acknowledgments
The author would like to thank Tamás Rudas, Gábor Tóka, Vladimír Dančišin, Jason Wittenberg, Zoltán Fazekas, Martin Mölder, Bastian Becker, and Kyle L. Marquardt for comments on earlier versions of this paper. Most of this paper was written while the author was at Central European University, whose support the author gratefully acknowledges. Replication materials, including an R package for the procedures discussed in the paper are available at https://doi.org/10.7910/DVN/ESLT8V.
Disclosure statement
No potential conflict of interest was reported by the author.
Additional information
Funding
Notes
1 For simplicity, the P categories are called here as parties and the V input units as votes. The arguments hold more generally for settings such as P being states and V being their census population etc.
2 There are several versions of the D'Hondt method. Perhaps the simplest is: To allocate S seats, for each party create a vector of its votes-to-divisor ratios by dividing its vote
by
, where k is the divisor. Find the S largest ratios across the P vectors of length S from the previous step. Award each party as many seats as the number of its values among the S largest ones.
3 I'm grateful to an anonymous reviewer for the argument in this paragraph.
4 can be computed using the following procedure: Starting from the observed vote distribution, in as many steps as there are unobserved votes, in each step update the vote distribution by adding a vote to the party with the highest
. Should in a single step multiple parties have the same
, award the vote to the one with the lowest
among them. Should multiple parties meet this condition, if there is more of them than the remaining steps, award the vote at random, otherwise award it to the party with the lowest p.
5 Grilli di Cortona et al. (Citation1999) do not accompany this claim with a citation, and it is thus unclear which index do they refer to as the Schultz index. It is possible that this is a typo, and they intended to refer to the Schutz (Citation1951) index discussed below, which is however different from .
6 A comprehensive overview of the relationship between the Gini dissimilarity index and is in Markatou and Chen (Citation2018).
7 For illustration, in Gallagher's (Citation1991) example ( and Table B.4 in the appendix), Party B's smallest rewarded fraction is 28/1, and the largest unrewarded fraction of any other party are C's 12/1 and A's 60/5. For them to be tied, B would need to lose of its vote. Similarly since A's smallest rewarded fraction is 60/4 and the largest unrewarded fraction is B's 28/2, A could lose
Trivially, C could lose 100% of its votes.
8 D'Hondt's search for his method is summarized based on primary sources by Dančišin (Citation2015). This author is not aware of a comparable account in English, but found the Google Translate service to deliver adequate English translations of the paper as well as of works by D'Hondt (Citation1882) and Sainte-Laguë (Citation1910).
References
- Baixauli-Soler, J. Samuel, Eva Alfaro-Cid, and Matilde O. Fernandez-Blanco. 2011. “Mean-VaR Portfolio Selection Under Real Constraints.” Computational Economics 37 (2): 113–131. doi: 10.1007/s10614-009-9195-1
- Balinski, Michael L., and H. Peyton Young. 1982. Fair Representation: Meeting the Ideal of One Man, One Vote. New Haven, CT: Yale University Press.
- Benoit, Kenneth. 2000. “Which Electoral Formula is the Most Proportional? A New Look with New Evidence.” Political Analysis 8 (4): 381–388. doi: 10.1093/oxfordjournals.pan.a029822
- Blondel, Jean. 1969. An Introduction to Comparative Government. London: Weidenfeld & Nicolson.
- Borisyuk, Galina, Colin Rallings, and Michael Thrasher. 2004. “Selecting Indexes of Electoral Proportionality: General Properties and Relationships.” Quality & Quantity 38 (1): 51–74. doi: 10.1023/B:QUQU.0000013239.55304.98
- Bormann, Nils-Christian, and Matt Golder. 2013. “Democratic Electoral Systems Around the World, 1946–2011.” Electoral Studies 32 (2): 360–369. doi: 10.1016/j.electstud.2013.01.005
- Clogg, C. C., T. Rudas, and L. Xi. 1995. “A New Index of Structure for the Analysis of Models for Mobility Tables and Other Cross-classifications.” Sociological Methodology 25, 197–222. doi: 10.2307/271067
- Dančišin, Vladimír. 2015. “Hľadanie Volebného Deliteľa Victorom D'Hondtom.” [Victor D'Hondt's Search for a Divisor.] Evropská Volební Studia 10 (1): 63–70.
- D'Hondt, Victor. 1882. Système Pratique Et Raisonné De Représentation Proportionnelle. Librairie C. Brussels: Muquardt.
- D'Hondt, Victor. 1885. Exposé Du Système Pratique De Représentation Proportionnelle. Gante: Imprimerie Eug. Van der Haeghen.
- Dorfleitner, Gregor, and Thomas Klein. 1999. “Rounding with Multiplier Methods: An Efficient Algorithm and Applications in Statistics.” Statistical Papers 40, 143–157. doi: 10.1007/BF02925514
- Eurostat. 2017. “Nomenclature of Territorial Units for Statistics.”
- Farrell, David M. 2011. Electoral Systems: A Comparative Introduction. 2nd ed. New York, NY: Palgrave Macmillan.
- Gallagher, Michael. 1991. “Proportionality, Disproportionality and Electoral Systems.” Electoral Studies 10 (1): 33–51. doi: 10.1016/0261-3794(91)90004-C
- Gallagher, Michael. 1992. “Comparing Proportional Representation Electoral Systems: Quotas, Thresholds, Paradoxes and Majorities.” British Journal of Political Science 22 (4): 469–496. doi: 10.1017/S0007123400006499
- Gini, Corrado. 1914. “Di Una Misura Della Dissomiglianza Tra Due Gruppi Di Quantità E Delle Sue Applicazioni Allo Studio Delle Relazione Statistiche.” Atti Del Reale Instituto Veneto Di Scienze, Lettere Ed Arti (Series 8) 74, 185–213.
- Grilli di Cortona, Pietro, Cecilia Manzi, Aline Pennisi, Federica Ricca, and Bruno Simeone. 1999. Evaluation and Optimization of Electoral Systems. SIAM.
- Herrero, Carmen, and Ricardo Martínez. 2008. “Balanced Allocation Methods for Claims Problems with Indivisibilities.” Social Choice and Welfare 30 (4): 603–617. doi: 10.1007/s00355-007-0262-z
- Ibaraki, Toshihide, and Naoki Katoh. 1988. Resource Allocation Problems: Algorithmic Approaches. Cambridge, MA: MIT Press.
- Jefferson, Thomas. 1792. Opinion on Apportionment Bill, 4 April 1792. Founders Online, National Archives, last modified on 12 July, 2016. [Original source: The Papers of Thomas Jefferson, vol. 23, textit1 January–31 May 1792, edited by Charles T. Cullen. Princeton, NJ: Princeton University Press, 1990, pp. 370–377.] Accessed December 7, 2016. http://founders.archivesgov/documents/Jefferson/01-23-02-0324.
- Jeworutzki, Sebastian. 2016. Cartogram: Create cartograms with R. R package version 0.0.2. https://CRAN.R-project.org/package=cartogram.
- Johnson, Richard, Ron Johnston, and Iain McLean. 2014. “Overrepresenting UKIP, Underrepresenting the Greens and Lib Dems: the 2014 European Elections in Great Britain.” Representation 50 (4): 429–437. doi: 10.1080/00344893.2014.982694
- Karpov, Alexander. 2008. “Measurement of Disproportionality in Proportional Representation Systems.” Mathematical and Computer Modelling 48 (9): 1421–1438. doi: 10.1016/j.mcm.2008.05.027
- Kruse, Rudolf, Christian Borgelt, Christian Braune, Sanaz Mostaghim, and Matthias Steinbrecher. 2016. Computational Intelligence. A Methodological Introduction. 2nd ed. New York, NY: Springer.
- Kubota, Takuya, and Masayoshi Aritsugi. 2017. “Assignment Strategies for Ground Truths in the Crowdsourcing of Labeling Tasks.” Journal of Systems and Software 126, 113–126. doi: 10.1016/j.jss.2016.06.061
- Lebeda, Tomáš. 2006. “Teorie Reálné Kvóty, Alternativní Přístup K Meření Volební Proporcionality.” [Real Quota Theory, An Alternative Approach to Measuring Electoral Proportionality.] Czech Sociological Review 42 (4): 657–681.
- Lijphart, Arend. 1986. “Degrees of Proportionality of Proportional Representation Formulas.” In Electoral Laws and Their Political Consequences, edited by B. Grofman and A. Lijphart. New York, NY: Agathon Press.
- Lijphart, Arend, and Robert W. Gibberd. 1977. “Thresholds and Payoffs in List Systems of Proportional Representation.” European Journal of Political Research 5 (3): 219–244. doi: 10.1111/j.1475-6765.1977.tb01289.x
- Loosemore, John, and Victor J. Hanby. 1971. “The Theoretical Limits of Maximum Distortion: Some Analytic Expressions for Electoral Systems.” British Journal of Political Science 1 (4): 467–477. doi: 10.1017/S000712340000925X
- Markatou, Marianthi, and Yang Chen. 2018. “Non-quadratic Distances in Model Assessment.” Entropy 20 (6): 464. doi: 10.3390/e20060464
- McLean, Iain, and Ron Johnston. 2009. “When is Proportional Not Proportional? Great Britain's 2009 Elections to the European Parliament.” Representation 45 (4): 349–355. doi: 10.1080/00344890903235199
- Monroe, Burt L. 1994. “Disproportionality and Malapportionment: Measuring Electoral Inequity.” Electoral Studies 13 (2): 132–149. doi: 10.1016/0261-3794(94)90031-0
- Niemeyer, Horst F., and Alice C. Niemeyer. 2008. “Apportionment Methods.” Mathematical Social Sciences 56 (2): 240–253. doi: 10.1016/j.mathsocsci.2008.03.003
- O'Leary, Brendan, Bernard Grofman, and Jørgen Elklit. 2005. “Divisor methods for sequential portfolio allocation in multi-party executive bodies: Evidence from Northern Ireland and Denmark.” American Journal of Political Science 49 (1): 198–211. doi: 10.1111/j.0092-5853.2005.00118.x
- Pennisi, Aline. 1998. “Disproportionality Indexes and Robustness of Proportional Allocation Methods.” Electoral Studies 17 (1): 3–19. doi: 10.1016/S0261-3794(97)00052-8
- Pukelsheim, Friedrich. 2014. Proportional Representation: Apportionment Methods and Their Applications. New York, NY: Springer.
- Riedwyl, Hans, and Jürg Steiner. 1995. “What is Proportionality Anyhow?” Comparative Politics 27 (3): 357–369. doi: 10.2307/422063
- Rudas, T. 2005. “Mixture Models of Missing Data.” Quality & Quantity 39 (1): 19–36. doi: 10.1007/s11135-004-5945-2
- Rudas, T., C. C. Clogg, and B. G. Lindsay. 1994. “A New Index of Fit Based on Mixture Methods for the Analysis of Contingency Tables.” Journal of the Royal Statistical Society. Series B (Methodological) 56 (4): 623–639. doi: 10.1111/j.2517-6161.1994.tb02004.x
- Rudas, Tamas. 1999. “The Mixture Index of Fit and Minimax Regression.” Metrika 50 (2): 163–172. doi: 10.1007/s001840050042
- Rudas, Tamas, Emese Verdes, and Juraj Medzihorsky. 2019. “Model Based Analysis of Incomplete Data Using the Mixture Index of Fit.” In Advances in Latent Class Analysis: A Festschrift in Honor of C. Mitchell Dayton, edited by G. R. Hancock and G. B. Macready. Charlotte, NC: Information Age Publishing.
- Sainte-Laguë, André. 1910. “La représentation Proportionnelle et la méthode des moindres carrés.” Annales scientifiques de l'École Normale Supérieure 27: 529–542.
- Schuster, Karsten, Friedrich Pukelsheim, Mathias Drton, and Norman R. Draper. 2003. “Seat Biases of Apportionment Methods for Proportional Representation.” Electoral Studies 22 (4): 651–676. doi: 10.1016/S0261-3794(02)00027-6
- Schutz, Robert R. 1951. “On the Measurement of Income Inequality.” The American Ecoomic Review 41 (1): 107–122.
- Taagepera, Rein, and Bernard Grofman. 2003. “Mapping the Indices of Seats–votes Disproportionality and Inter-election Volatility.” Party Politics 9 (6): 659–677. doi: 10.1177/13540688030096001
- Taagepera, Rein, and Markku Laakso. 1980. “Proportionality Profiles of West European Electoral Systems.” European Journal of Political Research 8 (4): 423–446. doi: 10.1111/j.1475-6765.1980.tb00582.x
- Taagepera, Rein, and M. S. Shugart. 1989. Seats and Votes: The Effects and Determinants of Electoral Systems. New Haven, CT: Yale University Press.
- Takai, Kazuyuki. 2016. “CodHonEditor: Spreadsheets for Codon Optimization and Editing of Protein Coding Sequences.” Nucleosides, Nucleotides and Nucleic Acids 35 (5): 223–232. doi: 10.1080/15257770.2015.1127962
- Van Puyenbroeck, Tom. 2008. “Proportional Representation, Gini Coefficients, and the Principle of Transfers.” Journal of Theoretical Politics 20 (4): 498–526. doi: 10.1177/0951629808093778
- Zhang, Bo, Zheng Zhang, Ziyu Ren, Jian Ma, and Wendong Wang. 2016. “Energy-efficient Software-defined Data Collection by Participatory Sensing.” IEEE Sensors Journal 16 (20): 7315–7324.