
 ?Mathematical formulae have been encoded as MathML and are displayed in this HTML version using MathJax in order to improve their display. Uncheck the box to turn MathJax off. This feature requires Javascript. Click on a formula to zoom.
ABSTRACT
This study examines land use transformations and their impact on groundwater quality fluctuations in Chengalpattu district, Tamil Nadu. Chengalpattu is a rapidly urbanizing coastal region in South India. Landsat 5 and 9 satellite imagery were utilized to create land use land cover (LULC) maps for 2011 and 2021, with overall accuracies of 82.20% and 85.71%, respectively. The analysis showed significant growth in built-up and fallow lands due to urbanization, which has altered LULC. Groundwater Quality Index (GQI) was generated using seven groundwater quality parameters, adhering to World Health Organization (WHO) standards. The mean GQI showed slight fluctuations during pre- and post-monsoon periods, with a declining trend in pre-monsoon seasons. The study area predominantly experiences moderate groundwater quality, with fewer areas of low and high quality. The findings indicate that land use transformation significantly impacts groundwater quality, emphasizing the need for sustainable urban planning and water resource management in the region.
1. Introduction
Groundwater serves as one of the primary sources of drinking water for humans and other organisms. More than one-third of the world’s population relies on groundwater for direct consumption and food production (Radouane et al., Citation2023). It plays a pivotal role in agriculture, industry, and various socioeconomic activities, thereby serving as a critical component of the Earth’s ecosystem (Q. Zhang & Wang, Citation2020). However, given the limited nature of groundwater sources, they are facing increasing demands due to the global population’s consistent growth (Tonni Agustiono Kurniawan et al., Citation2023).
The rising population also brings about shifts in land use patterns, consequently impacting groundwater quality, quantity, percolation, and recharge. Currently, India overtakes China as the world’s most populous (United Nations, Citation2023) country. With a per capita land availability of approximately 0.25 ha per person, significantly lower than the global average of around 2.3 ha per person (Census of India, Citation2011), the tension between human and resource demands, particularly for land and water resources, becomes inevitable. India notably consumes more groundwater than the United States and China (Singh et al., Citation2018).
Groundwater quality in various parts of India is on a declining trajectory, with contamination emerging as a significant concern (Bera et al., Citation2022). This contamination encompasses both anthropogenic and geo-genic contaminants (Chakraborti et al., Citation2011). In some cases, groundwater becomes unsuitable for specific uses due to contamination (Ground water year – India Citation2011-2012; India, Citation2011).
Land use emerges as a primary factor regulating groundwater quality, exhibiting robust hydrological connections with the landscape and land use (Lerner & Harris, Citation2009). Researchers worldwide have explored how land use transfer and urbanization impact groundwater quality. Over the last few decades, there has been a global decline in groundwater quality, primarily attributed to the extensive use of fertilizers in agriculture, the discharge of untreated urban sewage and industrial wastewater, and contributions from natural sources such as natural fertilization, bacterial production, and atmospheric deposition (Torres-Martínez et al., Citation2020). Land use transfer notably affects groundwater quality (Anjum et al., Citation2023; Dube et al., Citation2020; He & Wu, Citation2019; Liaqat et al., Citation2021; Khan et al., Citation2018; Rao et al., Citation2016, Scanlon et al., Citation2005). Groundwater quality is influenced by sewage infiltration and industrial pollution resulting from urbanization (Lü et al., Citation2022). Sadia Ismail et al. (Citation2023) have emphasized that the increasing urban built-up areas are a major factor influencing groundwater quality in Lahore’s metropolitan region in Pakistan. In the Peshawar region of Pakistan, intensive agriculture and urbanization-induced land use changes between 2012 and 2019 have led to elevated nitrate levels (Ahmad et al., Citation2021; Srivastava et al., Citation2011). The integration of GIS and remote sensing has proven to be an effective tool for studying the influence of land use and land cover changes on groundwater at a regional scale, offering cost-effectiveness and enhanced accuracy (Elmahdy et al., Citation2020).
The study area is situated in close proximity to the Chennai Metropolitan Area (CMA), a prominent urban center in India that is currently expanding towards the periphery. The environmental condition within the CMA is already displaying a declining trend. Various studies have provided evidence of deteriorating groundwater quality within the CMA. In the coastal area of south Chennai, urbanization and seawater intrusion significantly impact groundwater quality (Sajil Kumar et al., Citation2013). Urbanization, industrial effluents, domestic waste disposal, and agriculture further contribute to groundwater contamination in this region (Sridhar et al., Citation2017). Surface water pollution also affects Chennai’s groundwater quality (Brindha & Elango, Citation2014), while elevated heavy metal levels are evident in the Chrompet industrial area (Priyadharshini et al., Citation2022). This study is of great significance in the current context, as the expansion of the CMA exerts additional pressure on this study region, potentially influencing groundwater quality and environmental conditions. Hence, the importance of effective monitoring and quantification of groundwater quality should not be underestimated. Extracting more groundwater for irrigation raises concerns about future sustainability (MacDonald et al., Citation2016). This region and its surroundings are practicing intensive agriculture. This study mainly encompasses three objectives: First assessing changes in land use and land cover (LULC) between 2011 and 2021, secondly analyzing pre- and post-monsoon groundwater quality from 2011 to 2021, and finally assessing the groundwater quality.
2. Material and methods
2.1. Description of the study area
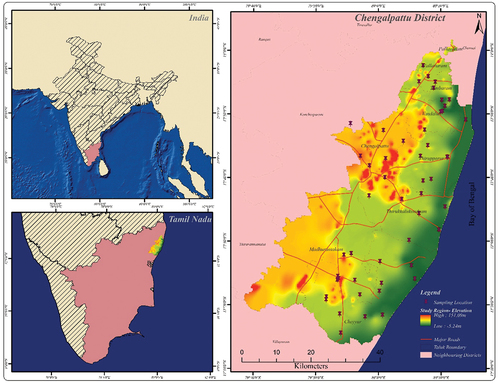
The study area is situated in the southeastern part of India, covering a total area of 2659.4 square kilometers. It spans from latitude 12° 13′ 41 N to 13° 1′ 42 N and from longitude 79° 38’32 E to 80° 15’ 19 E (). The study area is bordered by Chennai in the North, Kancheepuram district in the Northwest, Thiruvannamalai district in the West, Villupuram district in the south, and the Bay of Bengal to the East. This district is divided into eight taluks. As of the 2011 census, the population of this area is 2,556, 244, with a population density of 1123 people per square kilometer. The mean elevation is 30.36 m. They slope from West to East. The district has sedimentary and fissured formations, with aquifer systems consisting of unconsolidated, semi-consolidated, and weathered crystalline rocks. Gondwana sandstones, shales, and Tertiary mottled clays act as porous, semi-consolidated sediments, with groundwater found under water table conditions in sandstones, sands, and thin shale fractures, typically at depths of 5 to 10-m bgl. Groundwater in Unconsolidated Alluvium: Sand layers along the banks of the Palar and Cheyyar rivers serve as potential aquifers. This region is known for its extensive network of irrigation tanks, encompassing approximately 528 major tanks which are dispersed throughout the area. The major rivers in the region include Palar, Adyar, and Ongur, while minor rivers include Neenjal, Pukkadurai Odai, and Kiliyar. The rivers in this region only flow for a few days each year, usually after heavy monsoon rains. Agriculture is the main occupation in the district. This district is connected with other regions by a good transport network. As per the Tamil Nadu Water Supply and Drainage Board (TWard Board), from 2013 to 2017, the average groundwater level in the pre-monsoon season was 9.16 bgl, and in the post-monsoon season, it was 5.81 bgl. In this study area, there are 134 check dams, 89 percolation ponds, and one rechargeable trench. The Chengalpattu district is located in close proximity to the thermal equator, resulting in a typically tropical wet and dry climate. The hottest and coldest months in this region are May and January, respectively, with an average annual temperature of 27.8°C. The presence of approximately 57 km of coastline along the Bay of Bengal moderates fluctuations in temperature. According to the India Meteorological Department (IMD) report, the annual rainfall in this region averages 1236.8 mm, with the highest rainfall occurring during October and November due to the influence of the Northeast monsoon and rainfall is the major source for groundwater recharge.
Figure 1. Location of the study area & sampling locations.
2.2. Data source and methodology
This study utilized georeferenced surveys of India’s 1:50,000 scale toposheets to gather basic information about the study area. Cloud-free Landsat 9 and Landsat 5 data were acquired from the United States Geological Survey (https://earthexplorer.usgs.gov/) for the years 2011 and 2021, respectively. Groundwater quality data from the years 2011 to 2021, covering both pre- and post-monsoon periods, were obtained from the Tamil Nadu State Ground and Surface Water Data Centre.
Groundwater quality data from 51 bore wells were collected from the Tamil Nadu State Ground and Surface Water Resources Data Centre. The study focused on seven parameters: Total Dissolved Solids (TDS), Calcium (Ca), Magnesium (Mg), Sodium (Na), Chloride (Cl), Sulfate (SO4), and Nitrate (NO3). These seven groundwater quality parameters effectively indicate changes in land use conditions in the area (H. H. Khan et al., Citation2011).
2.3. Land use and land cover map preparation
After acquisition, the imagery underwent pre-processing, including layer stacking, histogram equalization, and delineation of the study area. The study area was classified into seven different classes: water bodies, built-up land, forest cover, fallow land, agriculture, riverbeds, and barren land. The Anderson classification system was employed. The Support Vector Machine (SVM) classification technique and a Machine Learning (ML) algorithm were utilized. SVM demonstrated higher accuracy when compared to well-known contemporary techniques such as neural networks and decision trees, as well as traditional probabilistic classifiers like maximum likelihood classification (Foody & Mathur, Citation2004; Huang et al., Citation2002). SVM classification employed four kernels: Linear, Polynomial, Radial Basis Function (RBF), and Sigmoid. However, polynomial and radial basis function (RBF) are commonly used in remote sensing techniques (Huang et al., Citation2002; Maxwell et al., Citation2018). This study employed the RBF function for land use land cover (LULC) classification.
Training samples were obtained from SOI Toposheets, Google Earth maps, and the prior knowledge of researchers for collecting training samples from the images. The images were further reclassified to minimize errors. To assess the reliability of the classified images, this study selected 118 and 119 random points to cover the entire study area of the classified images and their layer-stacked multispectral images from 2011 to 2021, respectively. Accuracy assessment was conducted through visual interpretation and cross-checking of both images. The accuracy report was generated using image processing software. Based on the aforementioned processes, the overall accuracy was 82.20% and 85.71%, with Kappa coefficient values of 0.7790 and 0.8232 for 2011 and 2021, respectively.
2.4. Groundwater quality index generation
This study utilized the Groundwater Quality Index (GQI) proposed by Babiker et al. (Citation2007). The study analyzed the data from 2011 to 2021, spanning one decade, during both the pre- and post-monsoon periods, using seven parameters that indicate the level of land use changes. For example, the significant concentration of Total Dissolved Solids (TDS) in the groundwater signifies dense human settlements and intensive human activities in the area (Ijioma, Citation2021) and waste discharge (Kumar & Krishna, Citation2021). The concentrations of Na and Cl in groundwater serve as indicators of urbanization (Panno et al., Citation2015). Nitrate (NO3) is the most prevalent contaminant in groundwater, primarily originating from the leaching of synthetic fertilizers and on-site sewage disposal practices, especially in regions with moderate to high population density (Reynolds-Vargas et al., Citation2006). Chloride (Cl-), sulfate, and nitrate (NO3-) are crucial indicators that demonstrate the impact of human activities on groundwater quality (Martín Del Campo et al., Citation2014). The levels of nitrate (NO3-), chloride (Cl-), and sulfate (SO4^2-) have progressively risen in a wave-like pattern, underscoring the notable impact of human activities on groundwater quality (Q. Zhang & Wang, Citation2020). Xue et al. (Citation2009) stated that the contamination of surface- and groundwater by nitrates remains an environmental concern in various regions across the globe where intensive agriculture and high population densities are prevalent. Higher population density and a greater extent of residential land use are associated with an increase in nitrate concentrations (Gardner & Vogel, Citation2005).
illustrates the groundwater quality across seven parameters and compares it with WHO permissible limits in the premonsoon years. The mean TDS value fluctuates around the WHO threshold level. In the years 2011 and 2014, TDS levels exceeded the permissible limits. Conversely, the mean values of calcium and magnesium fall within the threshold levels. However, the mean values of Na and Cl often surpass the WHO thresholds. Years like 2011, 2012, 2014, and 2015 exhibit elevated levels. SO4 and NO3 typically remain within acceptable ranges.
Table 1. WHO guideline values for groundwater quality in pre-monsoon years.
In the post-monsoon years in , the mean TDS fluctuates. For example, in 2011 and 2015, the maximum TDS values exceed the permissible limit, indicating potential concerns for water quality. Ca and Mg generally fall within WHO guidelines. Na and Cl often surpass the recommended levels, as seen in years like 2011, 2013, and 2015, which exhibit elevated levels. SO4 and NO3 generally remain within WHO limits, although occasional spikes occur, especially in 2013 and 2014 for SO4 and in 2013 for NO3.
Table 2. WHO guideline values for groundwater quality in post-monsoon years.
The study utilized 51 borehole sampling locations (), which were randomly distributed across the entire study area. The sampling parameters were spatially interpolated. The spatial interpolation helps us to arrive at the unknown values from known values for all the seven parameters. This study employed the Ordinary Kriging method for interpolating groundwater quality samples. Kriging is renowned as a geostatistical interpolation technique (Obaid & Mohammed, Citation2020). This method has been widely utilized in numerous environmental studies (Ahmad Aryafar et al., Citation2020). The seven parameters have different units hence it is necessary to transform them into a common scale. The parameters were standardized using Normalized Difference Index (NDI) methods (Eq 1), in accordance with World Health Organization (WHO) guidelines, to establish the acceptable limits of groundwater quality.
X’ represents the observed concentration, whereas X denotes the maximum desirable concentration according to the guidelines set by the World Health Organization (WHO). The contamination index values derived from the normalized difference map fall within the range of −1 to 1. To eliminate negative values (−1) and convert the normalized difference map into a rank map (sub-index), a polynomial function is applied as follows (Eq 2):
The equation employs C to denote the contamination index value associated with each pixel in the normalized difference map, while r represents the corresponding rank value. The rank map assigns ratings ranging from 1 to 10 based on the contamination index values. The rank of 1 signifies the minimal impact on groundwater quality, whereas the rank of 10 indicates the maximum impact.
The weights were assigned to the rank maps of each parameter by determining the average rank value of each parameter’s rank map. These weights represent the relative importance of each characteristic in terms of groundwater quality. Parameters with higher average rank values are thought to have more impact on groundwater quality and are more significant when assessing overall groundwater quality. The weightage assigned to the six chemically derived contaminant parameters (Cl-, Na+, Ca2+, Mg2+, SO4, and TDS) was determined based on their mean rank values. However, for the parameter NO3, an additional value of two (2) was added to the mean rank value to account for its potential health risk.
where w denotes the weight and r denotes the rank value.
Finally, the weighted assigned rank maps were integrated with the GIS environment using the raster calculator to generate the final GQI map.
Where “r1 w1” denotes weighted assigned rank maps and “N” denotes total number of parameters. The weighted assigned rank maps (r1 w1) are divided by the total number of parameters (N) used in the GQI calculation to average the data and restrict the index values to 1 to 100. This methodology effectively diminishes the influence of individual parameters, ensuring that the index computation is not constrained by a specific number of chemical parameters. The inclusion of “100” in the initial part of the formula directly represents the GQI value. Consequently, high index values approaching 100 correspond to good water quality, whereas values significantly towards 1 indicate poor water quality. Thus, this approach allows for a comprehensive assessment of water quality without limitations on the number of chemical parameters considered.
3. Results and discussion
From the land use and land cover images of 2011 (), it is evident that the fallow land (515.2 km2) is occupying a larger area followed by agriculture (319.6 km2), barren land (237.1 km2), waterbodies (124.3 km2), built-up area (100.5 km2), riverbeds (60.3 km2), and forest cover (57.4 km2) accounting for 36.4%, 22.6%,16.8%, 8.8%,7.1%,4.3%, and 4.1%, respectively (). In 2021, the area coverage of fallow land has increased to 564 km2 followed by built-up land (248.1 km2), agriculture (232.3 km2), barren land (152.5 km2), waterbodies (127.1 km2), riverbeds (57.9 km2) and forest cover (31.7 km2) and thereby accounting for 39.9%, 17.5%, 16.4%, 10.8%, 9%, 4.1%, and 2.2%, respectively.
Figure 2. Land use & land cover (2011–2021).
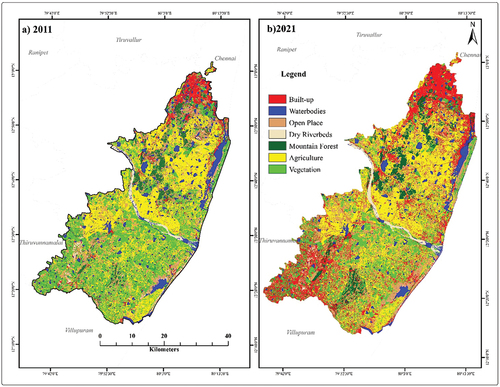
Figure 3. Land use & land cover changes in Chengalpattu district (2011–2021).
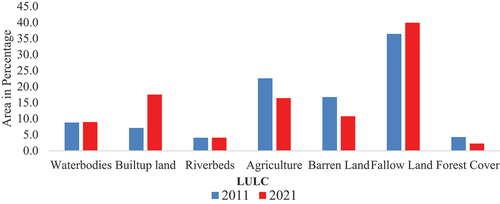
Table 3. Land use/land cover change (2011–2021).
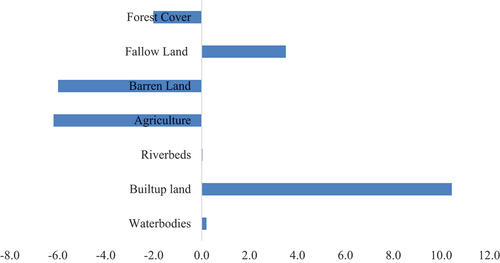
This LULC analysis clearly indicates the rapid rate of urban sprawl in the study area () due to the growth of the built-up area and fallow land which are 10.4% and 3.5%, respectively. Whereas agriculture growth has declined by −6.2% followed by barren land of −6.0% and forest cover by −2.0%.
Figure 4. Land use & land cover changes in Chengalpattu district (2011–2021).
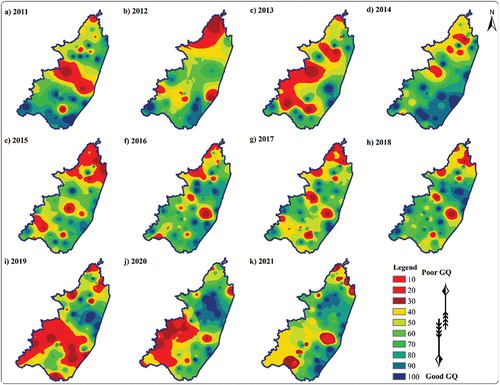
shows the groundwater quality index during the pre-monsoon season from 2011 to 2021 (). The minimum index value ranges from 79.33 to 86.83 and the maximum index value ranges from 92.06 to 95.2. The mean index value ranges between 85.79 and 91.35. The highest mean GQI was found in the year 2021, which is 91.35, and the lowest mean GQI was observed in 2013, which is 85.79. The other years exhibited varying mean values, with some years showing relatively higher mean values (e.g., 2014, 2015, 2017, and 2018) and others displaying lower mean values (e.g., 2013, 2016, 2019, and 2020). The overall mean GQI shows a positive shift in trend but there are variations every year. The groundwater quality shows rapid fluctuations. SD also shows fluctuation every year and there was no increasing or decreasing trend noticed in the region. The highest SD value of 2.69 was observed in the year 2020 and the lowest value of 1.21 was seen in the year 2021.
Figure 5. Ground quality index (2011–2021).
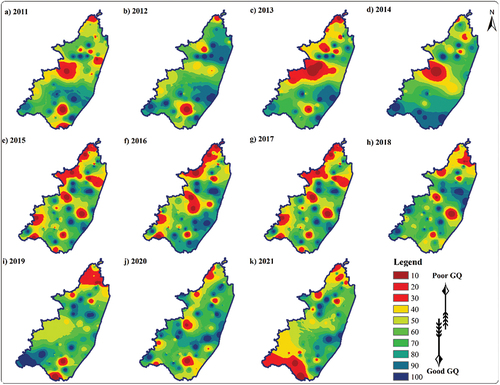
shows the minimum, maximum, and mean GQI over the years during the post-monsoon period (). The minimum value ranges from 78.19 to 87.2, maximum value ranges between 92.48 and 95.63 and the mean value ranges from 85.97 to 91.19. The relatively lowest minimum value (78.19 to 83.57) was observed in the years 2011, 2012, 2014, 2017, and 2019, when compared to the years 2013, 2015, 2016, 2020, and in 2021 ranged from 84.17 to 87.2. During the years 2019, 2020, and 2021, maximum values were observed ranging from 95.23 to 95.63, compared to the rest of the years. Most of the years exhibit maximum values of GQI ranging from 92.48 to 95.63. The mean values generally show consistency, with minor fluctuations observed over the years. 2020 and 2021 show the highest mean value ranging from 90.7 to 91.19. It indicates a better average GQI. On the other hand, 2011, 2014, and 2018 indicate slightly lower mean values, ranging from 85.97 to 89.05. This indicates that the groundwater quality tends to be consistently high across the post-monsoon period. There is no clear increasing or decreasing trend in the mean value, but it shows consistent values during the post-monsoon periods.
Table 4. Groundwater quality index values during the pre-monsoon period (2011–2021).
Figure 6. Ground quality index (2011–2021).
indicates the trend of GWQ during the pre and post-monsoon periods. The good water quality is relatively low but rather the quality is moderate and it shows a continuous fluctuation throughout the year (). The extent of areas with poor quality of groundwater keeps fluctuating every year. The percentage area with poor quality groundwater was found to be 35.44% in 2013, while in 2021, it decreased to 18.05%. The extent of the area with good water quality also fluctuates, for instance, in 2014, a larger extent of the area (36.20%) exhibited good water quality, whereas in 2019, it was 19.94%. The same pattern was found with areas having moderate water quality, which was found to change from year to year (). Similarly, during the post-monsoon seasons, area coverage of moderate groundwater quality was found to range from 45.02% (in 2013) to 57.30% (in 2020).
Table 5. Groundwater quality index values during the pre-monsoon period (2011–2021).
Figure 7. Mean GQI (post & pre monsoon).
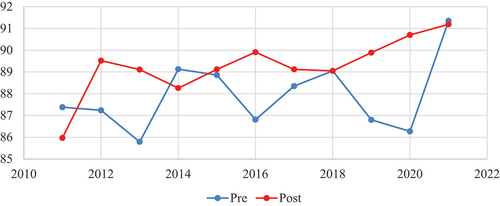
Table 6. Ground quality index (post- & pre-monsoon).
4. Conclusion
The seven parameters chosen for assessing groundwater quality demonstrate the direct impact of urbanization and other land use changes. Both the pre-monsoon and post-monsoon periods show relatively consistent groundwater quality, with minor variations observed in minimum, maximum, mean, and standard deviation values. From various analyses carried out, it shows that the groundwater quality remains stable with fewer fluctuations in the values. The groundwater quality was found to vary during the pre-monsoon and post-monsoon seasons. In both seasons, the areal extent of the region with a moderate quality of groundwater was found to be dominant all over the years. The proportions of low-quality and good-quality groundwater areas show variations in both seasons, although the specific values differ.
The post-monsoon season appears to have higher proportions of low-quality groundwater compared to the pre-monsoon season. High-quality groundwater is relatively more abundant during the pre-monsoon season. Moderate-quality of groundwater consistently dominates, indicating its significance as the most common category. The variation in low-quality and good-quality groundwater indicates the influence of factors such as rainfall, hydrogeological conditions, and human activities.
There is constant deterioration of water quality in the area away from the coast. Various remedial measures and monitoring techniques could have been consistently adopted to prevent further deterioration in water quality.
This study faced several significant limitations, including constraints on data availability, potential time lags in detecting groundwater changes, the complexity of identifying specific sources of contamination, and the necessity for comprehensive field sampling to accurately represent the diverse land use in the region. Moreover, the study might have been influenced by the variability in natural geological conditions and anthropogenic activities, necessitating careful consideration for accurate interpretations.
This study has yielded significant insights into land use transformations and their impact on groundwater quality. From the limitations identified, several recommendations can be highlighted.
Firstly, adopting a comprehensive data collection method utilizing remote sensing, GIS, and field surveys will provide a more holistic dataset. Secondly, involving local communities to gather insights into local practices, potential sources of contamination, and community perceptions will enhance the study’s contextual relevance. Thirdly, adopting modeling approaches to simulate groundwater flow and quality changes will offer predictive insights into future scenarios under different land use trajectories. Additionally, employing advanced statistical methods to analyze the relationship between land use transformation and groundwater quality will help identify significant correlations and trends.
Disclosure statement
No potential conflict of interest was reported by the author(s).
References
- Ahmad, W., Iqbal, J., Nasir, M. J., Ahmad, B., Khan, M. T., Khan, S. N., & Adnan, S. (2021). Impact of land use/land cover changes on water quality and human health in district Peshawar Pakistan. Scientific Reports, 11(1), 16526. https://doi.org/10.1038/s41598-021-96075-3
- Anjum, R., Ali, S. A., Siddiqui, M. A., Parvin, F., Khan, Z., Khan, N., Khanam, Z., & Nafees, M. (2023). Hydro-geochemical assessment of ground water for drinking and agricultural purposes and potential human health risk in Aligarh city, India. Chemical Engineering Journal Advances, 16, 100547. https://doi.org/10.1016/j.ceja.2023.100547
- Aryafar, A., Khosravi, V., & Karami, S. (2020). Groundwater quality assessment of Birjand plain aquifer using kriging estimation and sequential Gaussian simulation methods. Environmental Earth Sciences, 79(10), 1–21. https://doi.org/10.1007/s12665-020-08905-8
- Babiker, I. S., Mohamed, M. A., & Hiyama, T. (2007). Assessing groundwater quality using GIS. Water Resources Management, 21(4), 699–715. https://doi.org/10.1007/s11269-006-9059-6
- Bera, A., Mukhopadhyay, B. P., & Das, S. (2022). Groundwater vulnerability and contamination risk mapping of semi-arid Totko river basin, India using GIS-based DRASTIC model and AHP techniques. Chemosphere, 307, 135831. https://doi.org/10.1016/j.chemosphere.2022.135831
- Bhaskaran, P., & Abraham, M. (2022). Evaluation of groundwater quality and heavy metal pollution index of the industrial area. Chennai, Physics and Chemistry of Earth, Parts A/B/C, 128.
- Brindha, K., & Elango, L. (2014). PAHs contamination in groundwater from a part of metropolitan city, India: A study based on sampling over a 10-year period. Environmental Earth Sciences, 71(12), 5113–5120. https://doi.org/10.1007/s12665-013-2914-x
- Census of India. (2011). National population register & socio economic and caste census.
- Chakraborti, D., Das, B., & Murrill, M. T. (2011). Examining India’s groundwater quality management. Environmental Science & Technology, 45(1), 27–33. https://doi.org/10.1021/es101695d
- Dube, T., Shoko, C., Sibanda, M., Baloyi, M. M., Molekoa, M., Nkuna, D., Rafapa, B. M., & Rampheri, B. M. (2020). Spatial modelling of groundwater quality across a land use and land cover gradient in Limpopo Province, South Africa. Physics and Chemistry of the Earth, Parts A/B/C, 115, 102820. https://doi.org/10.1016/j.pce.2019.102820
- Elmahdy, S. I., Ali, T. A., Mohamed, M. M., Howari, F. M., Abouleish, M., & Simonet, D. (2020). Spatiotemporal mapping and monitoring of mangrove forests changes from 1990 to 2019 in the Northern Emirates, UAE using random forest, Kernel Logistic Regression and Naive Bayes Tree Models. Frontiers in Environmental Science, 8, 102. https://doi.org/10.3389/fenvs.2020.00102
- Foody, G. M., & Mathur, A. (2004). Toward intelligent training of supervised image classifications: Directing training data acquisition for SVM classification. Remote Sensing of Environment, 93(1–2), 107–117. https://doi.org/10.1016/j.rse.2004.06.017
- Gardner, K. K., & Vogel, R. M. (2005). Predicting ground water nitrate concentration from land use. Groundwater, 43(3), 343–352. https://doi.org/10.1111/j.1745-6584.2005.0031.x
- Ground water year – India. (2011-2012). https://gwb.gov.in/cgwbpnm/public/uploads/documents/16856170651359015834file.pdf
- He, S., & Wu, J. (2019). Hydrogeochemical characteristics, groundwater quality, and health risks from hexavalent chromium and nitrate in groundwater of Huanhe formation in Wuqi County, northwest China. Exposure and Health, 11(2), 125–137. https://doi.org/10.1007/s12403-018-0289-7
- Huang, C., Davis, L. S., & Townshend, J. R. G. (2002). An assessment of support vector machines for land cover classification. International Journal of Remote Sensing, 23(4), 725–749. https://doi.org/10.1080/01431160110040323
- Ijioma, U. D. (2021). Delineating the impact of urbanization on the hydrochemistry and quality of groundwater wells in Aba, Nigeria. Journal of Contaminant Hydrology, 240, 103792. https://doi.org/10.1016/j.jconhyd.2021.103792
- India. (2011). https://censusindia.gov.in/nada/index.php/catalog/42619
- Ismail, S., Ahmed, M. F., & Bakar, M. Z. A. (2023). Assessing the impact of urbanization on groundwater quality of lahore region, Pakistan. Environmental Science and Pollution Research, 30(35), 1–21. https://doi.org/10.1007/s11356-023-28400-4
- Khan, H. H., Khan, A., Ahmed, S., & Perrin, J. (2011). GIS-based impact assessment of land-use changes on groundwater quality: Study from a rapidly urbanizing region of South India. Environmental Earth Sciences, 63(6), 1289–1302. https://doi.org/10.1007/s12665-010-0801-2
- Khan, R., & Jhariya, D. C. (2018). Assessment of land-use and land-cover change and its impact on groundwater quality using remote sensing and GIS techniques in Raipur City, Chhattisgarh, India. Journal of the Geological Society of India, 92(1), 59–66. https://doi.org/10.1007/s12594-018-0953-3
- Kumar, A., & Krishna, A. P. (2021). Groundwater quality assessment using geospatial technique based water quality index (WQI) approach in a coal mining region of India. Arabian Journal of Geosciences, 14(12), 1126. https://doi.org/10.1007/s12517-021-07474-9
- Kurniawan, T. A., Lo, W., Liang, X., Goh, H. H., Othman, M. H. D., Chong, K. K., & Chew, K. W. (2023). Remediation technologies for contaminated groundwater due to arsenic (as), mercury (hg), and/or fluoride (F): A critical review and way forward to contribute to carbon neutrality. Separation and Purification Technology, 314, 123474. https://doi.org/10.1016/j.seppur.2023.123474
- Lerner., D. N., & Harris, B. (2009). The relationship between land use and groundwater resources and quality. Landuse Policy, 26(Supplement 1), S265–S273.
- Liaqat, M. U., Mohamed, M. M., Chowdhury, R., Elmahdy, S. I., Khan, Q., & Ansari, R. (2021). Impact of land use/land cover changes on groundwater resources in Al Ain region of the United Arab Emirates using remote sensing and GIS techniques. Groundwater for Sustainable Development, 14, 100587. https://doi.org/10.1016/j.gsd.2021.100587
- Lü, X., Han, Z., Li, H., Zheng, Y., & Liu, J. (2022). Influence of urbanization on groundwater chemistry at Lanzhou valley basin in China. Minerals, 12(3), 385. https://doi.org/10.3390/min12030385
- MacDonald, A. M., Bonsor, H. C., Ahmed, K. M., Burgess, W. G., Basharat, M., Calow, R. C., Dixit, A., Foster, S. S. D., Gopal, K., Lapworth, D. J., Lark, R. M., Moench, M., Mukherjee, A., Rao, M. S., Shamsudduha, M., Smith, L., Taylor, R. G., Tucker, J., van Steenbergen, F., & Yadav, S. K. (2016). Groundwater quality and depletion in the Indo-gangetic basin mapped from in situ observations. Nature Geoscience, 9(10), 762–766. https://doi.org/10.1038/ngeo2791
- Martín Del Campo, M. A., Esteller, M. V., Expósito, J. L., & Hirata, R. (2014). Impacts of urbanization on groundwater hydrodynamics and hydrochemistry of the Toluca Valley aquifer (Mexico). Environmental Monitoring and Assessment, 186(5), 2979–2999. https://doi.org/10.1007/s10661-013-3595-3
- Maxwell, A. E., Warner, T. A., & Fang, F. (2018). Implementation of machine-learning classification in remote sensing: An applied review. International Journal of Remote Sensing, 39(9), 2784–2817. https://doi.org/10.1080/01431161.2018.1433343
- Obaid, A. N., & Mohammed, M. J. (2020). A comparison of topological kriging and area to point kriging for irregular district area in Iraq. Journal of Mechanics of Continua and Mathematical Sciences, 15(4). https://doi.org/10.26782/jmcms.2020.04.00009
- Panno, S. V., Luman, D. E., & Kolata, D. R. (2015). Characterization of karst terrain and regional tectonics using remotely sensed data in Jo Daviess County, Illinois. Circular No. 589.
- Radouane, E. M., Chahlaoui, A., Maliki, A., & Boudellah, A. (2023). Assessment and modeling of groundwater quality by using water quality index (WQI) and GIS technique in meknes aquifer (Morocco). Geology, Ecology, and Landscapes, 7(2), 126–138. https://doi.org/10.1080/24749508.2021.1944797
- Rao, P. N., Prasad, K. M., Madhusudhan, B. J., Krishna, V. S. R., Anand, A. V. S. S., & Madhnure, P. (2016). Impact of urbanization on groundwater quality in Vijayawada urban agglomeration, the new capital region of Andhra Pradesh, India–A baseline study. Journal of the Geological Society of India, 87(5), 539–552. https://doi.org/10.1007/s12594-016-0428-3
- Reynolds-Vargas, J., Fraile-Merino, J., & Hirata, R. (2006). Trends in nitrate concentrations and determination of its origin using stable isotopes (18O and 15N) in groundwater of the western Central Valley, Costa Rica. Ambio: A Journal of the Human Environment, 35(5), 229–236. https://doi.org/10.1579/05-R-046R1.1
- Sajil Kumar, P. J., Jose, A., & James, E. J. (2013). Spatial and seasonal variation in groundwater quality in parts of Cuddalore District, South India. National Academy Science Letters, 36(2), 167–179. https://doi.org/10.1007/s40009-013-0115-5
- Scanlon, B. R., Reedy, R. C., Stonestrom, D. A., Prudic, D. E., & Dennehy, K. F. (2005). Impact of land use and land cover change on groundwater recharge and quality in the southwestern US. Global Change Biology, 11(10), 1577–1593. https://doi.org/10.1111/j.1365-2486.2005.01026.x
- Singh, Y. P., Singh, G., Mishra, V. K., & Arora, S. (2018). Evaluating multipurpose tree species for biomass production and amelioration of sodic soil. Journal of the Indian Society of Soil Science, 66(4), 399. https://doi.org/10.5958/0974-0228.2018.00050.6
- Sridhar, S. G. D., Sakthivel, A. M., Sangunathan, U., Balasubramanian, M., Jenefer, S., Mohamed Rafik, M., & Kanagaraj, G. (2017). Heavy metal concentration in groundwater from Besant Nagar to Sathankuppam, South Chennai, Tamil Nadu, India. Applied Water Science, 7(8), 4651–4662. https://doi.org/10.1007/s13201-017-0628-z
- Srivastava, P. K., Mukherjee, S., Gupta, M., & Singh, S. K. (2011). Characterizing monsoonal variation on water quality index of river mahi in India using geographical information system. Water Quality, Exposure and Health, 2(3–4), 193–203. https://doi.org/10.1007/s12403-011-0038-7
- Torres-Martínez, J. A., Mora, A., Knappett, P. S., Ornelas-Soto, N., & Mahlknecht, J. (2020). Tracking nitrate and sulfate sources in groundwater of an urbanized valley using a multi-tracer approach combined with a Bayesian isotope mixing model. Water Research, 182, 115962. https://doi.org/10.1016/j.watres.2020.115962
- United Nations. (2023). Water Conference. https://www.unep.org/un-2023-water-conference
- Xue, D., Botte, J., De Baets, B., Accoe, F., Nestler, A., Taylor, P., Van Cleemput, O., Berglund, M., & Boeckx, P. (2009). Present limitations and future prospects of stable isotope methods for nitrate source identification in surface- and groundwater. Water Research, 43(5), 1159–1170. https://doi.org/10.1016/j.watres.2008.12.048
- Zhang, Q., & Wang, H. (2020). Assessment of sources and transformation of nitrate in the alluvial-pluvial fan region of north China using a multi-isotope approach. Journal of Environmental Sciences, 89, 9–22. https://doi.org/10.1016/j.jes.2019.09.021