
Abstract
For the first time, the pre-hibernation sizes of “storage” organs (liver and fat bodies), the type, concentration and total content of reserve substances (glycogen or lipids) in these organs and muscle tissue, and their change during freezing in freeze tolerant specimens of the moor frog (Rana arvalis) in the Siberian population were studied. In autumn, the relative weight of the liver (hepatosomatic index) in the studied individuals reaches 10%, which is 2–4 times higher than in most species of Eurasian ranid frogs; this determines 2–4 times greater hepatic glycogen stores. The concentration of glycogen in the muscles is about 4.4 times lower than in the liver, but the total storage of glycogen in the muscles is 43–57% of the storage in the liver. The high degree of glycogen degradation upon freezing in both tissues may indicate that it is promising to search for either high levels of glucose or other cryoprotectants than in the ranid frogs studied so far. The content of lipids in the tissues in autumn is small and not completely consumed before freezing. Probably, lipids play an insignificant role in pre-winter metabolism, and are necessary for maintaining activity after overwintering. Thus, the highest freeze tolerance of the moor frog among the Eurasian ranid frogs (−14°C to −16°C in different Siberian populations) may be due to the high relative weight of the liver, which provides a large supply of glycogen before hibernation, the participation of muscle tissue in the deposition of almost a third part of all glycogen the body, significant consumption of glycogen during freezing for cryoprotectants. The patterns of storage and consumption of pre-hibernation energy resources in frogs of the genus Rana differ greatly not only between terrestrial and aquatic hibernators but also between freeze tolerant species.
Introduction
The moor frog Rana arvalis Nilsson, 1842, is one of the abundant and most widespread species of brown frogs in Northern Eurasia. Its range extends over the whole spectrum of natural zones from steppes to tundra; the longitudinal extent of the area is about 7500 km – from France to southwestern Yakutia (about 124°E) (Glandt Citation2008; Sedalishchev & Odnokurtsev Citation2017). Due to its wide distribution and abundance, the moor frog is one of the most comprehensively studied Eurasian amphibian species. However, some of its biological features are still little studied, including wintering (places, depths, temperatures, relation to temperatures in terrestrial hibernacles and oxygen content in water, etc.). Unlike many other species of brown frogs, two types of wintering are indicated for the R. arvalis – on land and in water bodies (Krasavtsev Citation1939; Terentyev Citation1950; Kushniruk Citation1964; Elmberg Citation2008; Glandt Citation2008; Matkovskiy & Starikov Citation2011; van der Lugt & Slagboom Citation2016; Sedalishchev & Odnokurtsev Citation2017). In Central Europe, the moor frog wintering lasts 3–4 months, often at positive temperatures, while in the north it can last 9 months, and in many sites at negative temperatures.
Voituron et al. (Citation2009) showed that R. arvalis is a freeze tolerant species: 50% of juveniles in the Danish population survive after 72 hours at −3.4°C. For a long time it was believed that this freeze tolerance is the most significant among the Eurasian species of ranid frogs. However, studies by Berman et al. (Citation2020) in several populations of Eastern Europe and Western Siberia showed that R. arvalis tolerates down to −16°C. In order to survive long autumn-winter periods of starvation and winter resistance to negative temperatures, animals must have resources accumulated in summer, sufficient also to ensure reproduction next spring. Some changes in metabolism (dynamics of glucose and lactate levels in tissues) of a moor frog during freezing and thawing were shown by Voituron et al. (Citation2009). However, almost nothing is known about the processes ensuring the survival in populations with significant freeze tolerance, and the dynamics of mass the storage organs and reserve substances contents has not been studied.
The main reserve substances in amphibians are glycogen and lipids; the main storage of glycogen is the liver, the vast majority of lipids are stored in abdominal fat bodies, but both reserve substances are also deposited in other tissues, for example, in muscles. Glycogen in amphibians not only supports basal metabolism and is an important energetic substrate during the breeding season, but also serves as a source of cryoprotectants in freeze tolerant species (Berman et al. Citation1984; Feder & Burggren Citation1992; do Amaral et al. Citation2016). Although lipids are undoubtedly an energetically more favorable substrate, since they produce more than twice as much energy per unit mass as carbohydrates or proteins, amphibian species differ in the ratio of glycogen to fat stored for the winter (Feder & Burggren Citation1992).
In amphibians of the temperate zone, the minimum content of fat and glycogen, as a rule, is observed during the breeding season or after it (until mid-summer). By the end of summer, the amount of reserve substances in the body increases significantly, which leads to an increase in the mass of the liver and fat bodies (Pasanen & Koskela Citation1974; Naumov Citation1981; Wind-Larsen & Jørgensen Citation1987; Costanzo et al. Citation2015; Niu et al. Citation2018). Until now, seasonal changes in the contents of glycogen and lipids in tissues and the related dynamics of the size of the liver and fat bodies have been studied in most cases in species of ranid frogs wintering in water. There is little information about this in freeze tolerant species (Costanzo et al. Citation2013, Citation2015; do Amaral et al. Citation2016) and especially in the moor frog.
In the southeast of Western Siberia, amphibian wintering lasts about 7 months. To survive such a long winter period, animals must have reserves. The ability to survive at low temperatures in the moor frog may be due to the large amount of resources accumulated by the beginning of wintering compared to non-freeze resistant frog species. The aim of this study is to determine the type, content in tissues and dynamics of reserve substances used for wintering in freeze tolerant individuals of the moor frogs in one of the West Siberian populations in order to determine the similarities and differences between these characteristics between R. arvalis and other (non-freeze tolerant and freeze tolerant) frog species.
Materials and methods
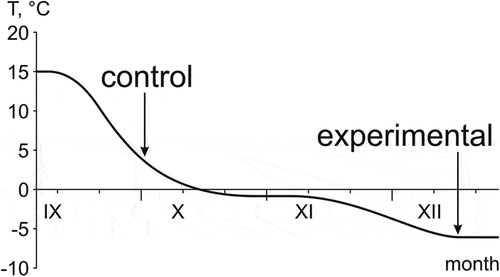
The frogs were collected in the first half of September near Novosibirsk (54.85 N 83.15 E). Then, they were taken in thermal containers at 15°C to the Institute of Biological Problems of the North (Magadan), where pre-winter acclimation and cooling were carried out. The frogs were placed in 1-L transparent plastic containers filled with green moss (humidity of about 90%), and the temperature was gradually lowered () in accordance with the cooling regime observed in nature in wintering places (see Berman et al. Citation2020). Since the beginning of acclimation, the animals were not fed (since they no longer feed in nature in the second half of September). Experimental protocols were approved by the Bioethics Committee of the Institute of Biological Problems of the North (Permission No. 001/021).
Figure 1. The cooling regime of the moor frogs in the laboratory; arrows show the time and temperatures when control and experimental frogs were sampled.
The control autumn frogs (n = 27, ) taken at 4°C were weighed (body mass, BM), double-pithed, measured (body length, SVL), and their organs and muscle tissue were collected for analysis. The liver, fat bodies and part of the muscle (musclus gastrocnemius) were quickly dried on filter paper to remove moisture from the surface and weighed.
Table I. Sample size (n), body mass (BM) and body length (SVL) in the studied moor frogs; mean ± SEM
The experimental animals (n = 26) were cooled to a temperature of −6°C, at which they remained for 10 days. The rate of cooling was 0.05°C/h (1.2°C/day). Frogs were incubated for 20 days at −1°C, and for 1–2 days at −2, −3, −4 and −5°C (). In Siberian populations, at the temperatures down to –1.9 or to –3.3°C, R. arvalis are supercooled; at lower temperatures, they freeze and can survive at down to –14 or −16°C for a long time (Berman et al. Citation2020). The −6°C temperature was chosen because it provides guaranteed 100% survival rate of the moor frogs (Berman et al. Citation2020). In the cooling regime that we used (), the experimental frogs were in a frozen state (below −3.3°C) for at least 15 days.
Since it was not possible to accurately dissect organs from frozen frogs without partially thawing the tissues, the animals were pithed at −6°C and transferred to 3–4°C for thawing. Juvenile and adult frogs completely thawed out (absence of ice in the tissues during palpation) during the 4–12 h after they were placed in 3–4°C, after which they were quickly weighed, measured, dissected, and their organs and tissues were removed (see above).
Hepatosomatic index (HIS) and fat body index (FBSI) were calculated as the ratio of weights of the liver and fat bodies to body weight, expressed in %. The water content (%) was determined in samples (200–500 mg) of liver tissue (n = 22) and gastrocnemius muscles (n = 27) in the control animals and only in the adult experimental animals (n = 11) due to the small size of juveniles. A fresh tissue sample was weighed, dried for 2 days at 105°C and then weighed again (according to Pasanen & Koskela Citation1974).
Determination of glycogen concentration was carried out in all the control and experimental frogs in 20–70 mg weighed samples of liver and muscle tissues, determination of lipids – in the same weighed samples of liver and fat bodies; if the fat bodies were small (less than 20 mg), they were analyzed whole. The liver and muscle glycogen contents were analyzed using o-toluidine accordingly to the methods described previously (Tarnoky & Nagy Citation1963; Severin & Solovyeva Citation1989). The samples were treated with caustic potash. Glycogen was precipitated by ethyl alcohol and hydrolyzed by acid. An Ecoview-UV-3100 spectrophotometer (Shanghai Mapada Instruments Co., Ltd.) was used for determination of optical density. The content of glycogen in samples was calculated by a number of standard glucose solutions. The lipids in liver and in fat body were extracted with diethyl ether: ethanol (1:3) mixture for 48 h and estimated using the turbidimetric method by Canal et al. (Citation1972).
The total content of glycogen and lipids in the liver and lipids in fat bodies was calculated taking into account the mass of organs. The total content of glycogen in the muscles was calculated on the basis that the muscle mass in adult male moor frog reaches 35% of the body weight in autumn, in females – 20%, in juveniles – 25% (our unpublished data). To compare the total storage of glycogen and lipids in individuals of different sex and age, as well as to compare it with other species, the method proposed by Kato (Citation1910) was used – standardization of the body weight of individuals (100 g).
Statistical analysis
The concentrations of glycogen and lipids and the water content in all tissues in the control and the experimental groups were compared using the one-way ANOVA or the Mann–Whitney U-test (if n < 5). Correlations were calculated using the Spearman’s rank coefficient. Significance was judged at P < 0.05. All values are presented as mean ± SEM unless stated otherwise.
Results
Size and weight of animals
The control adult animals did not differ from the experimental animals either in SVL or weight (females: F1,13 = 0.05, P = 0.82; F1,13 = 0.89, P = 0.36; males: U-test, p = 0.14, U-test, p = 0.23). The reproductive system of adult females (ovaries and oviducts) before hibernation has a large mass. Differences in the mass of the reproductive system can affect the indices of organs calculated relative to the total body weight. In the control and experimental females, the mass of the reproductive system did not differ (F1.13 = 0.02, P = 0.9), that is, it did not introduce an error into the calculated hepatosomatic and fat bodies indexes.
The control juvenile animals did not differ from the experimental ones either in weight (F1,15 = 0.84, P = 0.37 – females, F1,11 = 1.84, P = 0.20 – males) or in SVL (F1,15 = 1.43, P = 0.25 – females, F1,11 = 1.81, P = 0.21 – males).
Water content in tissues
The water content in liver of the control females and males did not differ either in adults or juvenile animals; it was similar in animals of different ages (). In the combined sample (n = 22), the water content in the liver was 70.4 ± 0.8% (62–78.8).
Table II. Water content (%) in the liver and muscles of the moor frog in the control group and after freezing and thawing
The water content in the muscles of adult males was higher than that of females (F1,10 = 13.8, P = 0.004), but did not differ in juvenile males and females. The water content in the muscles was higher than in the liver in all age and sex groups of the control animals (; adult males – F1,8 = 50, P = 0.00001, females – F1,13 = 9.7, P = 0.009, juvenile males – F1,11 = 10.8, P = 0.007, females – F1,10 = 9.0, P = 0.01). The water content in the liver and muscles correlated only in the adult females (rs = 0.79, p = 0.04).
After the experimental animals were thawed, their tissues were rehydrated, but the water content did not reach the control values (). The water content in the liver of adult frogs differed insignificantly from the control (by 1% in males and by 3% in females), but the muscles were significantly less hydrated than in autumn (U-test, p = 0.04 and F1,13 = 5.7, P = 0.03, respectively).
The dynamics of the liver and fat bodies masses
Liver
In autumn, the liver weight did not differ either in the adult males and females (1.40 ± 0.28 g and 1.37 ± 0.20 g), or in the juvenile males and females (0.29 ± 0.07 g and 0.25 ± 0.06 g). In the adult females and the juvenile females and males, the liver weight correlated with total body weight (rs = 0.96, p = 0.01, rs = 0.90, p = 0.01, rs = 0.79, p = 0.04).
In the adult experimental animals, the liver weight was significantly lower than in control; in males it reached 0.59 ± 0.06 g (U-test, p = 0.04), in females – 0.56 ± 0.05 g (F1,13 = 16.9, P = 0.001), but in juveniles the differences were insignificant – 0.16 ± 0.04 g (F1,11 = 2.38, P = 0.15) and 0.18 ± 0.02 g (F1,15 = 1.24, P = 0.28), respectively; and also did not differ between sexes in any age group. There was no dependence of liver weight on body weight in the experimental adult animals (p > 0.05), but it remained in the juvenile females (rs = 0.81, p = 0.01) and males (rs = 0.99, p = 0.01).
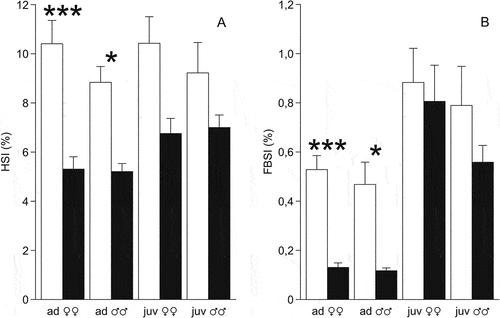
The hepatosomatic index (the ratio of liver weight to body weight) in the control animals was high – the mean value was 9.8 ± 0.5% (n = 27). The mean values in age and sex samples were 8.8–10.4% and did not differ between sexes and age groups (). In animals that underwent freezing, the hepatosomatic index decreased to 6.2 ± 0.3%, but the decrease was significant only in females (F1,13 = 24.3, P = 0.0003 in adults, F1,13 = 5.6, P = 0.03 in juveniles). This may be due to the small sample size of the experimental males.
Figure 2. Relative mass of storage organs (%) in the moor frogs in autumn and after freezing to −6°C and thawing. (a) HSI, hepatosomatic index, (b) FBSI, fat body index. Control frogs (autumn) – white columns; experimental frogs (freezing) – black columns; mean ± SEM; asterisks indicate significant differences between control and experimental group (*P < 0.05; ***P < 0.001).
Fat bodies
All control animals except for one juvenile male had fat bodies. Their mass was greater in the adult females and males (72 ± 13 mg and 74 ± 19 mg, respectively) than in the juveniles (29 ± 8 mg and 21 ± 5 mg). In the adult and juvenile females, the mass of fat bodies correlated with the body mass of individuals (rs = 0.95, p = 0.01; rs = 0.75, p = 0.04) and with the mass of the liver (rs = 0.88, p = 0.01; rs = 0.83, p = 0.02), in the juvenile males – with liver weight (rs = 0.82, p = 0.03); in the adult males, no dependences were found.
The fat bodies in the experimental animals retained, but their average weight decreased from 72–74 mg to 13–14 mg in the adult males (U-test, p = 0.04) and females (F1,13 = 21.4, P = 0.0005), but did not changed significantly in the juvenile animals. Only juvenile males showed a correlation between fat body mass and body mass (rs = 0.81, p = 0.03) as well as liver mass (rs = 0.89, p = 0.03).
The fat body index in autumn did not differ in males and females in both age groups. It also did not differ between adults and juveniles (). In adult animals that underwent freezing, the fat body index was significantly lower than that in autumn (F1,13 = 49.5, P = 0.000009 for females, F1,6 = 8.2, P = 0.03 for males), but did not decrease in juveniles (F1,15 = 0.15, P = 0.70 for females, F1,11 = 1.6, P = 0.23 for males).
Content of glycogen and lipids in tissues
Glycogen
In autumn, the content of glycogen in the liver was not very high (mean values in different age and sex groups were 91–143 mg/g of wet tissue) ()). The absolute values varied greatly in each sample (in 1.6–10.8 fold, ), but the mean values did not differ in individuals in the age and sex groups (p > 0.05). In the adult females and males, the glycogen content in the liver did not correlate with either the weight of the frogs or the weight of the liver. However, it depended on body weight (rs = 0.71, p = 0.05) and liver weight (rs = 0.81, p = 0.02) in the juvenile females, and on liver weight in the juvenile males (rs = 0.79, p = 0.04). The total storage of glycogen in the whole liver before hibernation did not differ between females and males ().
Figure 3. Glycogen content (mg/g of wet tissue) in the liver (a) and muscles gastrocnemius (b) of the moor frogs in autumn (control) and after freezing to −6°C (experiment). Control – white columns; freezing – black columns; mean ± SEM; circles, individual data points; asterisks indicate significant differences between control and experimental group (*P < 0.05; **P < 0.01; ***P < 0.001).
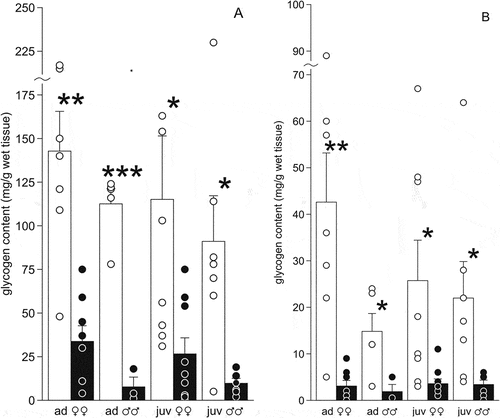
Figure 4. Total glycogen storage (mg) in the liver (L) and muscles (M) of the moor frogs in autumn and after freezing to −6°C. Autumn (control) – white and black columns; freezing (experiment) – gray columns; mean ± SEM; asterisks indicate significant differences between control and experimental group (*P < 0.05; **P < 0.01; ***P < 0.001).
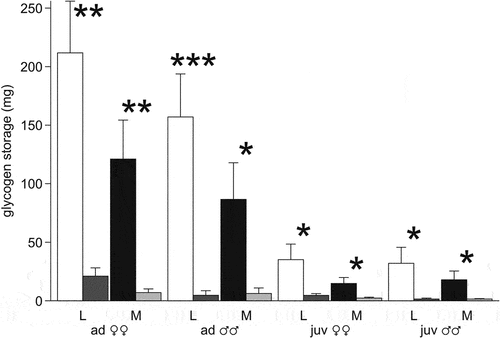
The average glycogen content in the muscles in all age and sex groups was less than in the liver (). It did not differ in females and males (F1,10 = 4.5, P = 0.06 in adults; F1,13 = 0.1, P = 0.75 in juvenile), as well as between the adult and juvenile samples (F1,25 = 0.59, P = 0.45). The glycogen content in muscles and in the liver correlated only in the juvenile females (rs = 0.76, p = 0.03). The total pre-winter storage of glycogen in the muscles of the moor frogs was large ().
In the experimental animals, the average content of glycogen in the liver decreased by more than 5 times compared to control frogs (). The reduction was significant both in adult animals (F1,13 = 22.3, P = 0.004 in females, F1,6 = 73.0, P = 0.0001 in males) and in juveniles (F1,15 = 6.2, P = 0.02 in females, F1,11 = 8.2, P = 0.02 in males). Only in the juvenile females, the liver glycogen content depended on body weight (rs = −0.78, p = 0.04) and muscle glycogen content (rs = 0.68, p = 0.05). The total storage of glycogen in the adult females decreased by 10 times (on average – up to 21 mg), in the juvenile animals and the adult males – by 20–30 times (up to 2–5 mg) ().
The glycogen content in the muscles after freezing was 7 times lower than in the liver. It significantly decreased in individuals of all ages and sexes (in adult females – F1,13 = 15.8, P = 0.002, in males – F1,6 = 6.1, P = 0.048; in juvenile females – F1,15 = 7.2, P = 0.02, in males – F1,11 = 4.8, P = 0.05). The total muscle storage was only 6–7 mg in the adults and about 2 mg in the juveniles ().
Lipids
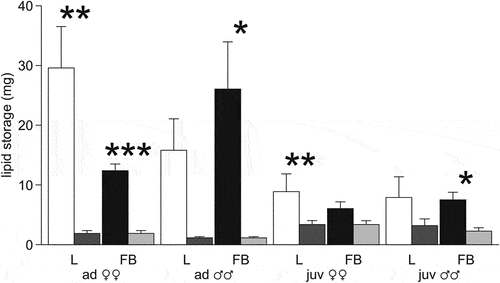
In autumn, the lipid content in the liver did not differ between males and females, nor between age groups (). The mean value in the autumn sample (n = 27) was 27.0 ± 4.2 mg/g of wet tissue. In the adult females, the content of lipids and glycogen in the liver correlated (rs = 0.82, p = 0.03); no correlations were found in the samples of other animals. The total content of lipids in the liver in autumn did not differ in the adult females (on average – 30 mg) and the adult males (16 mg), but was higher than in the juvenile animals (8–9 mg) (F1,25 = 9.5 P = 0.005).
Figure 5. Lipid content (mg/g of wet tissue) in the liver (a) and fat bodies (b) of the moor frogs in autumn and after freezing to −6°C. Autumn (control) – white columns; freezing (experiment) – black columns; mean ± SEM; circles, individual data points; asterisks indicate significant differences between control and experimental group (*P < 0.05; **P < 0.01; ***P < 0.001).
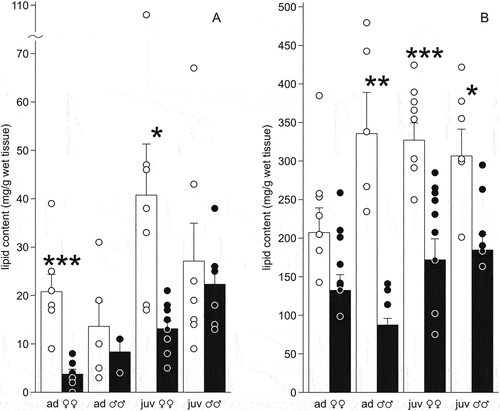
The lipid content in fat bodies was high: the mean values ranged from 207 mg/g of wet tissue in the adult females to 307–336 mg/g in other sex and age groups (). Significant differences in lipid content were observed only between adult and juvenile females (F1,13 = 9.6, P = 0.009). The total lipid content in fat bodies was maximum in adult males, and in other animals it was 2–4 times lower () and significantly differed between adults and juveniles (females – F1,13 = 17, P = 0.001, males – F1,9 = 6,5 P = 0.03).
Figure 6. Total lipid storage (mg) in the liver (L) and fat bodies (FB) of the moor frogs in autumn and after freezing to −6°C. Autumn (control) – white and black columns; freezing (experiment) – gray columns; mean ± SEM; asterisks indicate significant differences between control and experimental group (*P < 0.05; **P < 0.01; ***P < 0.001).
The lipid content in the liver significantly decreased in experimental females (F1,12 = 21.4, P = 0.0006 in adults, F1,15 = 7.47, P = 0.015 in juveniles), and in males it changed insignificantly (F1,6 = 0.53, P = 0.49 in adults; F1,11 = 0.28, P = 0.61 in juveniles). Lipid content correlated with liver glycogen content in adult females (rs = −0.82, p = 0.05), in juveniles – with body weight (rs = −0.83, p = 0.04) and with liver weight (rs = −0.82, p = 0.04).
The lipid content in fat bodies decreased in all groups of experimental animals except for the adult females (F1,6 = 12.1, P = 0.01 in adult males, F1,15 = 18.2, P = 0.0007 in juvenile females, F1,10 = 8.4, P = 0.02 in males).
The total lipid content in the liver and fat bodies before wintering in adult females and males was 42 ± 7.6 mg and 42 ± 6.7 mg, in juveniles – 15 ± 3.8 mg and 16 ± 4.6 mg; in experimental animals of all groups, it decreased to 4–6 mg ().
Discussion
The relative size of the moor frog liver was found to be one of the largest among the studied Eurasian ranid frogs. In the studied population, it is near 10% before wintering, while for most species wintering in water (Pelophylax kl. esculentus, P. ridibundus, Rana temporaria, R.dybowski, R.chensinensis, R. amurensis) it is only 3–5%. Only in separate populations of the latter two species does the liver index reach comparable values (Kato Citation1910; Bleibtreu Citation1911; Pasanen & Koskela Citation1974; Schlaghecke & Blom Citation1978; Sedalishchev et al. Citation1981; Loumbourdis & Kyriakopoulou-Sklavounou Citation1991; Kutenkov Citation1991; Iela et al. Citation1979; Chen & Lu Citation2011; Chen et al. Citation2015; our unpublished data). The maximum seasonal liver index for the listed species (3–5%) corresponds to the seasonal minimum (after breeding and in summer) in the moor frogs in different parts of the range (Shwarts & Ishchenko Citation1971; Kotlyarevskaya Citation1976; Kutenkov Citation1991; Elmberg Citation2008).
In many amphibian species, the autumn hepatosomatic index reflects the conditions of the upcoming wintering. In populations from colder regions (in northern latitudes or at altitudes), it is higher than in animals from warmer regions (Shwarts & Ishchenko Citation1971; Chen & Lu Citation2011; Chen et al. Citation2013; Costanzo et al. Citation2013). However, the analysis of our and literature data on the moor frogs does not yet confirm this thesis. In the studied population, it is comparable to that in other regions. For example, in the population in the south of Western Siberia (54°N), where the maximum freeze tolerance of the moor frog was found to be −16°C (Berman et al. Citation2020), the hepatosomatic index is 8.5% (our unpublished data); in the most northeastern populations in Yakutia (60°N) – 9–10% (Sedalishchev et al. Citation1981); in the northwest of the range in Karelia (62°N) – 10.7% (Kutenkov Citation1991), and in the most northern Siberian populations on the Yamal Peninsula (67°N), hepatosomatic index was no higher than in the listed populations (Shwarts & Ishchenko Citation1971). By contrast, in another freeze tolerant species of ranid frogs (R. sylvatica), the geographic variability of the hepatosomatic index is accompanied by a parallel variability in the liver glycogen concentration and the freeze tolerance level (Costanzo et al. Citation2013). It can be assumed that the similarity of the hepatosomatic index in the moor frogs in the listed remote and climatically contrasting populations at latitudes 54–67°N probably indicates the absence of differences in freeze tolerance of individuals in them. For a final conclusion, studies of the hepatosomatic index and the glycogen content in the liver in the moor frog populations in regions that are much warmer in winter are needed to be carried out.
The liver is the main glycogen storage organ in amphibians (Feder & Burggren Citation1992). In the freeze tolerant frogs studied by us, the average glycogen content in the liver in autumn was not very high. It did not differ from the glycogen content in the liver of adults of non-freeze tolerant R. temporaria and P. esculentus, in which in different populations it varies from 11% to 16% of the liver weight before wintering (i.e. 110–160 mg/g of wet tissue) (Kato Citation1910; Bleibtreu Citation1911; Smith Citation1950; Pasanen & Koskela Citation1974). The total storage of glycogen in the liver before hibernation in adult moor frogs was several times greater than in juvenile ones (). However, when standardizing body weight (recalculated to a frog with a body weight of 100 g), the glycogen reserve in the liver did not differ between juvenile and adult individuals of the same sex, and in females it was significantly higher than in males (about 1500 mg in adult and juvenile females and 1000 mg in males). These values were 2–4 times higher than in non-freeze tolerant and water-wintering R. temporaria and P. esculentus (Kato Citation1910; Smith Citation1950).
The average glycogen content in the muscles of the moor frogs before hibernation was 4.4 times lower than in the liver. The ratio of glycogen content in tissues varies greatly in different frog species. For example, in the freeze tolerant R. sylvatica, the differences are more than 12 times in the southern populations (39–43°N), and almost 7 times in the northern populations (65°N); in the alpine Tibetan partially freeze tolerant Nanorana pleskei – by 4 times; in R. amurensis, N. parkeri and R. temporaria wintering in water – by 4.6, 7 and 8 times, respectively (Pasanen & Koskela Citation1974; Guzairova et al. Citation1977; Storey & Storey Citation1984; Costanzo et al. Citation2013; Niu et al. Citation2018, Citation2020). The total pre-winter glycogen reserve in the muscles of the moor frogs is large (). When recalculated per 100 g of body weight, it reached 850 mg in adult females, 645 mg in juvenile females, and 522–550 mg in males. Thus, the total storage of glycogen in muscles in the studied population reaches 43–57% of the storage in the liver. That is, muscles can be considered another (clearly underestimated) tissue that stores glycogen in wintering moor frogs.
A decrease in the content of glycogen in tissues of amphibians is observed even at near zero temperatures or already during freezing. It turns into cryoprotectants, the main ones of which are glucose, urea, glycerol (Storey & Storey Citation1986; Costanzo & Lee Citation1993; Voituron et al. Citation2009; Costanzo et al. Citation2015). After freezing, in the pooled sample of the moor frogs, the glycogen content in the liver decreased by more than 80%. When recalculated for a frog weighing 100 g, there were still no differences in the amount of stored glycogen between adults and juveniles of the same sex. The total storage of glycogen in adult and juvenile females was significantly higher (202–215 mg) than in males (37 mg in adults, 71 mg in juveniles). The average content of glycogen in muscles after freezing in all groups of animals decreased more than in the liver – to 2–4 mg/g of wet tissue (taking into account incomplete rehydration of muscles – even less). The total muscle reserve in a frog weighting 100 g was only 62–68 mg in adults and 84–90 mg in juveniles.
The decrease in the glycogen content in the liver upon freezing in the moor frog was more significant (by 5.2 times) than in the other frog species studied. For example, in the other freeze tolerant species of the ranid frogs, R. sylvatica, it decreases only 3 times (Costanzo et al. Citation2015); in partially freeze tolerant species, the glycogen consumption differs greatly – in Nanorana pleskei it also decreases 3 times, in N. parkeri, R. dybowskii, R. lessonae, and P. esculentus – only by 30–43%, and in non-cold resistant P. ridibundus it does not change at all (Voituron et al. Citation2005; Xiao et al. Citation2008; Niu et al. Citation2018, Citation2020).
After freezing, the degree of a decrease in the content of muscle glycogen also differs. In the moor frogs, the glycogen content decreased by 8.5 times, while it changed significantly less (by 30–50%) in R. sylvatica and in the partially freeze tolerant Nanorana pleskei, N. parkeri, R. lessonae, and P. esculentus (Voituron et al. Citation2005; Costanzo et al. Citation2015; Niu et al. Citation2018, Citation2020).
The main cryoprotectants in these species are different: in N. pleskei it is urea, in R. sylvatica – glucose and urea, in R. lessonae, P. esculentus, and R. dybowskii – glucose (Voituron et al. Citation2005; Xiao et al. Citation2008; Costanzo et al. Citation2013; Niu et al. Citation2018). For some tree frogs and Siberian salamanders, glycerol is known as the main or additional cryoprotectant (Berman et al. Citation1984; Layne & Jones Citation2001; Hirota et al. Citation2015; Shekhovtsov et al. Citation2021). It is noteworthy that the Siberian salamander, which has exclusively glycerol cryoprotection, is characterized by a significant (almost by 10 times) drop in the liver glycogen content after freezing (Berman et al. Citation1984; Shekhovtsov et al. Citation2021). Although in this study we did not determine the composition and amount of cryoprotectants, the high degree of glycogen consumption in both tissues during freezing suggests either high glucose levels or other cryoprotectants than in the ranid frogs studied so far.
Another reserve substance of amphibians is lipids. It is known that fat reserves in amphibians can be found in different tissues, as well as in the form of deposits under the skin; however, the main fat deposits are a pair of fat bodies in the abdominal cavity (Fitzpatick Citation1976; Wygoda Citation1987; Feder & Burggren Citation1992). In frog species of temperate latitudes wintering in water, the seasonal dynamics of the size of fat bodies and liver is synchronous – both organs have the maximum mass at the beginning of wintering (the mass of fat bodies in many species reaches 1% of body weight), the minimum – in the spring during the spawning period or immediately after it (Smith Citation1950; Pasanen & Koskela Citation1974; Schlaghecke & Blom Citation1978; Iela et al. Citation1979; Feder & Burggren Citation1992).
In the moor frogs, such large fat bodies were found in autumn only in juvenile animals, while in adults they were almost half as much ()). During laboratory acclimation to freezing, the fat bodies of juvenile animals decreased insignificantly (FBSI decreased by 10–40%), while in adults – by 4–5 times.
The lipid content in fat bodies is high in autumn. However, the mass of fat bodies was small, so the average total lipid content in them was low (). After acclimation to freezing, the lipid content in fat bodies dropped by 1.6–3.8 times in different groups, which, together with a decrease in the size of fat bodies, led to a decrease in the average total storage in them to 1–3 mg.
There is no consensus among researchers on the purpose of pre-winter stores in fat bodies. It is assumed that in some frog species they represent a reserve of energy for the general needs of individuals, in others – they are used for oogenesis in females or for maintaining the activity of males during the breeding season, and in addition, they are consumed differently in adults and juveniles (Pasanen & Koskela Citation1974; Schlaghecke & Blom Citation1978; Tattersall & Ultsch Citation2008). In the Karelian population, where the moor frogs also hibernate on land, the fat body index in autumn in the sample of adults and juveniles is about 0.75% (i.e., almost did not differ from the Siberian ones), and after wintering – about 0.1% (Kutenkov Citation1991). In boreal Sweden, where R. arvalis hibernate for 7 months in water bodies and maintain a low level of activity, fat bodies remain in spring even after breeding (FBSI = 0.08–0.11%) (Elmberg Citation2008). In freeze tolerant R. sylvatica, at the end of summer, large individuals showed the same FBSI as in adults in our study (0.5%). However, unlike the moor frogs, in the wood frogs from both southern and northern populations, almost all of the fat bodies is catabolized during preparation for wintering (Costanzo et al. Citation2013, Citation2015).
The lipid content in the liver of the moor frog in autumn was 11 times less than in the fat bodies. However, taking into account the greater mass of the organ, the total lipid content in the liver was comparable to that in the fat bodies (). We did not determine the lipid content in muscle tissue, but in other frog species (R. temporaria, R. dybowskii, R. amurensis), in autumn, it does not exceed that in the liver (our unpublished data). Taking into account the muscle mass (20–35% of the total body weight), the autumn lipid storage in the muscles of the moor frogs may be approximately the same as in the liver or slightly more.
The total reserves of lipids in the liver and fat bodies in autumn, calculated for a frog weighing 100 g, were 267–317 mg in adult animals, and 520–659 mg in juveniles (i.e., 2 times more). During preparation for wintering, they decreased by 88% in adult females, by 80% in males, and by 50–65% in juvenile animals. It is obvious that animals of different ages use fat reserves in different ways: the lipid reserve before hibernation is higher in juveniles and their consumption is less than in adult animals. During wintering with free access to oxygen (in aerated water or on land in an unfrozen state), fats are an energetically more “profitable” substrate, producing more than twice as much energy per unit mass as carbohydrates or proteins (Pasanen & Koskela Citation1974; Tattersall & Ultsch Citation2008). A reduction in fat body mass and a decrease in lipid content in them and in the liver during pre-winter preparation support the conclusion that frogs are likely to catabolize lipids first, rather than carbohydrates, before freezing (Storey & Storey Citation1986; Sinclair et al. Citation2013). From the present study, it follows that even after 60–70 days of staying at low positive temperatures without food, the moor frog does not consume the entire available lipid reserve in the body. It cannot be ruled out that the fat bodies of the moor frogs, unlike in many other Eurasian species of frogs, reach their maximum development not by autumn, but much earlier, and are spent at the end of summer for gametogenesis and the general needs of animals, and the autumn mass of fat bodies and the concentration of lipids in them are residual. Thus, lipids probably do not play an important role in the pre-winter metabolism and freeze tolerance of R. arvalis, and remain an important resource for the spring season.
Conclusions
The first comprehensive study of the amount of stored reserve substances in freeze tolerant individuals of R. arvalis allows us to draw the following main conclusions.
The moor frog has the largest liver mass relative to body weight among the studied species of Eurasian frogs. In the Siberian population, the hepatosamatic index is high in both adults and juvenile animals. Its average value reaches almost 10% of body weight, i.e. 2–4 times more than in species wintering in water. The data obtained by us and data available in the literature do not yet reveal the geographic variability of the pre-winter hepatosomatic index in the moor frogs in remote and climatically contrasting populations in the latitude range of 54–67°N. Probably, this may indicate the similarity of the freeze tolerance of individuals in them, but for a final conclusion, it is necessary to analyze the mass of the liver and the content of glycogen in it in regions that are much warmer in winter.
The concentration of glycogen in the liver of freeze tolerant moor frog in autumn did not differ from that of frog species avoiding freezing temperatures. However, due to the large liver mass and lower body weight, the pre-winter reserve of hepatic glycogen is 2–4 times higher than in species with the same body weight but not freeze tolerant and wintering in water. The concentration of glycogen in the muscles of the moor frog is several times less than in the liver. However, due to the greater mass of muscles relative to the mass of the liver, the glycogen reserve in them was only half as much as in the liver. Thus, muscle tissue can be considered another glycogen depot in the moor frog. The degree of the glycogen concentration decrease both in the liver and the muscles during freezing was significantly higher than even in the other freeze tolerant species of ranid frogs, the wood frog. In this study, we did not determine the composition and amount of cryoprotectants, but the high degree of glycogen catabolism in both tissues during freezing may indicate higher levels of glucose or other cryoprotectants than in the ranid frogs studied so far.
In autumn, the lipid content in fat bodies was significantly higher than in the liver. However, due to the differences in the masses of these organs, the total lipid content in them turned out to be comparable. During wintering preparation, the lipid reserves decreased, but did not disappear completely. Probably, lipids play an insignificant role in the pre-winter metabolism, and those remaining from autumn are needed to ensure vital activity after wintering.
Thus, the freeze tolerance of the moor frogs, which is outstanding among the Eurasian ranid frogs, is provided by some morphophysiological features, the main of which are: a high relative mass of the liver, which provides a large supply of glycogen before hibernation; the participation of muscle tissue in the deposition of a significant amount of glycogen; significant consumption of glycogen during freezing for the production of cryoprotectants. In addition, the present study indicates that the patterns of storage and consumption of prewinter energy resources differ greatly in ranid frogs not only between terrestrial and aquatic hibernators, but also between freeze tolerant species.
Acknowledgements
We thank Daniil I. Berman for providing constructive comments on the work and manuscript. We thank Sergey Shekhovtsov for aiding with frog collection, Sergey Kiselev and Ekaterina Meshcheryakova for methodical aiding.
Disclosure statement
No potential conflict of interest was reported by the author(s).
Additional information
Funding
References
- Berman DI, Bulakhova NA, Meshcheryakova EN, Shekhovtsov SV. 2020. Overwintering and cold tolerance in the moor frog (Rana arvalis) across its range. Canadian Journal of Zoology 98:705–714. DOI: 10.1139/cjz-2019-0179.
- Berman DI, Leirikh AN, Mikhailova EI. 1984. Wintering of the Siberian salamander Hynobius keyserlingi in the Upper Kolyma. Journal of Evolutionary Biochemistry and Physiology 20(3):323–327.
- Bleibtreu M. 1911. Weitere untersuchungen uber das verhalten des glykogens im eierstock der Rana fusca. Pflügers Archiv European Journal of Physiology 141(4–7):328–342. DOI: 10.1007/BF01689701.
- Canal J, Delattre J, Girard ML. 1972. Acquisitions nouvelles dans le dosage des lipides totaux du serum: description d'une methode nephelemetrique. Part 1. Technique manuelle. Annales de Biologie Clinique 30:325–332.
- Chen W, Guan T, Ren L, He D, Wang Y, Lu X. 2015. Prehibernation energy storage in Heilongjiang brown frogs (Rana amurensis) from five populations in North China. Asian Herpetological Research 6(1):45–50. DOI: 10.16373/j.cnki.ahr.140036.
- Chen W, Lu X. 2011. Sex recognition and mate choice in male Rana kukunoris. Herpetological Journal 21:141–144.
- Chen W, Wang X, Fan X. 2013. Do anurans living in higher altitudes have higher pre-hibernation energy storage? Investigations from a high-altitude frog. Herpetological Journal 23:45–49.
- Costanzo JP, Amaral MCF, Rosendale AJ, Lee RE Jr. 2013. Hibernation physiology, freezing adaptation and extreme freeze tolerance in a northern population of the wood frog. Journal of Experimental Biology 216:3461–3473. DOI: 10.1242/jeb.089342.
- Costanzo JP, Lee RE. 1993. Cryoprotectant production capacity of the freeze-tolerant wood frog, Rana sylvatica. Canadian Journal of Zoology 71:71–75. DOI: 10.1139/z93-011.
- Costanzo JP, Reynolds AM, do Amaral MCF, Rosendale AJ, Lee RE. 2015. Cryoprotectants and extreme freeze tolerance in a subarctic population of the wood frog. PLoS One 10(2):e0117234. DOI: 10.1371/journal.pone.0117234.
- do Amaral MCF, Lee RE Jr, Costanzo JP. 2016. Enzymatic regulation of seasonal glycogen cycling in the freeze-tolerant wood frog, Rana sylvatica. Journal of Comparative Physiology B 186:1045–1058. DOI: 10.1007/s00360-016-1012-2.
- Elmberg J. 2008. Ecology and life history of the moor frog Rana arvalis in boreal Sweden. In: Glandt D, Jehle R, editors. Der Moorfrosch / The Moor frog. Zeitschrift für Feldherpetologie. pp. 179–194.
- Feder ME, Burggren WW. 1992. Environmental physiology of the amphibians. Chicago: University of Chicago Press.
- Fitzpatrick LC. 1976. Life history patterns of storage and utilization of lipids for energy in amphibians. American Zoologist 16(4):725–732.
- Glandt D. 2008. Der Moorfrosch (Rana arvalis): Erscheinungsvielfalt, Verbreitung, Lebensräume, Verhalten sowie Perspektiven für den Artenschutz. In: Glandt D, Jehle R, editors. Der Moorfrosch / The Moor frog. Zeitschrift für Feldherpetologie, Supplement, pp. 11–34.
- Guzairova SK, Naumov YS, Solomonova TN, Tomshina AA. 1977. On the content of ascorbic acid and glycogen in the organs of the Siberian frog. In: Solomonov NG, editor. Ecological and physiological adaptations of animals and man to the conditions of the North. Yakutsk: Institute of Biology Press. pp. 93–95.
- Hirota A, Takiya Y, Sakamoto J, Shiojiri N, Suzuki M, Tanaka S, Okada R. 2015. Molecular cloning of cDNA encoding an aquaglyceroporin, AQP-h9, in the Japanese tree frog, Hyla japonica: possible roles of AQP-h9 in freeze tolerance. Zoological Science 32(3):296–306. DOI: 10.2108/zs140246.
- Iela L, Milone M, Filomena M, Rakesh C, Rastogi K, Chieffi G. 1979. Role of lipids in the physiology of the testis of Rana esculenta: Annual changes in the lipid and protein content of the liver, fat body, testis and plasma. Bollettino di Zoologia 46(1–2):11–16. DOI: 10.1080/11250007909440272.
- Kato K. 1910. Uber das verhalten des glykogenes im eierstocke der frosche zu den verschiedenen jahreszeiten. Pflügers Archiv European Journal of Physiology 132:545–579. DOI: 10.1007/BF01683638.
- Kotlyarevskaya VA. 1976. Amphibians and reptiles of the Kulunda steppe. Protection and transformation of the nature of the forest-steppe of Western Siberia. Novosibirsk: Nauka. pp. 229–241.
- Krasavtsev BA. 1939. Materials on the ecology of the moor frog (Rana terrestris Andrz). Ecology and biocenology issues. Vol. 4. Leningrad: Leningrad State University Press. pp. 253–267.
- Kushniruk VA. 1964. On wintering of some amphibians in the western regions of Ukraine. Proceeding of the 3rd All-Union Herpetological Conference, Leningrad. pp. 37–38.
- Kutenkov AP. 1991. Dynamics of liver, fat bodies and gonads in common (Rana temporaria) and moor (R. arvalis) frogs // Ecology of terrestrial vertebrates. Petrozavodsk 6:14–24.
- Layne JR Jr, Jones AL. 2001. Freeze tolerance in the gray tree frog: cryoprotectant mobilization and organ dehydration. Journal of Experimental Zoology 290(1):1–5. DOI: 10.1002/jez.1030.
- Loumbourdis NS, Kyriakopoulou-Sklavounou P. 1991. Reproductive and lipid cycles in the male frog Rana ridibunda in northern Greece. Comparative Biochemistry and Physiology 99A(4):577–583. DOI: 10.1016/0300-9629(91)90133-W.
- Matkovskiy AV, Starikov VP. 2011. The ecological aspects of amphibians reproduction in the north of Western Siberia. Bulletin of the Samara Scientific Center RAS 13(1(5)):1130–1132.
- Naumov YS. 1981. Ecological and physiological study of populations of the Siberian frog (Rana amurensis Boul., 1886) in the north of its range. Ph.D. thesis. Institute of Plant and Animal Ecology, UB RAS, Yekaterinburg.
- Niu Y, Cao W, Storey KB, He J, Wang J, Zhang T, Tang X, Chen Q. 2020. Metabolic characteristics of overwintering by the high-altitude dwelling Xizang plateau frog, Nanorana parkeri. Journal of Comparative Physiology B 190:433–444. DOI: 10.1007/s00360-020-01275-4.
- Niu Y, Wang J, Men S, Zhao Y, Lu S, Tang X, Chen Q. 2018. Urea and plasma ice-nucleating proteins promoted the modest freeze tolerance in Pleske’s high altitude frog Nanorana pleskei. Journal of Comparative Physiology B 188:599–610. DOI: 10.1007/s00360-018-1159-0.
- Pasanen S, Koskela P. 1974. Seasonal and age variation in the metabolism of the common frog, Rana temporaria L, in northern Finland. Comparative Biochemistry and Physiology A 47(2):635–654. DOI: 10.1016/0300-9629(74)90027-9.
- Schlaghecke R, Blom V. 1978. Seasonal variations in fat body metabolism of the green frog Rana esculenta (L.). Experientia 34:456–457. DOI: 10.1007/BF01915320.
- Sedalishchev VT, Belimov GT, Bekeneva GN. 1981. Some morphophysiological adaptations of the moor frog (Rana arvalis) in southern Yakutia. Proceeding of the 5 All-Union Herpetological Conference, Leningrad. pp. 122–123.
- Sedalishchev VT, Odnokurtsev VA. 2017. Ecological features of the moor frog (Rana arvalis Nilson, 1842) in south-western Yakutia. Biological Sciences of Kazakhstan 3:70–78.
- Severin SE, Solovyeva GA. 1989. Praktikum po biohimii. Moscow: MSU.
- Shekhovtsov SV, Bulakhova NA, Tsentalovich YP, Zelentsova EA, Meshcheryakova EN, Poluboyarova TV, Berman DI. 2021. Biochemical response to freezing in the Siberian salamander Salamandrella keyserlingii. Biology 10(11):1172. DOI: 10.3390/biology10111172.
- Shwarts SS, Ishchenko VG. 1971. Puti prisposobleniya nazemnyh pozvonochnyh zhivotnyh k usloviyam sushchestvovaniya v Subarktike. T. 3. Zemnovodnye. Sverdlovsk: IPAE URO RAN.
- Sinclair BJ, Stinziano JR, Williams CM, MacMillan HA, Marshall KE, Storey KB. 2013. Real-time measurement of metabolic rate during freezing and thawing of the wood frog, Rana sylvatica: Implications for overwinter energy use. Journal of Experimental Biology 216:292–302. DOI: 10.1242/jeb.076331.
- Smith CL. 1950. Seasonal changes in blood sugar, fat bodies, liver glycogen and gonads in the common frog (Rana temporaria). Journal of Experimental Biology 26(4):412–429. DOI: 10.1242/jeb.26.4.412.
- Storey KB, Storey JM. 1984. Biochemical adaptation for freezing tolerance in the wood frog, Rana sylvatica. Comparative Biochemistry and Physiology B 155:29–36. DOI: 10.1007/BF00688788.
- Storey KB, Storey JM. 1986. Freeze tolerance and intolerance as strategies of winter survival in terrestrially-hibernating amphibians. Comparative Biochemistry and Physiology A 83:613–617. DOI: 10.1016/0300-9629(86)90699-7.
- Tarnoky K, Nagy S. 1963. Spectrophotometric determination of glycogen with o-toluidine. Clinica Chimica Acta 8:627–628. DOI: 10.1016/0009-8981(63)90116-5.
- Tattersall GJ, Ultsch GR. 2008. Physiological ecology of aquatic overwintering in ranid frogs. Biological Reviews 83:119–140. DOI: 10.1111/j.1469-185X.2008.00035.x.
- Terentyev PV. 1950. Frog. Moscow: Sovetskaya Nauka.
- van der Lugt A, Slagboom R. 2016. Heikikkers in het veenweidegebied. RAVON 63(4):77–79.
- Voituron Y, Barre H, Ramlov H, Douady CJ. 2009. Freeze tolerance evolution among anurans: Frequency and timing of appearance. Cryobiology 58:241–247. DOI: 10.1016/j.cryobiol.2009.01.001.
- Voituron Y, Joly P, Eugène M, Bareé H. 2005. Freezing tolerance of the European water frogs: The good, the bad, and the ugly. American Journal of Physiology - Regulatory, Integrative and Comparative Physiology 288:1563–1570. DOI: 10.1152/ajpregu.00711.2004.
- Wind-Larsen H, Jørgensen CB. 1987. Hormonal control of seasonal growth in a temperate zone toad Bufo bufo. Acta zoologica 68(1):49–56. DOI: 10.1111/j.1463-6395.1987.tb00875.x.
- Wygoda ML. 1987. Cutaneous and subcutaneous adipose tissue in anuran amphibians. Copeia 1987(4):1031–1035. DOI: 10.2307/1445569.
- Xiao X, Zheng D, Yang C, Chai L. 2008. Survival and metabolic responses to freezing temperature in the northeast forest frog Rana dybowskii. Asiatic Herpetological Research 11:147–152.