
 ?Mathematical formulae have been encoded as MathML and are displayed in this HTML version using MathJax in order to improve their display. Uncheck the box to turn MathJax off. This feature requires Javascript. Click on a formula to zoom.
ABSTRACT
Ride-sharing services have been popularly used for both short-distance and long-distance trips. The recent introduction and growth of bike-sharing services can help solve the last mile problem and provide a good mobility option, especially for short-distance travellers. We examine the extent to which bike-sharing platforms solve the last mile problem and affect short-distance travels by studying their impacts on ride-sharing orders. To do so, we exploit a natural experiment setting in which bike-sharing platforms were newly launched in Chengdu, China. We combine detailed granular one-month order data collected from DiDi with Chengdu’s geographic information data from Gaode Map, a Chinese leading map provider. We find that the introduction of bike-sharing platforms significantly reduces short-distance ride-sharing orders. We additionally examine the heterogeneity in substitution effects across different pickup and drop-off locations and find that location attributes significantly affect bike-sharing’s substitution effects on ride-sharing platforms.
1. Introduction
The introduction and growth of ride-sharing platforms, including Uber, DiDi, and Lyft, have brought significant changes in how people commute and travel in major cities. By providing convenient real-time app-based services to both drivers and passengers, ride-sharing platforms reduce transaction costs on both sides of the platform (Bakos, Citation1997; Brynjolfsson, Hu, & Simester, Citation2011). On the driver side, car owners can easily register as a full-time or a part-time driver to earn income with flexible scheduling. At the same time, passengers can benefit from the convenience, speed, and competitive pricing that platforms provide. As a result, the ride-sharing market has dramatically expanded, with DiDi attracting over 100 million monthly users and Uber attracting 40 million monthly users in 2017 (Armstrong, Citation2017).
However, concerns have been raised about the negative effects of ride-sharing services on the transport landscape. Recent studies and surveys suggest that the increased usage of ride-sharing services actually exacerbate traffic congestion and air pollution in cities by drawing people away from other transportation options, such as public transit, biking, and walking (Leblanc, Citation2018). Furthermore, utilising ride-sharing services may be a less-attractive option in the presence of traffic congestion, a longer wait time during high demand hours, and high and unpredictable fares due to dynamic pricing. Public transit, a viable alternative solution in such circumstances, often suffers from what is known as the last mile problem. The last mile problem refers to how commuters and travellers find it difficult to reach their final destination from a transportation hub such as subway, bus, and railway stations.
Bike-sharing platforms can help solve the last mile problem and provide a good mobility option, especially for short-distance travellers. With the average bike speed reaching up to 20 km/h (12.4 mph), bikes can be an effective means of transportation (Schuijbroek, Hampshire, & Hoeve, Citation2017). The launch and success of bike-sharing platforms allow users to easily rent and return a bike. Bike-sharing users have a flexible access to well-maintained bikes at a relatively low price, and users do not bear the cost of purchasing, storing, and maintaining a personal bike (Leblanc, Citation2018).Footnote1 In recent years, the bike-sharing market has witnessed a remarkable growth, with 2.3 million shared bikes in circulation worldwide in 2016 (Bernard, Citation2018). In 2013, there were only 700,000 shared bikes in circulation. The most rapid growth took place in China. In China, there are 400 million registered bike-sharing users, and the daily number of riders has reached 70 million (Bian & Hong, Citation2018).
In this paper, we explore how the introduction of bike-sharing platforms affects how people commute and travel. We examine the extent to which bike-sharing platforms solve the last mile problem and affect short-distance travel by studying their impacts on ride-sharing orders. Bike-sharing can enhance connectivity to public transit and have a substitution effect on ride-sharing for short-distance trips, which would lead to a decline in short-distance ride-sharing orders. We additionally analyse how the effects of bike-sharing platforms on ride-sharing orders vary across location characteristics. To address our research questions, we exploit a natural experimental setting in which bike-sharing platforms were newly launched in Chengdu, the capital of China’s Sichuan province. We use detailed granular one-month order data collected from DiDi in Chengdu in November 2016. We observe DiDi order data before and after the launch of bike-sharing platforms because bike-sharing platforms were introduced in the middle of the month. We additionally combine DiDi order data with Chengdu’s geographic information data from Gaode Map, a Chinese top map and navigation services provider.
We first use a regression discontinuity design (RDD) approach to exploit the natural experimental setting and explore the overall substitution effects of bike-sharing on the ride-sharing platform. Overall, we find that the introduction of bike-sharing platforms significantly reduces short-ride sharing orders. For example, after the launch of the first bike-sharing service on November 10, the number of pickup orders with order distance between one and two miles decreased by 0.0681 (significant at 1%). After we combined rich granular ride-sharing order data with Chengdu’s geographic data, we examined the heterogeneity in the substitution effect across different pickup and drop-off locations. We found that in several locations, there was a reduced demand for ride-sharing services after the launch of bike-sharing services. For example, after the launch of the first bike-sharing platform, the number of passengers who were picked up from bus stations decreased by 0.0426 (significant at 5%) for orders with distance between one and two miles. Especially for short-distance trips, people used bike-sharing services as a substitute for ride-sharing services.
2. Literature review
2.1. Sharing economy
The concept of the sharing economy was first introduced by Lawrence Lessig at Harvard Law School in 2008 (Kim, Yoon, & Zo, Citation2015). The sharing economy is based on the “access to” rather than the “ownership of” a physical and human assets (Botsman & Rogers, Citation2011). People lend and borrow assets, rather than purchasing and owning their own assets. In recent years, we have witnessed a remarkable growth of the sharing economy in goods and services. The economic impact of the sharing economy on incumbent firms has been studied in several different contexts (Zervas, Proserpio, & Byers, Citation2017). Seign and Bogenberger (Citation2012) find relative advantages of car-sharing compared to owning a car and not sharing a car. Such findings may be applicable to other transportation modes such as bike-sharing services. Sharing economy services allow people to share their resources in innovative ways (Cohen & Kietzmann, Citation2014). For instance, people can have access to rooms (AirBnB, Roomorama), taxi services (Uber, Lyft), and cars and bikes (Relay Rides, Wheelz) (Malhotra & Alstyne, Citation2014). The sharing economy can help save time, save money, and provide autonomy without any ownership duties (Seign & Bogenberger, Citation2012). This paper contributes to the growing literature on the sharing economy (Cheng, Citation2016). Previous literature has mostly focused on examining the effects of the sharing economy on existing industry. This paper is novel in examining and quantifying the extent to which one type of sharing economy services affects a different type of sharing economy service.
2.2. Geographic features in city transportation
As cities grow, different functional regions, such as commercial areas, educational areas, and workplaces, are developed. Cities become concentrated areas of human activities, and intra-urban mobility is a dominant feature of a city life. Intra-urban mobility patterns can be driven by social factors, such as gender and occupation (Sang, O’Kelly, & Kwan, Citation2010). The prior literature has examined how the demand for motor vehicles differs across geographical areas with different functions (Ge et al., Citation2010; Liu, Zheng, Chawla, Yuan, & Xing, Citation2011). Bike-sharing bikes, an important mode of transportation in some cities, also generate demand that varies across geographical areas (Kaltenbrunner, Meza, Grivolla, Codina, & Banchs, Citation2010). To our knowledge, few works have examined the relationship between the demand for both motor vehicle and bike-sharing bikes, and how the relationship is affected by geographic features.
3. Data
3.1. Data context
DiDi, founded in 2012, originally began with its traditional taxi-hailing services. Currently, DiDi provides a wide variety of services including ride-sharing, taxi-hailing, on-demand bus, and designated driver. DiDi serves more than 450 million users across over 400 cities in China (Jie, Citation2018). We employ data on Chengdu’s DiDi Kuaiche services, ride-sharing services that match full-time or part-time drivers to riders. In May 2015, the ride-sharing service DiDi Kuaiche was launched simultaneously in eight major Chinese cities: Beijing, Chengdu, Chongqing, Guangzhou, Hangzhou, Shenzhen, Tianjin, and Wuhan. Any private car owners can become a full-time or part-time DiDi Kuaiche driver after they pass initial screenings.
Chengdu, the provincial capital and the largest city of Sichuan province, is a populous central city with popular tourist attractions. As the demand for taxi services has been originally high in Chengdu, the introduction of DiDi Kuaiche has been met with a huge success. Compared to traditional taxis, DiDi Kuaiche offers a more convenient and affordable means of transportation. Our research observation period is 18 months after the launch of DiDi Kuaiche ride-sharing services. By then, the ride-sharing platform has matured, with the number of DiDi users continuing to grow gradually. According to the official report released by DiDi, in the third quarter of 2016, the number of daily ride-sharing orders in Chengdu reached 240,000 (DiDi Research Institute and CBNData, Citation2016). The report indicates that Chengdu is the second largest market among all Chinese cities, with Chengdu generating slightly fewer orders than Beijing, the largest market. Other reports consistently support the success of DiDi in Chengdu. During our observation period, Chengdu ranked the first in total miles travelled by DiDi drivers (Zeng, Citation2016), and the penetration rate of DiDi app in Chengdu reached 60%, ranking Chengdu the first in the western part of China (Zeng, Citation2016). Many commuters and travellers in Chengdu rely extensively on DiDi for their daily transportation.
Bike-sharing is a growing and more recent segment of the sharing economy. Bike-sharing platforms aim to solve the last mile problem and distinguish themselves from ride-sharing platforms by offering convenient short-distance vehicles. Starting in April 2016, bike-sharing services were initially launched in a few large Chinese cities. After initial launches were found to be successful, several different bike-sharing companies emerged and expanded to other large cities as the competition intensified. Chengdu, as one of the largest cities in China with a high population and high number of tourists and plain terrain, had a great potential for bike-sharing markets.
On November 10 2016, a local bike-sharing company YiBuDanChe launched the first bike-sharing bikes in Chengdu. YiBuDanChe released thousands of bike-sharing bikes, and the number of users reached more than 2,000 on the first day of the launch. Six days later, on November 16, another bike-sharing company Youon entered the Chengdu market. On November 17 2016, a third bike-sharing platform, Mobike, was launched. The introduction of bike-sharing platforms provides us a unique opportunity to examine the effects of bike-sharing by exploiting a series of natural experiment settings.
3.2. Data description
To examine the effects of bike-sharing platforms on ride-sharing platforms, we combine two major datasets: detailed order data from DiDi, a Chinese ride-sharing platform, and the geographic information data from Gaode Map, a Chinese map and navigation service provider.
3.2.1. Ride-sharing platform order-level data
We use granular order-level data from DiDi, and the data period covers from November 1 2016 to November 30 2016. The order data contain information on order ID, pickup location, drop-off location, pickup time, and arrival time at drop-off location ().
Table 1. Ride-sharing platform order-level data.
Our data include 6,090,049 total orders. We calculate order distance as a linear distance between a pickup location and a drop-off location. The average daily number of orders is 203,002 with a standard deviation of 11,384. The average order distance is 6.428 miles with a standard deviation of 4.73. The average daily number of orders with order distance less than 1 mile is 2,517 with a standard deviation of 196. The average daily number of orders with order distance less than 2 miles is 19,568 with a standard deviation of 1,232. For order distance less than 3 miles, the mean is 45,478 with a standard deviation of 2,803.
3.2.2. Geographic data
The order data reveal that orders originate from diverse geographic locations in Chengdu, including downtown and suburban areas. In this paper, we focus our analysis on the central areas of Chengdu, where more than 90% of ride-sharing orders are generated ().
Figure 1. Geographic area of research.
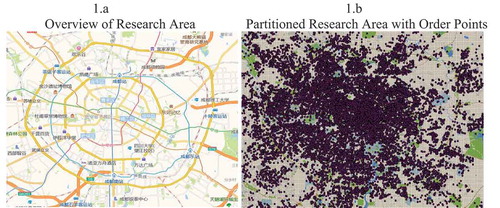
To further investigate pickup and drop-off locations of each order, we utilised high-precision maps from Gaode Map. The central areas of Chengdu encompass about 21 km in latitude and 17.8 km in longitude. We partitioned the areas into 150 by 150 grids, which constitute 22,500 total grids. Each grid covers about 140 m in latitude 119 m in longitude. These grids constitute our basic geographic unit of analysis. From Gaode Map, we collected and labelled the location characteristics of each grid. More specifically, we examined and recorded whether each grid contains the following 24 location attributes, including public transportation, education facilities, commerce, and workplaces (see for the complete list).
Table 2. Aggregate effect of bike-sharing on pickup locations.
Table 3. Aggregate effect of bike-sharing on drop-off locations.
Table 4. The description of location attribute covariates.
Finally, we use spatial methods to match the locations of each order to the map, thus combining detailed order-level information with its drop-off and pickup points’ geographic information.
4. Model-free evidence
Before using econometric models to quantify the effects of bike-sharing on ride-sharing orders, we examine how the number of DiDi orders changes before and after the introduction of bike-sharing platforms. plots the number of total orders from November 1 2016 to November 30 2016. The three vertical dotted lines in the figure indicate the dates on which bike-sharing platforms were newly introductions in Chengdu. The first, second, and third vertical lines represent the launch of YiBuDanChe on November 10, the launch of Youon on November 16, and the launch of Mobike on November 17, respectively.
Figure 2. Total number of DiDi orders.
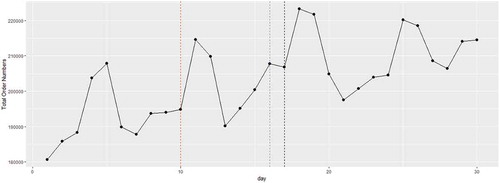
reveals that the total number of DiDi’s ride-sharing orders has increased in November. The total number of orders was 180,668 on November 1 and 214,451 on November 30. The figure also shows a weekly pattern where the number of orders is higher on Fridays and Saturdays. The figure, however, does not reveal noticeable changes in the total number of orders before and after three treatments.
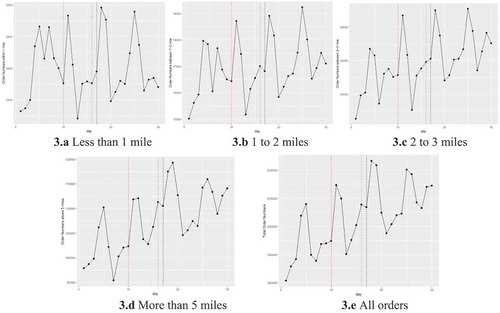
To examine how the effects of the introduction of bike-sharing platforms differ across short-distance and long-distance orders, we separately plot the total number of orders for 1) orders with distance less than one mile, 2) orders with distance between one and two miles, 3) orders with distance between two and three miles, and 4) orders with distance more than five miles. From , we find that the plot of orders with order distance less than one mile does not show a clear overall increasing trend across the time period. The plot of orders with order distance between one and two miles shows a slightly increasing trend. Such an increasing trend is more evident for orders with order distance between two and three miles, but the increasing trend is not as obvious as the trend revealed in the plot of total orders (). The comparison of reveals that the number of orders with order distance greater than five miles follows a trend that is similar to the trend followed by the total number of orders. Such a comparison suggests that the introduction of bike-sharing bikes does not affect long-distance trips with distance greater than five miles. The similarity in trends allows us to use the number of orders with distance greater than five miles as a suitable control variable, and the validity of the control variable will be further discussed in the following subsection.
Figure 3. The number of orders for orders with different distances.
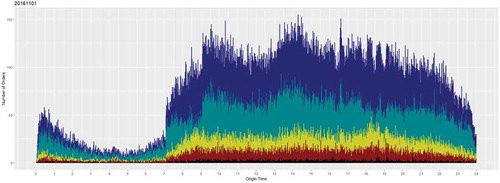
To examine how the number of orders changes across a day, plots the number of orders placed on November 1 across the pickup time. The figure shows that the number of orders with distance greater than five miles constitutes about half of the total orders, and it reveals a trend similar to the trend revealed by the total number of orders. Additionally, data summary statistics indicate that the first quartile of order distance distribution is approximately three miles. Orders with distance less than two miles constitute approximately 10% of the total orders, and orders with distance less than one mile constitute a relatively small share of 1.2%.
Figure 4. Number of orders across the day.
Based on the model-free evidence, we primarily focus our analysis on the orders with order distance less than three miles to explore the substitution effects of bike-sharing on ride-sharing orders. As the substitution effects tend to fade as order distances increase, we separately estimate the effects of bike-sharing on ride-sharing orders with distance less than one mile, less than two miles, and less than three miles.
5. Effects of bike-sharing platform introduction
We now empirically examine whether the introduction of bike-sharing platforms reduces short-distance ride-sharing orders. We use an RDD to estimate the impact of bike-sharing platforms on the number of ride-sharing orders with three different order distances: less than one mile, between one mile and two miles, and between two to three miles. The RDD approach is commonly used to estimate the causal effect of a treatment when the treatment is determined by an exogenous assignment variable to a cut-off point (Lee & Lemieuxa, Citation2010). Our treatment is the introduction of sharing-bike, which will be denoted by the variable AfterSharingBiket, and the treatment assignment will be denoted by the variable Dayt.
Our empirical model is given by
where the outcome variable Pick-upit measures the number of orders with a pickup location in grid i on day t and the variable Drop-offit measures the number of orders with a drop-off location in grid i on day t. The model is separately estimated for orders with order distance less than one mile, orders with distance between one and two miles, and orders with distance between two and three miles. The variables >5milesPickupit and >5milesDropoffit measure the number of pickups and drop-offs in grid i on day t with order distance greater than five miles. We use them as control variables for the following reasons. First, during our observation period, DiDi platform continued to grow gradually, which induced the number of orders to continue to increase even with treatments. From the model-free evidence, we find that the trend of total number of orders is similar to the trend of the number of orders with distance greater than five miles ( and ). Therefore, the variables are included to control for such an overall trend. Additionally, according to a report issued by a large bike-sharing company in China, 87.2% of bike-sharing users use the platform for trips less than three miles, and 99.9% of the users use the platform for trips less than five miles. Such a finding suggests that ride-sharing orders with distance greater than five miles are less likely to be affected by the introduction of bike-sharing services, which makes >5milesPickupit and >5milesDropoffit valid control variables (Wo, Citation2017). The variable AfterSharingBiket equals 1 for day t after the introduction of bike-sharing. The variable is a running variable, which represents time, measured in days, relative to the bike-sharing platform introduction date. The coefficients of interest are β and β’, which measure the effect of bike-sharing platform introduction on the number of DiDi orders.
We treat introductions of three different bike-sharing services as three independent treatments and use the RDD model to separately estimate their effects. Equation (1) and Equation (2) share the same independent variables, have cross-equation restrictions, and have error terms that are correlated. Therefore, we use Seemingly Unrelated Regression (SUR) estimation to estimate two equations together (Srivastava & Dwivedi, Citation1979). presents the results where the dependent variables measure the number of pickups, and presents the results where the dependent variables measure the number of drop-offs.
presents model estimates on the effects of the introduction of three different bike-sharing services on DiDi pickup locations. The first bike-sharing service, launched on November 10, has the most statistically significant effect on reducing ride-sharing pickups. It significantly reduces the number of pickup orders with distance less than one mile, distance between one and two miles, and distance between two and three miles by 0.0165 (significant at 1%), 0.0681 (significant at 1%), and 0.0673 (significant at 1%) respectively. The magnitude of the effect is the largest for orders with distance between one and two miles, and the effect slightly decreases for orders with distance between two and three miles. The introduction of the second bike-sharing company does not have a statistically significant effect on DiDi pickups with order distance less than one mile. However, for orders with distance between one and two miles, orders decrease by 0.0212 (significant at 10%). The number of orders with distance between two and three miles decreases by 0.0358 (significant at 5%). Such findings can suggest that the bike-sharing market has not fully saturated after the introduction of the first bike-sharing service. In fact, such a hypothesis is consistent with the fact that the first launch was relatively small in scale compared to the two other launches that followed. Under the unsaturated market condition, the demand for bike-sharing services may be tiered where the bike demand for short-distance trips is first satisfied and the bike demand for longer-distance trips is satisfied afterwards. After the launch of the third bike-sharing company, there is no statistically significant effect on ride-sharing pickups for the three distance measures we considered. This may be consistent with the hypothesis that the market for bike-sharing bikes has saturated as a result of a large-scale bike launches induced by the second company.
presents model estimates on the effects of the introduction of three different bike-sharing services on DiDi drop-off locations. Compared to the effects on pickup locations, the effects on drop-off locations are not as significant. The introduction of the first bike-sharing service has a statistically significant negative effect on the number of drop-offs. The introduction of the first bike-sharing service decreases ride-sharing orders with distance less than one mile by 0.0149 (significant at 1%). After the launch of the first bike-sharing company, orders with distance between one and two miles decrease by 0.0574 (significant at 5%). Orders with distance between two and three miles decrease by 0.0521, and the effect is not statistically significant. After the introduction of the second bike-sharing companies, the reduction in orders is the largest for orders with distance between two and three miles, followed by orders with distance between one and two miles, followed by orders with distance less than one mile. However, the estimates are not statistically significant. After the introduction of the third bike-sharing companies, there are no statistically significant effects on ride-sharing orders.
We posit that the overall difference between the effects on pickup locations and the effects on drop-off locations may be due to the concentration on passengers’ pickup locations and decentralisation on their drop-off locations. Passengers are more likely to be picked up from a centralised place where it is easier to find a driver or more convenient for subsequent trips. However, when passengers are on route to their destination, they would likely ask their driver to drop them off near their final destination. Therefore, the effects on drop-off locations may be not as statistically significant as the effects on pickup locations.
6. Geographic heterogeneity
6.1. Empirical model
In the previous subsection, we found the overall effects of the introduction of three different bike-sharing platforms on the number of ride-sharing platform orders. To examine how effects may differ across geographic attributes, we employed geographic information collected from Gaode Map. Geographic attributes are organised into four categories: public transportation, education facilities, commerce, and workplaces. presents detailed information regarding each location attribute.
Our empirical model is given by
where the outcome variable Pick-upit measures the number of orders with a pickup location in grid i on day t and the variable Drop-offit measures the number of orders with a drop-off location in grid i on day t. As before, the model is separately estimated for orders with distance less than one mile, orders with distance between one and two miles, and orders with distance between two and three miles.
The treatment variables D10, D16, and D17 denote the introduction of the first, second, and third bike-sharing platforms on November 10 2016, November 16 2016, and November 17 2016, respectively. The variable D10 is a dummy variable that equals to zero for days before November 10 and equals to one for days after November 10. The variables D16 and D17 are similarly constructed with respect to their launch dates.
Location attribute data are collected and used to label each grid. We then use interaction terms of location attribute covariates with three treatment variables to separately estimate the effects of bike-sharing launches on different geographic locations. Covariatesi represents the vector of 24 covariates, and ,
,
,
,
,
are the coefficient matrix that evaluates the effects of the introduction of sharing-bike on grids with the location attribute covariate.
We include six weekday dummies (Monday to Saturday) to control for weekly patterns. We additionally control for weather conditions. We obtained Chengdu’s historical weather condition data from a Chinese official weather website and included the variable LightRain to indicate dates that rained.Footnote2 Because three treatments happen sequentially, we put three treatments together in one model to examine the effect for each introduction separately. As before, the variables >5milesPickupit and >5milesDropoffit control for the overall increase in DiDi orders during our observation period. To take into account correlated error terms, we used SUR to estimate Equation (3) and Equation (4) together.
6.2. Results
, , and present the model estimates for pickup locations, and , , and present the model estimates for drop-off locations.
Table 5. Pickup locations: geographic heterogeneity in effects of bike-sharing first introduction on November 10.
Table 6. Pickup locations: geographic heterogeneity in effects of bike-sharing second introduction on November 16.
Table 7. Pickup locations: geographic heterogeneity in effects of bike-sharing third introduction on November 17.
Table 8. Drop-off locations: geographic heterogeneity in effects of bike-sharing first introduction on November 10.
Table 9. Drop-off locations: geographic heterogeneity in effects of bike-sharing second introduction on November 16.
Table 10. Drop-off locations: geographic heterogeneity in effects of bike-sharing third introduction on November 17.
examines how ride-sharing orders changed with the introduction of the first bike-sharing company on November 10. For public transportation locations, the number of passengers who are picked up from bus stations decreased by 0.0426 (significant at 5%) for orders with distance between one and two miles. For subway stations, the introduction bike-sharing decreased ride-sharing orders with order distance between two and three miles by 0.1237 (significant at 10%) but increased ride-sharing orders with distance between one and two miles. The number of orders with distance less than one mile and picked up from Uber stations increased by 0.1479 (significant at 5%). With the launch of bike-sharing platforms, passengers may bike to an Uber station to get picked up from drivers, which may suggest that bike-sharing services can complement ride-sharing services as well, but as for all the results we get, the overall effect is substitution effect.
For education facilities, we find that the number of orders with distance less than one mile increases by 0.0189 when a location includes a training school (significant at 5%) and decreases by 0.0054 when a location includes an after-school programme facility (significant at 5%). The results suggest that students are more likely to use bike-sharing bikes when they finish after-school classes rather than when they finish school lessons.
For locations with a shopping mall, the introduction of the first bike-sharing platform reduced ride-sharing orders with distance less than one mile by 0.1008 (significant at 1%), reduced orders with distance between one and two miles by 0.1883 (significant at 5%), and increased orders with distance between two and three miles by 0.2010 (significant at 5%). With the introduction of bike-sharing platforms, people are less likely to use ride-sharing services for trips less than two miles as they depart from a shopping mall. For locations that include a florist shop, which is usually located near residential areas, the number of orders with distance less than one mile decreased by 0.0159 (significant at 1%).
We additionally find that ride-sharing orders decreased significantly for locations that include convenience stores. Orders with distance less than one mile decreased by 0.0038 (significant at 10%), orders with distance between one and two miles decreased by 0.0296 (significant at 1%), and orders with distance between two and three miles decreased by 0.0290 (significant at 5%). Convenience stores are located where there is a large pedestrian volume. Relatedly, short-distance ride-sharing orders decreased for locations that include a 7-Eleven store. 7-Eleven is a chain of a convenience store with 40 stores in Chengdu, all located in central commercial areas. The number of orders with distance less than one mile decreased by 0.1373 (significant at 1%), and the number of orders with distance between one and two miles decreased by 0.4711 (significant at 1%).
When a location includes an ATM machine, ride-sharing orders decreased by 0.0193 (significant at 1%) for distance less than one mile and decreased by 0.0447 (significant at 5%) for distance between one and two miles. However, ride-sharing orders increased by 0.0498 (significant at 10%) for orders with distance between two and three miles. The number of orders with distance between two and three miles decreased by 0.1076 (significant at 10%) when the location includes a bank.
We also examine the effect of the bike-sharing launches on ride-sharing orders picked up from locations with workplaces. For locations with a securities company, construction company, or technology company, bike-sharing services reduce ride-sharing orders. For example, in the case of a location with a securities company, the ride-sharing orders with distance between one and two miles decreased by 0.2628 (significant at 1%). For locations with a trade company, financial company, medical company, or industrial company, ride-sharing orders increased. The reduction in demand for ride-sharing services as a result of bike-sharing services may encourage some workers to use ride-sharing services more. Other types of companies, including an insurance company, research institutions, and media organisations, revealed mixed effects.
We additionally examine the effect of the launch of the second bike-sharing platform on November 16 () and the launch of the third bike-sharing platform on November 17 (). After the launch of the second bike-sharing platform, we observe a similar overall substitution effect. However, after the launch of the third bike-sharing platform, the effects are insignificant for many locations. In some locations, we also observe that the number of ride-sharing orders increased after the launch of the third bike-sharing platform. As discussed in a previous section, this may be explained by the bike-sharing market saturation.
After the launch of the second bike-sharing platform, the number of orders from an Uber station with distance less than one mile decreased by 0.2544 (significant at 10%). For several commerce places, we observe that the number of short-distance orders decreased after the launch of the second bike-sharing platform. For example, for locations with a shopping mall, the number of orders with distance between one and two miles decreased by 0.6286 (significant at 1%). For locations with a 7-Eleven store, the number of orders with distance between one and two miles decreased by 0.7757 (significant at 5%).
, , and examine how the introduction of bike-sharing platforms affected ride-sharing orders for different drop-off locations. shows how ride-sharing orders changed with the introduction of the first bike-sharing company on November 10. For public transportation locations, the number of passengers who are picked up from a subway station decreased by 0.0302 (significant at 5%) for orders with distance less than one mile. For education facilities such as colleges, the introduction of bike-sharing decreased ride-sharing orders with order distance less than one mile by 0.0259 (significant at 1%). We also find that the number of order decreases when a location includes an after-school programme facility.
For locations with a shopping mall, the introduction of the first bike-sharing platform reduced ride-sharing orders with distance less than one mile by 0.0825 (significant at 1%). With the introduction of the second bike-sharing platforms, the number of orders with distance less than one mile decreased by 0.0992 (significant at 5%), orders with distance between one and two miles decreased by 0.7109 (significant at 1%), and orders with distance between two and three miles decreased by 1.2835 (significant at 1%). The launch of the third bike-sharing platforms, on the other hand, increased short-distance orders with a shopping mall as a drop-off location.
Overall, the results provide evidence that in several locations, people reduce their demand for ride-sharing services after the launch of bike-sharing services. Especially for short-distance trips, people can use bike-sharing services as a substitute for ride-sharing services. This would leave the resources for ride-sharing services for long-distance travellers, which can lead to lower wait times and better services for longer-distance travellers.
7. Conclusions
This paper empirically studies the substitution effects of bike-sharing on a ride-sharing platform and examines the heterogeneity in effects across locations and order distances. We exploit a unique natural experiment setting where bike-sharing platforms were newly launched in a city. We employ detailed granular proprietary ride-sharing order data with detailed geographic data to examine how the effects of bike-sharing are different across geographic locations. Overall, we find that there are significant substitution effects between bike-sharing services and a ride-sharing platform.
The availability of other detailed order-level data on bike-sharing and ride-sharing services would further enrich our understanding of the sharing economy. The observation period of this paper is one month, which is not suitable for studying the long-term substitution effects of bike-sharing on ride-sharing orders. In future research, it would be insightful to examine bike-sharing’s long-term effect and how bike-sharing affects commuters’ transportation mode choices over time. Additionally, we can utilise a more granular time-level data to further explore how the substitution effects may differ across the time of the day and examine how the effects may differ during rush hours.
Disclosure statement
No potential conflict of interest was reported by the authors.
Additional information
Funding
Notes
1. Bike-sharing companies maintain conditions of their bikes by checking bikes every day.
2. There were only four rainy days in our observation period: from November 6 to November 9.
References
- Armstrong, M. (2017, July 17). Meet DiDi: China’s Answer to Uber. Automotive Industry. Retrieved from https://www.statista.com/chart/10294/meet-didi_-chinas-answer-to-uber/
- Bakos, J. Y. (1997). Reducing buyer search costs: Implications for electronic marketplaces. Management Science, 43(12), 1676–1692.
- Bernard, Z. (2018, April 12). The bike-sharing economy is shaking up the transportation market worldwide. Business Insider. Retrieved from http://www.businessinsider.com/the-bike-sharing-market-is-growing-charts-2018-4
- Bian, J., & Hong, Y. (2018, February 8). Daily bike-sharing users in China peaked at 70 million. Retrieved from http://en.people.cn/n3/2018/0208/c90000-9425354.html
- Botsman, R., & Rogers, R. (2011). What’s mine is yours: How collaborative consumption is changing the way we live. New York, NY: Harper Business.
- Brynjolfsson, E., Hu, Y., & Simester, D. (2011). Goodbye pareto principle, hello long tail: The effect of search costs on the concentration of product sales. Management Science, 57(8), 1373–1386.
- Cheng, M. (2016, August). Sharing economy: A review and agenda for future research. International Journal of Hospitality Management, 57, 60–70.
- Cohen, B., & Kietzmann, J. (2014). Ride on! Mobility business models for the sharing economy. Organization & Environment, 27(3), 279–296.
- DiDi Research Institute. & CBNData. (Trans.). (2016, November 16). The big data report of intelligent travel in Chengdu. (Trans.). Retrieved from http://www.cbndata.com/report/374/detail?isReading=report&page=81
- Ge, Y., Xiong, H., Tuzhilin, A., Xiao, K., Gruteser, M., & Pazzani, M. (2010, July). An energy-efficient mobile recommender system. Proceedings of the 16th ACM SIGKDD international conference on Knowledge discovery and data mining (pp. 899–908). Washington, DC, USA.
- Jie, Z. (2018, May 23). DiDi speeds up IPO plan. Retrieved from http://usa.chinadaily.com.cn/a/201805/23/WS5b050070a3103f6866eea20c.html
- Kaltenbrunner, A., Meza, R., Grivolla, J., Codina, J., & Banchs, R. (2010, August). Urban cycles and mobility patterns: Exploring and predicting trends in a bicycle-based public transport system. Pervasive and Mobile Computing, 6(4), 455–466.
- Kim, J., Yoon, Y., & Zo, H. (2015). Why people participate in the sharing economy: A social exchange perspective. PACIS 2015 Proceedings (pp. 76).
- Leblanc, S. (2018, February 25). Studies are increasingly clear: Uber, Lyft congest cities. Chicago Sun-Times. Retrieved from https://chicago.suntimes.com/business/uber-lyft-studies-add-traffic-congestion/
- Lee, D. S., & Lemieuxa, T. (2010). Regression discontinuity designs in economics. Journal of Economic Literature, 48(2), 281–355.
- Liu, W., Zheng, Y., Chawla, S., Yuan, J., & Xing, X. (2011, August). Discovering spatio-temporal causal interactions in traffic data streams. Proceedings of the 17th ACM SIGKDD international conference on Knowledge discovery and data mining (pp.1010–1018). San Diego, California, USA.
- Malhotra, A., & Alstyne, M. (2014). The dark side of the sharing economy … and how to lighten it. Communications of the ACM, 57(11), 24–27.
- Sang, S., O’Kelly, M., & Kwan, M. P. (2010). Examining commuting patterns: Results from a journey-to-work model disaggregated by gender and occupation. Urban Studies, 48(5), 891–909.
- Schuijbroek, J., Hampshire, R. C., & Hoeve, W.-J. (2017). Inventory rebalancing and vehicle routing in bike sharing systems. European Journal of Operational Research, 257(3), 992–1004.
- Seign, R., & Bogenberger, K. (2012, March). Prescriptions for the successful diffusion of carsharing with electric vehicles. Conference on Future Automotive Technology Focus Electromobility, München, Germany.
- Srivastava, V. K., & Dwivedi, T. D. (1979). Estimation of seemingly unrelated regression equations: A brief survey. Journal of Econometrics, 10(1), 15–32.
- Wo, S. S. C. (Trans.). (2017, February 5). The unofficial big data analysis of mobike. (Trans.). Retrieved from https://www.jianshu.com/p/2a20d2a97ac0
- Zeng, C. H. (Trans.). (2016a, November 16). Over sixty percent citizens in Chengdu have used DiDi: The penetration rate of intelligent travel in Chengdu ranking the first in western part of China. (Trans.). Retrieved from http://sichuan.scol.com.cn/ggxw/201611/55729701.html
- Zeng, J. B. (Trans.). (2016b, September 2). DiDi’s travel report: People in Chengdu rank first in the total mileage. (Trans.). Retrieved from http://news.chengdu.cn/2016/0902/1814322.shtml
- Zervas, G., Proserpio, D., & Byers, J. W. (2017). The rise of the sharing economy: Estimating the impact of airbnb on the hotel industry. Journal of Marketing Research, 54(5), 687–705.