
ABSTRACT
There are plenty of definitions proposed for business analytics – some of them focus on the scope/coverage/problem, some on the nature of the data, and some concentrate on the enabling methods and methodologies. The common denominator of all of these definitions is that business analytics is the encapsulation of all mechanisms that help convert data into actionable insight for better and faster decision-making. Although the name is new, its purpose has been around for several decades, characterised under different labels. Largely driven by the need in the business world, business analytics has become one of the most active research areas in academics and in industry/practice. The Journal of Business Analytics is created to establish a dedicated home for analytics researchers to publish their research outcomes. Covering all facets of business analytics (descriptive/diagnostic, predictive, and prescriptive), the journal is destined to become the pinnacle for rigorous and relevant analytics research manuscripts. Herein we provide an overview of research challenges and opportunities for business analytics to lay the groundwork for this new journal.
1. An introduction to business analytics
Business analytics is a relatively new term that is gaining popularity in both business and academic circles like nothing else in recent history. In most general terms, business analytics is the art and science of discovering insight – by using sophisticated mathematical, statistical, machine learning, and network science methods along with a variety of data and expert knowledge – to support better and faster/timely decision-making. Therefore, business analytics can be thought of as an enabler for decision-making and problem solving.
Generally speaking, analytics (or perhaps more appropriately, data analytics) can simply be defined as “the discovery of meaningful patterns – new and novel information and knowledge – in data.” Since we are living in an era of big data, the analytics definitions are mostly focused on that – data that are being created in large volumes, varieties with a high velocity. Although most current definitions of analytics are primarily data-focused, there are and there have been many applications of analytics where there were very little or no data; instead, those analytics projects used mathematical models that relied on process description and expert knowledge (e.g., optimisation and simulation models, and rule-based expert systems (ES)). Business analytics is a special application/subset of analytics that leverage its tools, techniques, and principles to develop solutions to ever so complex business problems. Firms commonly apply analytics to business data, to describe, predict, and optimise their business performance.
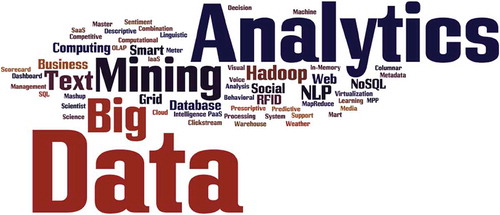
Analytics, perhaps because of its rapidly increasing popularity as a buzzword, is being used to replace several, previously popular, terms such as intelligence, mining, and discovery. For example, the term business intelligence is now business analytics, customer intelligence is customer analytics, Web mining is Web analytics, and knowledge discovery is data analytics. Since modern-day analytics can require extensive computation (because of the volume, variety and velocity at which the data are created – i.e., the big data), the tools, techniques, and algorithms used for analytics projects leverage the most current, state-of-the-art methods developed in a wide variety of fields that include management science, computer science, statistics, data science, and mathematics. shows analytics, big data, and related terms in a word-cloud representation.
Figure 1. Analytics and big data‒related word cloud.
1.1. Is there a difference between analytics and analysis?
Even though the words analytics and analysis are being used interchangeably, analytics is not the same as analysis. In its basic definition, analysis refers to the process of separating a whole problem into its parts so that the parts can be critically examined at the granular level. It is often used for complex systems where the investigation of the complete system is not feasible or practical, and therefore it needs to be simplified by decomposing it into its more descriptive/understandable components. Once the improvements at the granular level are realised and the examination of the parts is completed, the whole system (either a conceptual or physical system) is then put back together using a process called synthesis. Analytics, on the other hand, is the variety of methods, technologies, and associated tools for creating new knowledge/insight to solve complex problems. In essence, analytics is a multifaceted and multidisciplined approach to understanding and addressing complex situations. Analytics take advantage of data and mathematical models to make sense of the ever so complicated world that we are living in. Even though analytics includes the act of analysis at different stages of the discovery process, it is not just analysis but also includes synthesis and subsequent implementation. More than anything else, it is a methodology that encompasses a multitude of methods and practices.
1.2. Why the sudden popularity of analytics?
Analytics is the buzz-word in business circles nowadays. No matter what business journal or magazine you look at, it is very likely that you will see articles about analytics, and how it is changing the way managerial decisions are being made. It has become a new label for evidence-based management (i.e., evidence/data-driven decision-making). The question is why analytics has become so popular, and why now? The main reasons (or forces) behind this popularity can be grouped into three categories: need, availability/affordability, and culture change (Delen, Citation2015).
1.2.1. Need for better business decisions
As we all know, business is anything but “as usual” nowadays. Traditionally characterised as local, then regional, then national, competition is now global. Large to medium to small, every business is under the pressure of global competition. The barriers that sheltered companies in their respective geographic locations with tariffs and transportation costs are no longer as protective. In addition to (and perhaps because of) global competition, customers have become more demanding. They want the highest quality of products and/or services with the lowest prices in the shortest possible time. Success or mere survival depends on businesses being agile, and their managers making the best possible decisions in a timely manner to respond to market-driven forces (i.e., rapidly identifying and addressing problems and taking advantage of the opportunities). Therefore, the need for fact-based, better, and faster decisions is more critical now than ever before. In the midst of these unforgiving market conditions, analytics is promising to provide managers with the insight they need to make better and faster decisions, which would improve their competitive posture in the marketplace. Analytics nowadays is widely perceived as the saviour/helper of the business managers from the complexities of global business practices.
1.2.2. Availability of data and affordability of the enablers
Thanks to recent technological advances, and the affordability of software and hardware, organisations are collecting a tremendous amount of data. Automated data collections systems – based on a variety of sensors/RFID – have significantly increased the quantity and quality of organisational data. Coupled with the content-rich data collected from Internet base technologies including social network/media, businesses now can have more data than they can handle. As the saying goes, “we are now drowning in data but starving for knowledge.” In addition to the data collection technologies, the data processing technologies have also improved significantly. The machines with numerous processors (both central processing units/CPUs and graphics processing units/GPUs) and very large in-memory capacity, makes it possible to process very large and complex data in a reasonable time frame, often in real time. These advances in technology (both hardware and software) are also reflected into pricing, continuously reducing the cost of ownership for such systems. In addition to ownership models, there are also software as a service, and hardware as a service business models, as well as cloud-based enablers that allowed businesses (especially small to medium businesses with limited financial power) to rent analytics capabilities and pay for only what they use of them (Delen & Demirkan, Citation2013).
1.2.3. Cultural change towards evidence-based management
At the organisational level, there is a shift from old-fashioned intuition-driven decision-making to new age of fact/evidence-based decision-making. Most successful organisations are making a conscious effort towards shifting into a data/evidence driven business practice. Because of the availability of data and supporting information technology infrastructure, such a paradigm shift is taking place faster than many have thought. As the new generation of quantitatively savvy managers replaces the baby-boomers, this evidence-based managerial paradigm shift will only intensify.
1.3. What are the application areas of analytics?
Even though the business analytics wave is somewhat new, there are numerous applications of analytics covering almost every aspect of business practices. For instance, there are a wealth of success stories in customer relationship management where sophisticated models are developed to identify new customers, up-sell/cross-sell opportunities, and customers with high propensity to attrite. Using social media analytics and sentiment analysis, businesses are trying to stay on top of what people are saying about their product/services and brands. Fraud detection, risk mitigation, product pricing, marketing campaign optimisation, financial planning, employee retention, talent recruiting, and actuarial estimation are all among the many business applications of analytics. It would be very hard to find a business issue where a number of analytics applications cannot be found. From business reporting to data warehousing, from data mining to optimisation, analytics techniques are being used widely in almost every facet of business.
1.4. What are the main challenges of analytics?
Even though the advantages as well as the enabling reasons for analytics are evident, there still are many businesses hesitant to jump on the analytics bandwagon. Even though they may all have their specific reasons, at the highest level, the main roadblocks/hurtles to analytics adaptation can be listed as follows (Sharda, Delen, & Turban, Citation2017):
Analytics talent. Data scientists, as many people nowadays call the quantitative geniuses who can convert data into actionable insight, are scarce in the market and the really good ones are very hard to find. Because analytics is relatively new, the talent for analytics is still in the process of development. Many colleges have started masters and also undergraduate programmes to address the analytics talent gap. As the popularity of analytics increases, so will the need for people who have the knowledge and skills to convert “Big Data” into information and knowledge that managers and other decision-makers need to tackle complexities of the real world.
Culture. As the saying goes “old habits die hard.” Changing from a traditional management style (which is often characterised by intuition and gut feelings as the basis of making decisions) to a contemporary management style (which is based on data and scientific models to base managerial decisions to data/evidence and collective organisational knowledge) is not an easy process to undertake for any organisation. People do not like to change. Change means losing what you have learned/mastered in the past and now need to learn how to do what you do all over again. It suggests that the knowledge (which is also characterised as power – knowledge is power) you have accumulated over the years will disappear or partially will be lost. Cultural shift may be the most difficult part of adopting analytics as the new management paradigm.
Return on investment. Another factor behind analytics adoptions is the difficulty in clearly justifying its return on investment (ROI). Since analytics projects are complex and costly endeavours, and their return is not clearly and immediately related, many executives are having a hard time investing in analytics, especially on a large scale. One has to answer the questions of “Will, and if so when, the value gained from analytics outweigh the investment?”. It is very hard if not impossible to convert the value of analytics into justifiable numbers. Most of the value gained from analytics is somewhat intangible and holistic. If done properly, analytics could transform an organisation to new and improved levels. A combination of tangible and intangible factors needs to be brought to bear to numerically rationalise investment and movement towards analytics and analytically savvy management practice.
Data. The media is taking about “Big Data” in a very positive way; characterising it as an invaluable asset for better business practices. We think that is mostly true, especially if the business understands and knows what to do with it. For the others, who have no clue, big data is a big challenge. As we will reiterate on the topic later in the article, Big Data is not just big, it is unstructured and is arriving at a speed that prohibits traditional means from collecting and processing it. Not to mention that it usually is messy and dirty. For organisations to succes in analytics, they need to have a well-thought strategy for handling “Big Data” so that it can be converted to actionable insight.
Technology. Even though it is capable, availability, and to some extent, affordable, technology adoption poses another challenge for traditionally less technical businesses. Even though it is affordable, it still costs significant amount of money to establish an analytics infrastructure. Without financial means and/or a clear ROI, management of those businesses may not be willing to invest in needed technology. For those, perhaps an analytics-as-a-service model (which would include both software as well as infrastructure/hardware needed to implement analytics) can be less costly and easier to implement.
Security and privacy. One of the most commonly pronounced criticisms towards data and analytics is the security. As we often hear in the news about data bridges for sensitive information, there is no completely secured data infrastructure, not unless it is isolated and disconnected from all other networks (which would be something that goes against the very reason of having data and analytics). The importance of data security made information assurance as one of the most popular concentration areas in information systems departments all over the world. Although the techniques are increasing in sophistication to protect the information infrastructure, so are the methods and techniques used by adversaries. In addition to security, there are also the concerns about personal privacy. Use of personal data about the customers (existing or prospective), even if it is within the legal boundaries, should be avoided or highly scrutinised to prevent the organisation from bad publicity and public outcry.
Despite the hurdles in the way, analytics adoption is growing, and is inevitable for today’s enterprises, regardless of the size and industry segment. As the complexity in conducting business increases, businesses are trying to find order in the midst of the chaotic behaviours. The ones who succeed in doing so will be the ones fully leveraging the capabilities of analytics.
2. A historical view of analytics and its terminology
Is analytics something new? Because of its recent buzz and popularity, many people are asking if analytics is something brand new. Generally speaking, it really is not! At least not for the true meaning of what analytics stands for. One can find references to corporate analytics as far back as the 1940s during the world war era when more effective methods were needed to maximise output with the limited resources. Most of the optimisation and simulation techniques were developed then. Analytics (or as it was called, analytical techniques) have been used in business since the early days of time and motion studies that were initiated by Frederick Winslow Taylor in the late nineteenth century. Henry Ford measured the pacing of assembly lines which led to mass production initiatives. But analytics began to command more attention in the late 1960s when computers were used in decision support systems. Since then, analytics have evolved with the development of enterprise resource planning (ERP) systems, data warehouses (DW), and a wide variety of other hardware and software tools and applications.
The timeline depicted in shows the terminology used to describe analytics (or what analytics stands for) in the last 60+ plus years (Delen, Citation2015). During the early days of analytics, prior to 1970s, there were very little data, often obtained from the domain experts using manual processes (i.e., interviews and questionnaires/surveys) to build mathematical or knowledge-based models to solve constrained optimisation problems. The motivation behind this analytics movement was to achieve the best outcomes with limited available resources. These decision support models were generally named as operations research and management science (OR/MS). The problems that were too complex to solve optimally (using linear or non-linear mathematical programming techniques) were tacked with heuristic methods and simulation modelling.
Figure 2. A historical view to the evolution of analytics terminology.
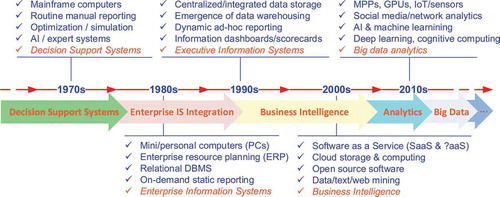
In the 1970s, in addition to matured OR/MS models that were now being used in many industries and government systems, a new and exciting stream of models emerged, rule-based ES. These systems were promising to capture the experts’ knowledge in a machine processable form (e.g., a collection of if-then rules) so that they can be used for consultation much the same way one would use domain experts to identify a structured problem and to prescribe the most probable solution. That way, the scarce expertise can be made available to whomever wherever they would need it using an “intelligent” decision support system. During 1970s, businesses have also created routine reports to help/inform decision-makers (managers) about what had happened in the previous period (e.g., day, week, month, quarter, etc.). Although it was useful to know what had happened in the past, managers needed more than what was available: a variety of reports at a different level of granularity to better understand and address changing needs and challenges of the business.
In the 1980s, we have seen a significant change in the way the organisations captured their business related data. The old practice of having multiple disjoint information systems that are tailored to capture transactional data of the organisational unit/function (e.g., accounting, marketing and sales, finance, manufacturing, etc.) left its place to integrated enterprise level information systems that we commonly refer to nowadays as ERP systems. The old mostly sequential and non-standardised data representation schemas left their places to relational database management (RDBM) systems. These systems made it possible to improve capturing, storing, and relating organisational data fields to one another while significantly reducing the replication of information. The need for RDBM and ERP systems emerged when the data integrity and consistency became an issue, significantly hindering the effectiveness of business practices. With ERP, all of the data from every corner of the enterprise are collected and integrated into a consistent schema so that every part of the organisation would have access to a single version of the truth when and where they need it. In addition to the emergence of ERP systems, or perhaps because of these systems, business reporting became an on-demand as-needed business practice. That way, the decision-makers can respond when they want to create a specialised report to investigate organisational problems and opportunities.
In 1990s, the need for having more versatile reporting led to executive information systems (a decision support system that was designed and developed specifically for executives and their decision-making needs). These systems designed as graphical dashboards and scorecards (so that they can serve as both visually appealing displays while focusing on what are the most important factors for decision-makers to keep track of – key performance indicators). In order to make this highly versatile reporting possible while maintaining the transactional integrity of the business information systems intact, they had to create a middle data tier, as a repository to specifically support business reporting and decision-making. This new tier is called DW. In a very short time, most large to medium size businesses adopted data warehousing as their platform for enterprise-wide decision-making. The dashboards and scorecards were getting their data from DW and, by doing so, were not hindering the efficiency of the business transaction systems – mostly referred to as ERP systems.
In 2000s, these DW-driven decision support systems were named as Business Intelligence (BI) systems. As the amount of longitudinal data accumulated in the DWs increased, so did the capabilities of hardware and software to keep up with the rapidly changing and evolving needs of the decision-makers. As a necessity of the globalised competitive market place, decision-makers needed most current information in a very digestible form to address business problems and to take advantage of market opportunities in a timely manner. Since the data in a DW is updated periodically, it does not reflect the latest information. In order to alleviate this information latency problem, DW vendors developed systems to update the data more frequently, which led to coining the term “Real-time Data Warehousing” or more realistically “Right-time Data Warehousing” which differs from the former by adopting a data refreshing policy based on the needed freshness of the data items (i.e., not all data items need to be refreshed in real time). Since the data collected in DW were large and feature-rich, the emerging computational trends like data mining and text mining have become popular to “mine” the corporate data to “discover” new and useful knowledge nuggets to improve business processes and practices. With the increasing volumes and varieties of data, the need for more storage and more processing power emerged. While large corporations had the means to tackle the problem, small to medium size companies looked for financially more manageable business models. This need led to service oriented architecture and software and infrastructure as service type analytics business models. That way, smaller companies had access to analytics capabilities on an as-needed basis and paid only for what they used, as opposed to investing on financially prohibitive hardware and software resources.
In 2010s, we have seen and still are seeing yet another paradigm shift in the way the data is captured and used. Largely attributed to the widespread use of Internet, new data generation media have emerged. Of all the new data sources (e.g., RFID tags, digital energy meters, clickstream Web logs, smart home devices, and wearable health devices), perhaps the most interesting and challenging one is the social network/media data. Even though it is rich in information content, analysis of such unstructured data sources poses significant challenges to computational systems, from both software as well as hardware perspectives. Recently, the term “Big Data” has been coined to highlight these challenges the new data streams have brought upon us. Many advancements in both hardware (e.g., massively parallel processing with very large computational memory and highly parallel multi-processor computing systems) as well as software/algorithms (e.g., Hadoop with MapReduce and NoSQL) have been developed to address the challenges of “Big Data”. With the big data and enhanced computing capabilities (especially with the advent of using GPU for processing of very large and unstructured data) came about a new buzz term “deep learning.” Generally speaking, deep learning is the rejuvenation of artificial neural networks with a large number of hidden layers. As some would like to describe it as neural networks on steroid. This new computational paradigm (started with neural networks [with convolutional and recurrent neural networks] and prone to extend into other computational methods such as Bayesian modelling) showed that given large enough data (e.g., image, text, voice, etc.), underlying computational systems are capable of selecting the features and building highly accurate prediction models.
What the next decade will bring upon us, what are the new terms that will be used to name analytics, are all very hard to predict for sure. The time between new paradigm shifts in information systems and particularly in analytics has been shrinking and the trend will continue for the foreseeable future. Today, the reality is that even though analytics is not new, the explosion in its popularity is very new. With the recent explosion of big data, the means to collect and store this data, and capable and intuitive software tools, data and data-driven insight is more accessible to business professionals than ever before. Therefore, in the midst of global competition, there is a huge opportunity to make better managerial decisions using data and analytics to increase revenue while decreasing cost by building better products, improving customer experience, catching fraud before it happens, and improving customer engagement through targeting and customisation ‒ all with the power of analytics and data. More and more companies are now preparing/schooling their employees with the know-how of business analytics to drive effectiveness and efficiency in their day-to-day decision making processes.
3. A simple taxonomy for Business Analytics
Because of the multitude of factors related to both need to make better and faster decision as well as the availability and affordability of hardware and software technologies, analytics is gaining popularity faster than any trends we have seen in the recent history. Will this upward exponential trend continue? Many industry experts think that it will, at least for the foreseeable future. Some of the most respected consultancy companies projecting analytics to grow three times the rate of other business segments in upcoming years; and named analytics as one of the top business trends of this decade (Robinson, Levis, & Bennett, Citation2010). As the interest and adoption of analytics grew rapidly, a need to characterise analytics into a simple taxonomy has emerged. Along with the top consultancy companies (Accenture, Gartner, IDT among others), several technologically oriented academic institutions embarked on a mission to create a simple taxonomy for analytics. Such taxonomy, if developed properly and adopted universally, could create a contextual description of analytics, thereby facilitating a common understanding of what is analytics, what is included/excluded in analytics and how analytics related terms (e.g., business intelligence, predictive modelling, data mining, etc.) would relate to each other. One of the academic institutions that took this challenge was INFORMS (Institute for Operations Research and Management Science). In order to reach to a wide audience, INFORMS hired Capgemini, a strategic management consulting firm, to carry out the study of characterising analytics.
The study produced a concise definition of analytics: “Analytics facilitates realization of business objectives through reporting of data to analyze trends, creating predictive models for forecasting and optimizing business processes for enhanced performance.” As this definition implies, one of the key findings from the study was that analytics is seen (by the executives inquired from a wide range of industries) as a core function of businesses that use it and spans many departments and functions within organisations and in mature organisations the entire business. As far as identifying the main categories of analytics is concerned, the study identified three hierarchical but sometimes overlapping groupings: descriptive, predictive, and prescriptive analytics. These three groups are hierarchical in terms of level of the level of analytics maturity of the organisation. Most organisations start with descriptive analytics, then move into predictive analytics, and finally reach the top level in analytics hierarchy, prescriptive analytics. Even though these three groupings of analytics are hierarchical in complexity and sophistication, moving from a lower level to a higher level is not clearly separable. That is, a business can be in descriptive analytics level while at the same time using predictive and even prescriptive analytics capabilities, in a somewhat piecemeal fashion. Therefore, moving from one level to the next essentially means that the maturity at one level is completed and the next level is being widely exploited. shows a graphical depiction of business analytics taxonomy developed by INFORMS’ initiative and shows how this taxonomy can be leveraged along two axis – value proposition and computational sophistication – for a deeper understanding.
Figure 3. A simple taxonomy for analytics.
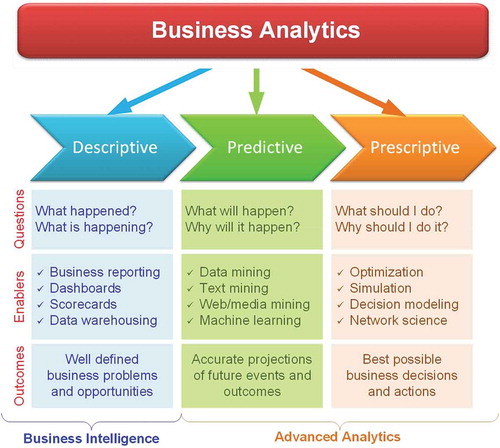
Figure 4. Characterising business analytics along value proposition and computational sophistication.
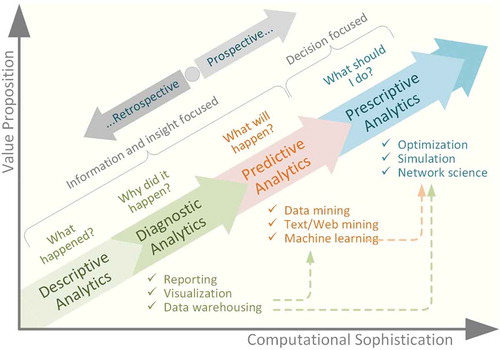
Descriptive analytics is the entry level in analytics taxonomy. It is often called business reporting, because of the fact that most of the analytics activities at this level deal with creating report to summarise business activities, to answer the questions of “What happened?” or “What is happening?”. The spectrum of these reports includes static snapshots of business transactions delivered to knowledge workers (i.e., decision-makers) on a fix schedule (e.g., daily, weekly, quarterly); dynamic views of business performance indicators delivered to managers and executive in a easily digestible form – often in a dashboard looking graphical interface – on a continuous manner; ad-hoc reporting where the decision-maker is given the capability of creating his/her won specific report (using intuitive, drag-and-drop graphical user interface) to address a specific/unique decision situation. Diagnostic analytics (as a natural extension of descriptive analytics) examines the data to answer the question of “why did it happen?”. It employs exploratory data analysis of the existing data using tools and techniques like visualisation, drill-down, data discovery, and data mining in order to identify/discover the root causes of a given problem (Delen & Zolbanin, Citation2018).
Descriptive analytics (and diagnostic analytics) are also called BI, and the other two (predictive and prescriptive analytics) collectively called Advanced Analytics. The logic behind calling a part of the taxonomy advanced analytics is that moving from descriptive to predictive and/or prescriptive is a significant shift in the level of sophistication and therefore warrant the label of “advanced.” BI has been one of the most popular technology trends for information systems designed to support managerial decision-making since the start of the century. They were popular (to some extent, they still are in some business circles) until the arrival of analytics wave. Analytics characterise BI as the entrance level to the world of analytics, setting the stage and paving the way towards more sophisticated decision analysis. These descriptive analytics systems usually works off of a DW, which is a large database specifically designed and developed to support BI functions and tools.
Predictive analytics comes right after the descriptive analytics in the three-level analytics hierarchy. Organisation that are matured in descriptive analytics move into this level where they look beyond what happened and try to answer the question of “What will happen?”. As we will cover the predictive capabilities of these analytics techniques in depth in the following chapters as part of data mining, herein we provide only a very short description of main prediction classes. Prediction essentially is the process of making intelligent/scientific estimates about the future values of some variables like customer demand, interest rates, stock market movements, etc. If what is being predicted is a categorical variable, the act of prediction is called classification otherwise it is called regression. If the predicted variable is time-dependent, then the prediction process is often called time-series forecasting.
Prescriptive analytics is the highest echelon in analytics hierarchy. It is where the best alternative among many – that are usually created/identified by predictive and/or descriptive analytics – courses of action is determined using sophisticated mathematical models. Therefore, in a sense, this type of analytics tries to answer the question of “What should I do?”. Prescriptive analytics uses optimisation, simulation, and heuristics-based decision modelling techniques. Even though prescriptive analytics is at the top of the analytics hierarchy, the methods behind it are not new. Most of the optimisation and simulation models that constituted prescriptive analytics were developed during and right after World War II in 1940s, when there was a dire need to do the best/most with limited resources. Since then, they have been used by some businesses for some very specific problem types, including yield/revenue management, transportation modelling, scheduling, etc. The new taxonomy of analytics made them popular again, opening their use to a wide array of business problems and situation.
Business analytics is gaining popularity because it promises to provide decision-makers with much-needed information and knowledge that they need to succeed. Effectiveness of business analytics systems, no matter what level in the analytics hierarchy, depends largely on the quality/quantity of the data (volume and representational richness); accuracy, integrity, and timeliness of the data management system; and the capabilities and sophistication of the analytical tools and procedures used in the process. Understanding the analytics taxonomy helps organisations start selecting and implementing analytics capabilities to efficiently navigate through the maturity continuum.
4. Research in analytics
While industry is at the forefront of embracing various facets of business analytics, academic research has not fully recognised its potential (Delen & Zolbanin, Citation2018). As Shmueli and Koppius (Citation2011) denote, almost all studies in business disciplines have used “causal-explanatory statistical modeling and statistical inference to test causal hypotheses and to evaluate the explanatory power of underlying causal models”. While these prevalent modelling and problem-solving paradigms have generated significant insights over the past decades, they have also prevented researchers from working on emerging and relevant business problems. Additionally, since the emphasis of academic research has mostly been theoretical modelling and testing, rather than on the problem and the data, they have often resulted in irrelevant theory and questionable conclusions (Breiman, Citation2001). It is believed that with the use of analytics not only can we produce more and more reliable information about the inherent structure of relationships between the focal variables, but also we will be able to generate more relevant research (Breiman, Citation2001). Therefore, it is important for business researchers to add analytics as a new and promising tool to their arsenal of research methods.
Although several reasons have been enumerated for the paucity of analytical studies in business journals, two causes deemed to be the most salient (Delen & Zolbanin, Citation2018). First and foremost, a vast majority of business journals have historically placed a high value on publications that test systems of relationships specified by theory (Putka et al., Citation2017). Consequently, researchers have placed greater focus on modelling and analysis than on the problem and the data; leading to an overabundance of structural equation models to the point that other analysis methods are not considered sophisticated/scientific enough. Second, and chiefly a ramification of the first cause, most business scholars do not typically receive the training required to understand and apply various business analytics methods during their graduate studies (Putka et al., Citation2017); and why would they when such methods are given no chance in top-tier business, and particularly management, outlets? Whereas this trend has changed in all industrial sectors and many academic areas, some business disciplines have not yet fully embraced the new analytics paradigm. We believe this trend has to change or those fields will not be able to accurately predict emerging and important outcomes, will fail to incorporate into their models some of the key drivers of their phenomena of interest, or will not be able to adequately address model complexity and uncertainty.
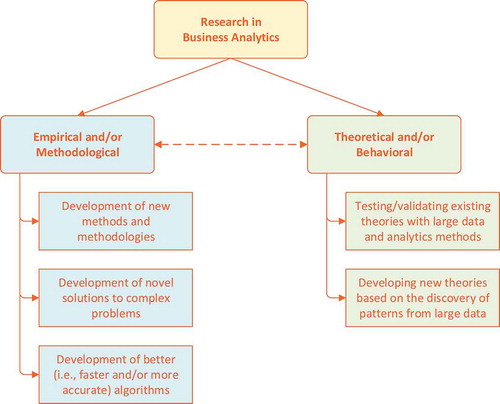
At the highest level, the research in business analytics can be either empirical/methodological or theoretical/behavioural. Although seemingly disjointed, supported by different schools of thoughts, these two streams are not mutually exclusive, each can potentially benefit from other’s findings. That is, empirical research can use theoretical findings to craft/design variables for predictive and prescriptive analytics models while theoretical research can use the empirically discovered relationships/correlations to develop new theories.
The research in analytics is not limited to the complementary role that it plays in supporting traditional statistics and/or theory development‒based business research. In fact, this complementary role driven reach is a small portion of business analytics research. The bigger and more prominent portion of business analytics research spans from developing algorithms (new and improved algorithms that are more suitable, faster and/or more accurate than the existing ones) to designing methodologies (for converting a wide variety of data types and sources into actionable insights) and building applications/solutions (innovative and best-practice approaches to the development of solutions to seemingly unsolvable business problems). shows a simple taxonomy of the business analytics research.
Figure 5. A simple taxonomy of Business Analytics research.
Research in business analytics typically uses quantitative methods such as statistics, econometrics, machine learning, and network science. Today’s business world consists of very complex systems and such systems play an important part in our daily life, in science, and in economy. Thus, understanding such complex systems, describing them mathematically, using them for prediction, and eventually controlling them are the major intellectual and scientific challenges of the twenty-first century (Barabasi, Citation2016). This is where network science provides a lot of utility. As stated by Barabasi (Citation2016), “networks are also at the heart of some of the most revolutionary technologies of the 21st century, empowering everything from Google to Facebook, CISCO, and Twitter. At the end, networks permeate science, technology, business and nature to a much higher degree than it may be evident upon a casual inspection. Consequently, we will never understand complex systems unless we develop a deep understanding of the networks behind them”.
In particular, network science coupled with machine learning is a very promising approach for research in business analytics. It has been successfully demonstrated in constructing and analysing large-scale networks from social media to predict audience selection and targeting Zhang, Bhattacharya, & Ram, Citation2016). Other areas where network science can be used are in developing models for news propagation in social media (Bhattacharya & Ram, Citation2015) and predicting specific purchase time for retail products (Lismont, Ram, Vanthienen, Lemahieu, & Baesens, Citation2018). Prediction of article quality on Wikipedia has been shown to be possible using a combination of machine learning, social science theory, and network science, which points to the importance of computational social science (Liu & Ram, Citation2018). An example of state-of-the-art research in the emerging area of network medicine is prediction of high-cost patients at the point of admission (Srinivasan, Currim, & Ram, Citation2018). Finally, there are many interesting research problems with social implications, including student retention prediction, as well as transportation and smart cities development, that can benefit from the development of methods combining deep learning with networks as described in several recent studies (Ram, Wang, Currim, & Currim, Citation2015; Wang, Ram, Currim, Dantas, & Sabóia, Citation2016). Coupled with network science, we also see the emerging area of field experiments being very valuable for business analytics (Hauser & Luca, Citation2015; Zoumpoulis, Simenter, & Evgeniou, Citation2015). Such field experiments can help answer questions of causality in conjunction with prediction models.
5. Summary and conclusions
Managers of the increasingly complex and globally competitive business world of today needs new and innovative decisioning tools to help them face these challenges. Business analytics, a term originally coined by industry, is perhaps the encapsulation of those tools aimed at converting data (big or small, structured or unstructured) into actionable insight through a scientific/mathematical/intelligent process. The research that established the foundations of this analytics movement have been published in a variety of technical journals that are, at best, tolerant to this topic. In order to establish a real home for research in business analytics, where the researcher does not have to force their manuscript into a format to comply with non-analytics-journals’ requirements, the Journal of Business Analytics is created.
For this newly founded promising journal, we would like to solicit research on business analytics that focuses on developing new insights and solutions from data and computational sciences and understanding of the complex organisational dynamics to help make the best possible managerial decisions to survive, innovate, and grow. Thus, the Journal of Business Analytics focuses on all facets of analytics (descriptive/diagnostic, predictive and prescriptive) as well as computational and field experiments to identify, characterise, and solve real-world problems.
We would like to publish articles that use real-world data to solve real-world problems in an innovative manner. We would like to see articles that specifically address an interesting and meaningful research problem, collect and/or repurpose data (potentially originating from multiple sources and in a variety of types), and develop and evaluate methods and methodologies to solve the problem in a new and innovative way. We urge researchers to think beyond just applying traditional statistical or machine learning methods to ordinary problems in the traditional ways. Papers submitted to the journal need to address how they identify an existing or new/futuristic real-world problem, develop new methods and/or methodologies that may, for instance, combine enablers like statistics, machine learning, network science, and mathematical programming, and evaluate their proposed methods, methodologies, and resultant outcomes with sound validation, experimentation, and/or empirical testing methods.
Disclosure statement
No potential conflict of interest was reported by the authors.
References
- Barabasi, A. L. (2016). Network science. New York, NY: Cambridge University Press.
- Bhattacharya, D., & Ram, S. (2015). RT @News: An analysis of news agency ego networks in a micro-blogging environment. ACM Transactions on MIS, 6(3), 1–25.
- Breiman, L. (2001). Statistical modeling: The two cultures. Statistical Science, 16(3), 199–231.
- Delen, D. (2015). Real-world data mining: Applied business analytics and decision making. Upper Saddle River, NJ: FT Press (a Pearson Company).
- Delen, D., & Demirkan, H. (2013). Data, information and analytics as services. Decision Support Systems, 55, 359–363.
- Delen, D., & Zolbanin, H. M. (2018). The analytics paradigm in business research. Journal of Business Research, 90, 186–195.
- Hauser, O., & Luca, M. (2015). How to design and analyze a business experiment. Harvard Business Review.
- Lismont, J., Ram, S., Vanthienen, V., Lemahieu, W., & Baesens, B. (2018). Predicting interpurchase time in a retail environment using customer product networks: An empirical study and evaluation. Expert Systems with Applications, 104, 22–32. doi: 10.1016/j.eswa.2018.03.016.
- Liu, J., & Ram, S. (2018). Using big data and network analysis to understand Wikipedia article quality. Data and Knowledge Engineering, 115, 80–93, doi: 10.1016/j.datak.2018.02.004.
- Putka, D. J., Beatty, A. S., & Reeder, M. C. (2017). Modern prediction methods: new perspectives on a common problem. Organizational Research Methods, 21(3), 689-732. doi:10.1177/1094428117697041
- Ram, S., Wang, Y., Currim, F., & Currim, S. (2015). Using big data for predicting freshman retention. Proceedings of International Conference on Information Systems, Ft. Worth, Texas.
- Robinson, A., Levis, J., & Bennett, G. (2010). Informs to officially join analytics movement. ORMS Today, INFORMS Publication, October 2010.
- Sharda, R., Delen, D., & Turban, E. (2017). Business intelligence analytics, and data science: A managerial perspective. Upper Saddle River, NJ: Pearson.
- Shmueli, G., & Koppius, O. R. (2011). Predictive analytics in information systems research. MIS Quarterly. MIS Quarterly, 35(3), 553–572. doi:10.2307/23042796
- Srinivasan, K., Currim, F., & Ram, S. (2018). Predicting high cost patients at point of admission using network science. IEEE Journal on Biomedical and Health Informatics in Press, doi: 10.1109/JBHI.2017.2783049.
- Wang, Y., Ram, S., Currim, F., Dantas, E., & Sabóia, L. A. (2016). A big data approach for smart transportation management on bus network. In Smart Cities Conference (ISC2), 2016 IEEE International Smart Cities Conference, 2016, Trento, Italy (pp. 1–6).
- Zhang, K., Bhattacharyya, S., & Ram, S. (2016). Large-scale network analysis for online social brand advertising. MIS Quarterly, 40(3), 849–868. doi:10.25300/MISQ
- Zoumpoulis, A., Simenter, D., & Evgeniou, T. (2015). Run field experiments to make sense of your big data. Harvard Business Review.