
ABSTRACT
Searches of the Web using Google, and database searches of the academic and practitioner literature, return a large number of differing and varied definitions of the concept of business analytics. This article reviews the growing literature on Business Analytics (BA) using traditional and qualitative research tools. Our searches included using Google Search to identify examples of business analytics applications, and a focused keyword search of the available practitioner and academic literatures. Text analytics techniques identified frequently used terms in prior definitions of business analytics. Our empirical, inductive approach provides a basis for proposing and explaining a formal sentence definition for Business Analytics. The analysis provides a starting point for operationalising a measure for the business analytics construct. Additionally, understanding business analytics can help managers assess skill deficiencies and evaluate claims about relevance of tools and techniques. Finally, carefully defining the Business Analytics concept should provide stimulus for new research ideas.
1. Introduction
Both analytics and data are increasingly central to decision-making in modern organisations. The increasing ease of gathering, storing, and processing data has led to a highly varied and growing set of data for analysis. Many employers want to hire people who can apply tools to analyse data and make sense of what analyses are needed and what the results mean. The terms business analytics (BA), big data analytics, data analytics, and data science identify the specialists who can meet this business need. All four terms are relatively new in the business lexicon. Students and potential employers as well as faculty members need to know how the meanings of these terms differ and overlap. Professors need to explore and specify the course work for each area of specialty. Researchers need to operationalise and measure the impact of analytics activity, especially Business Analytics, on outcomes including decision-making speed and business performance.
As the importance of business analytics continues to increase so too do the number and variety of definitions for this concept. Similar to the past waves of business innovation, like knowledge management, operations research, and data mining, business analytics has attracted attention and excitement from managers, academics, software vendors, and IS/IT consultants. This excitement has resulted in some confusion. Many existing definitions for the concept have limitations relative to focus and scope, level of detail, measurability, and/or clarity.
The primary objective of this article is to identify and review the existing definitions of “business analytics”Footnote1 to clarify this field of practice, instruction, and scholarship. Our aim is threefold: (1) to assist managers in assessing skill deficiencies and needs, (2) to support practitioners in evaluating vendor claims, and (3) to provide a starting point for operationalising a measure of business analytics. The approach used in this study is both inductive and exploratory with an emphasis on analyses that might inform creation of a useful definition of Business Analytics for research purposes. The entire article provides context and an extended connotative definition of Business Analytics.
This article is structured into six additional sections. The next section reviews the process of defining concepts and provides some historical background on the business analytics phenomenon. The third section presents results from an empirical study of usage of the relevant terms from public data sources. The following section describes and summarises examples of business analytics used in organisations. Section 5 summarises an analysis of business analytics projects completed in the University College Dublin (UCD) Master’s in Business Analytics degree program. Following these analysis sections, the next to the last section discusses the results of prior analyses and limitations. The final section discusses our conclusions.
2. Defining business analytics
Defining concepts is especially important in science, mathematics, research, argumentation, and managing information. According to Smith (Citation2018), the process of definition has ancient origins. For Aristotle, a definition is “an account which signifies what it is to be something” (logos ho to ti ên einai sêmainei). The process of defining a concept or term, the definiendum, involves a number of activities including: (1) explaining the origin of the term itself, its etymology, (2) discussing the history of the term, (3) providing examples, (4) showing how the concept fits into a larger category, creating a hierarchy of abstraction, (5) showing how the term differs from or is similar to others in the same class, and (6) exploring and proposing a formal sentence definition.
The motivation for defining terms is straightforward even though the process may be complex. Defining terms makes our discussions more productive and our analyses more logical. The Purdue Online Writing Lab (Pepper & Driscoll, Citation2018) discusses the importance of defining terms in writing to avoid misunderstandings with the audience. In the physical and social sciences, research projects should begin with operational definitions so hypotheses can be tested. Ideally, an intensional, connotative definition is developed that specifies necessary and sufficient conditions for when a term should be used (Cook, Citation2009). At a minimum, it is important to have a nominal, denotative definition that provides the literal or primary meaning for a term. The process of definition helps us to understand a phenomenon and investigate its scope and impact.
Business analytics has an essence, a meaning. The concept is an abstraction and generalisation of many activities occurring in organisations. Technically, business analytics is a compound noun and one would expect its meaning to be anchored in the two independent concepts of “business” and “analytics”. At some level of generalisation, business analytics is the application of analytics to business problems. The etymology of each component word is relevant. Business itself is a relatively recent concept from the sixteenth century, but it refers to commercial activity which dates to antiquity. Analytics has an ancient origin and derives from the Greek word analȳtikós. The concept of analysis has its roots in logic, mathematics, and science. Aristotle prior to 323 BC explored analytics in his classic monograph Prior and Posterior Analytics, cf., Smith (Citation2018). Analytics differs from analysis in the suffix “-ics”, which means a body of knowledge or principles (Dictionary.com, Citation2018), whereas “analysis” is an activity. Analytics is a singular noun, just like Economics or Physics.
The word “analytics” has been modified by many words including business, data, marketing, big data, predictive, and prescriptive to create compound nouns. The fundamental ideas of analysis – fact-based and logical problem-solving – provide a shared link for these varied compound nouns. Nelson (Citation2017) defines analytics as “the scientific process or discipline of fact-based problem-solving”. Davenport and Harris (Citation2007, p. 7) define analytics as “extensive use of data, statistical and quantitative analysis, exploratory and predictive models, and fact-based management to drive decisions and actions”. Wilder and Ozgur (Citation2015) define it as “the application of processes and techniques that transform raw data into meaningful information to improve decision making”. Finally, INFORMS recommends the definition: “Analytics is the scientific process of transforming data into insight for making better decisions” (Boyd, Citation2012). Analytics is a broad umbrella term that includes business analytics and data analytics. Analytics is the progenitor concept for the compound word phrase “Business Analytics”.
The usage history of the term business analytics only extends back to the late 1990s, but it has roots in (1) scientific management, especially the ideas of Taylor, Gantt, and Gilbreths, (2) the Western Electric Hawthorne studies of Mayo and Roethlisberger, and (3) in operations research, including the work of Dantzig, Koopmans, von Neumann, and many others. Management science and decision sciences are sometimes considered as synonyms for operations research, and possibly Business Analytics. The tools from past efforts to increase scientific analysis in business decision-making are still in use, often under the umbrella of business analytics. The following analyses, results, and discussion examine and establish the boundaries of the term business analytics, especially in the context of supporting decision-making.
3. Analyses of public data sources
This section reports results from an empirical study using multiple sources and tools, including: (1) Google Trends and Google Ngram analyses, (2) text analyses of 15 definitions of business analytics, (3) text analyses of descriptions of Master’s degrees in Business Analytics programs, and finally (4) a traditional search of article databases for the key term Business Analytics.
3.1. Google Trends and Google Ngram analyses
Google Trends and Google Books Ngram were used to create a context for keyword searches related to the term “Business Analytics” and related terms starting in 2004 when the search data time series begins. Google Trends is an online tool for comparison of the popularity of terms searched by users of Google Search, and their trends over time. Google Books Ngram Viewer is an online tool for comparison of the frequencies of strings using a yearly count of n-grams found in sources printed between 1500 and 2008.
depicts the relative number of searches for the terms “Management Science”, “Operations Research”, and “Business Analytics” between January 2004 and May 2018. Some have speculated that Business Analytics replaces or is a synonym for the concepts of management science and operations research.
Figure 1. Relative interest in key search terms Google Trends.
The data trends show an increase in search for Business Analytics during the period, a modest decline in searches for management science and a steep decline in searches for operations research. The search popularity of the three concepts changed during the period. The term “Management Science” and “Operations Research” were popular search terms from 2004 until about 2008. More recently, these terms, especially “Operations Research”, have had reduced popularity, with the term “Business Analytics” steadily increasing in search volume over the last 14 years.
A Google Ngram search for the terms “Analytics”, “Management Science”, and “operations research” for the period 1940–2008 shows the number of mentions of the terms in the published literature, see . Business Analytics was not used in the chart because it did not appear in a significant number of sources.
Figure 2. Relative interest in key terms Google Ngram.
The Ngram in shows the discussion of operations research in the literature peaked in about 1962, while management science peaked in 1978. Analytics is now more frequently discussed than either of the other two terms by a small margin.
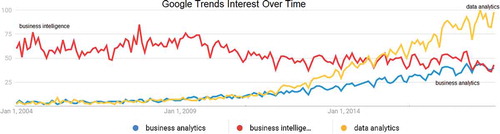
Comparing the number of searches for “Business Analytics”, “Business Intelligence” and “Data Analytics” over the 2004–2018 period, it is evident that searches for “business analytics” and “data analytics” are on a steady increase, while the term “Business Intelligence” has had a steady decline, as shown in . Business analytics has become a popular concept with search interest for the term steadily increasing since December 2011. When compared to “Data Analytics”, “Business Analytics” is not however as popular in Google Search. Perhaps, data analytics is more general or people in business have less need to search for the term than in the past. In March 2018, “Business Analytics” had a relative search score of 42 and “Data Analytics” had a score of 96. In December 2011, both terms were at about 10. There are many business and data analytics articles and examples available online: in some sources, an analytics tool like credit scoring is categorised inconsistently as either type of analytics, perhaps reflecting disagreement about whether these two concepts are distinct, overlapping, or identical, or one is a subset of the other (Rose, Citation2016).
Figure 3. Comparing analytics and business intelligence search terms.
The Google Trends tool was also used to understand the number of Google searches for popular Master’s degree programs, i.e., Master’s in Business Administration and Masters in Business Analytics. depicts the number of searches for “Master’s in Business Administration” compared with “Master’s in Business Analytics”. Many universities offer a Master’s in Business Analytics, and in some cases this Master’s program is more popular than its long-standing MBA program offering.
Figure 4. Comparing interest in two Master’s degree programs.
Noticeably, the number of searches for the term “Master’s in Business Administration” has spiked at various points over the last 15 years. The search for this term rose sharply and fell again at the start of the most recent global economic crisis in 2008. This search behaviour may be an indicator that people were looking for an opportunity to improve their skills at a time when they were faced with economic uncertainty and job insecurity.
3.2. Text analyses of definitions of business analytics
Positive trends indicate people have been interested in finding out more about business analytics in recent years, but that fact is only a starting point. Text analytics can identify patterns in content-like definitions. The definitions found in the top 15 results of a Google Search for a definition of “Business Analytics” are presented in .
Table 1. Top 15 business analytics practitioner definitions.
The first five definitions numbered 1–5 in are returned on the first page of results. “Business Analytics” definitions were relatively easy to identify up to definition 9 in Webopedia. From definition 10 through 15, it was more difficult to identify a definition for the specific search term. Instead of definitions for “Business Analytics”, search results for that term included definitions for “Business Intelligence”, “Data Analytics”, and “Business Analytics versus Data Analytics”. Reading and manual sorting were required.
What is in common to these 15 definitions? Concepts like methods, techniques, and technologies recur. The methods mentioned include statistics and optimisation. Also, the definitions seem to share a goal of improving and supporting business decision-making. Based upon the sources, the definition of business analytics does vary when referring to an academic program versus the application of business analytics in real-world settings. A definition for research purposes needs to be especially well constructed so that the concept can be operationalised. From a subjective perspective, definitions 1, 6, 10, and 12 have problems with focus and scope. Definitions 4, 8, 13, and 15 are very general. Measurability is especially a problem with most of the definitions, and clarity is a problem with definitions 5 and 14.
To more systematically understand the content of the 15 definitions in , a Word CloudFootnote2 was generated and it is shown in . Ninety-five words appeared at least twice.
Figure 5. Business analytics definitions – text analysis.
The size and boldness of the words indicate the frequency that these words are used in the definitions provided to the Word Cloud generator. highlights three terms: “business”, “analysis”, and “data”. The other 92 words illustrated are used less frequently across the 15 definitions.
Using the 15 definitions from , SAS JMP software was used for text analysis to identify patterns for word and phrase frequency across the definitions. Fifteen definitions were uploaded to JMP using an MS Excel spreadsheet, and the output from the text analysis is illustrated in .
Figure 6. Text analysis of top 15 definitions.
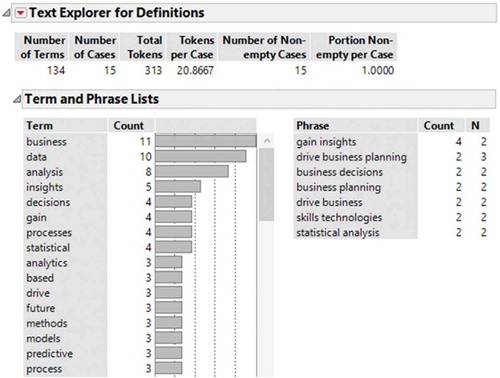
“Business”, “data”, and “analysis” are the top three most frequently used words identified in the 15 definitions analysed. The distribution of frequency of word occurrences then declines, with “insights” occurring five times and “decisions”, “gain”, “process”, and “statistical” each occurring four times across the 15 definitions. Seven word phrases occur more than once in the 15 definitions. The term “gain insights” was the most frequently used phrase occurring four times.
3.3. Text analysis of Master’s in business analytics programs
Using the WorditoutFootnote3 text analysis tool, the descriptions of Master’s degree programs in Business Analytics were processed to understand the words used most frequently. Noticeably, there is a lack of common program title across the universities. A program title could be Masters of Business Analytics, Master’s of Business Analytics, or Master’s in Business Analytics. These are used interchangeably and inconsistently in program descriptions and program content.
Using select courses, program description, and “What’s Unique” program content, a total of 745 words were filtered from the original sources. Only words with a minimum frequency of seven times in the text were displayed in the Word Cloud. The highest frequency word had 92 occurrences. A total of 43 words matched the filtering criteria. The higher the frequency, the more prominent the word in the output in terms of size and colour. Descriptions (Betterbuys Citation2018) at a Website for Top Big Data and Analytics Master’s Programs were used to identify programs titled “Business Analytics” from 12 top US universities. The university program descriptions at that site were used in the analysis. Universities included the following: Arizona State University, Bentley University, Drexel University, Fordham University, The George Washington University, Michigan State University, NYU Stern, Rensselaer Polytechnic Institute, University of Connecticut, University of Michigan–Dearborn, UNC Charlotte, and The University of Tennessee. See the results in .
Figure 7. Word Cloud results from 12 Master’s in business analytics program descriptions.
“Business”, “data”, and “analytics” are highlighted in the Word Cloud. There are no surprises. Courses and programs were described. Science, skills, and analysis were also used repeatedly. The diversity in describing programs is evident in the many low-frequency words used in the 12 descriptions.
Using SAS JMP, the Master’s degree program descriptions were used to identify commonly used phrases to describe the programs offered by the 12 universities. presents the top results from this text analysis.
Figure 8. Master’s in business analytics program description phrase analysis.
Unsurprisingly, the term “Business Analytics” occurs 21 times across the program descriptions. The term “Data Mining” also occurs 11 times: the majority of these Master’s in Business Analytics programs offer data mining as one course in the program. Five occurrences of the phrases “data management”, “decision-making”, and “real world” are identified. Noticeably, more than half of these Master’s programs place significant emphasis on students acquiring real-world or hands-on experience as part of the program in question.
3.4. Searching for business analytics
So, how many results are there for the term business analytics in a Google Search? Entering the search phrase – “Business Analytics” – in the Google Search Engine returns about 8,600,000 results. Other search phrases are also shown in .
Table 2. Summary of Google searches.
Searching for variations on the term “Business Analytics” highlights the huge number of websites, webpages, news articles, vendor articles, blogs, etc. dedicated to or related to the topic of business analytics online. Notably, during the time of writing this article, the search results were updated regularly in an attempt to capture the most up-to-date number of search results for these terms.
An investigation of the academic literature for the same search terms also yielded significant results as presented in . Using the terms “Business Analytics”, Define “Business Analytics”, “Define Business Analytics”, and “Business Analytics Definitions”, we searched four databases, Google Scholar, EBSCO, JSTOR, and Web of Science (WOS), for academic journal articles written in English. The searches yielded varying results (see ).
Table 3. Summary of academic literature searches.
Some initial searches in each database indicated that 2002 marked the earliest journal paper published on the topic of “Business Analytics”. All four databases identified Kohavi, Rothleder and Simoudis’s (Citation2002) article entitled “Emerging trends in Business Analytics” as the first article in an academic journal to use the term. While this 2002 paper does not specify a formal definition for business analytics, Kohavi et al. state that business analytics offers users “better insights, particularly from operational data stored in transactional systems” (p. 45). In this article, Kohavi et al. seem to use the term data mining as a synonym for business analytics. Currently, there is broad agreement that data mining is only one of many business analytics tools.
Investigation of the earliest articles between 2002 and 2008 across the four databases for the search term “Business Analytics” indicated that there was no discipline-specific critical mass of articles published during that time period. Academic articles published during the period were in the disciplines of Information Systems (IS), Computer Science, Statistics, and Finance. In EBSCO, a keyword search for “Business Analytics” between 2002 and 2008 yielded two results: Kohavi et al.’s (Citation2002) CACM article and a corporate finance article by Gnatovich (Citation2007). Gnatovich’s article entitled “Making the Case for Business Analytics” discussed the opportunities for business intelligence to improve organisational compliance with regulations such as Sarbanes Oxley. This article is among the earliest to discuss analytics as a “hot” topic for business. A similar search in JSTOR yielded one result for the search term and time period. This IS article was entitled “A Privacy-Protecting Business-Analytics Service for On-Line Transactions” by Berendt, Preibusch, and Teltzrow (Citation2008). This article uses the terms “Business Analytics” and “Data Mining” interchangeably to propose a framework for privacy in web analytics on customer data.
A Google Scholar search for the terms – Define “Business Analytics”, “Define Business Analytics”, and “Business Analytics Definitions” – yielded many results. Investigating the 39 results from the “Define Business Analytics” search published from 2001 to 2018, one finds that more than half the papers returned were related to the management accounting area, while the remainder are spread across IS, computer science, and statistics.
A search for the term “Business Analytics” using WOS returned 250 journal articles published between 2001 and 2018. shows that the publication frequency of academic journal articles related to business analytics has gained considerable momentum since 2012. There has been steady growth in publishing in this area.
Figure 9. Business analytics academic journal papers 2001–2018.
Further analysis of business analytics academic publications at WOS indicates that the top categories for these 250 published academic journal articles include computer science and IS with 72 articles, management with 68, and operations research/management science with 63 journal articles. These areas account for more than 80% of the business analytics-related academic journal articles published and available on WOS between 2001 and 2018.
From our investigation of the keyword searches across the four databases presented in , we noted the number of citations of “Business Analytics” articles. Based on our search, Chen, Chiang, and Storey (Citation2012) “Business Intelligence and Analytics: From Big Data to Big Impact” is the most cited article with 2863 citations to date. This article provided the academic community with a holistic, comprehensive perspective on the business intelligence and analytics (I&A) landscape in 2011. Their suggested term BI&A was not adopted, rather the term has been simplified to Business Analytics. Chen et al.’s (Citation2012) article demonstrates how quickly technology and terminology have changed.
4. Examples of Business Analytics in use
Specific examples of business analytics are discussed by many sources. Concrete examples help make BA less abstract and hence will help operationalise a measure of the concept. Hayakawa (Citation1978) discusses a ladder of abstractions with four levels. Level 1 refers to concrete identifiable examples that help inform higher levels of abstraction.
Banks and other businesses use business analytics to classify and segment customers based on credit risk, usage and other characteristics, and use algorithms to match customer characteristics with appropriate product offerings. An airlines manager who is considering investing in a new route uses analytics to predict future travel demand for the destination. Managers prepare revenue forecasts. Operations analytics might examine product cost, quality control, and the throughput of resources in production lines. Machine monitoring and machine failure tracking are common. Optimising production and work schedules has been ongoing for many years. Score cards and Key Performance Indicator (KPI)s are common methods of analytics. Marketing groups use predictive analytics for sales lead scoring. Patient costs and care metrics are monitored in many hospitals.
According to McKinsey (Citation2013), examples of business analytics uses include pricing flexibility and differentiated pricing, customer preference management, credit risk analysis, fraud protection, discount targeting including using real-time location data to target customer offers, campaign lead generation, creating an integrated “picture” of a household and its product/brand holdings, churn/retention models, customer acquisition targeting, cross selling/upselling, and advertising targeting especially for online and in social media.
There are many interesting and innovative uses of business analytics. An especially interesting example is a use at Coca-Cola Amatil, the largest bottler and distributor of non-alcoholic, bottled beverages in the Asia-Pacific. Staff developed the Trax Retail Execution application. According to Faggella (Citation2018):
Coca-Cola Amatil sales reps used Trax Retail Execution image-based technology to take pictures of store’s shelves with their mobile devices; these images were sent to the Trax Cloud and analyzed, returning actionable reports within minutes to sales reps and providing more detailed online assessments to management.
Sales reps could quickly identify performance gaps and take corrective actions in the store.
As CMGA report (Citation2016) notes:
At Unilever, the finance function has created a data dashboard that draws upon a diverse set of sources, from social media through to market research agencies, to provide a set of KPIs that are globally relevant, consistent and tangible. Critically they can be linked back to P&L reporting and cash flows.
According to Revionics Press Release (Citation2018), Lenta, one of the largest retail chains in Russia, plans to deploy Revionics price optimisation across all of its Hypermarkets and Supermarkets in 2018. Chris Newbery, Lenta’s Customer Loyalty Director, reported that:
with Revionics analytics and machine learning optimization we are able to review our store zones, improve our KVI lists and define specific roles for every single category, all the while delivering very focused competitive pricing that engages customers and inspires loyalty.
According to Teradata Press Release (Citation2018):
Overstock.com Inc. is using Teradata Path Analysis as part of its customer journey analytics. Overstock, a leader in online retail, needed a path analysis solution to visually analyse customer data from multi-channel marketing campaigns and key customer milestones in their journeys. With the overall goal of reducing unnecessary marketing spend and identifying loyalty opportunities, Overstock is leveraging a pathing interface developed by Teradata to put advanced path analysis, once solely the domain of specialists and data scientists, directly into the hands of marketers, business analysts and non-technical professionals.
Specific examples of a phenomenon can provide a basis for generalising a definition of a phenomenon. The above examples of business analytics broadly defined help identify the boundaries and content to enumerate an operational definition. These concrete examples provide a basis for abstraction of the Business Analytics phenomenon.
5. Real-world business analytics course projects
The prior analysis of 12 Master’s in Business Analytics programs highlighted a focus on “hands-on” or “real-world” experiences for students taking these courses. This section examines data from the MSc in Business Analytics program at UCD on capstone analytics projects. These are usually real-world projects proposed by and in collaboration with partners in industry and the public sector. Looking at the content of these projects can assist in creating an extensional definition of business analytics (McDermott, Citation2017).
A dataset consisting of the projects undertaken by students of the UCD MSc in Business Analytics over a 6-year period (2011–2017) was created and analysed. The projects were manually labelled by industrial sector, by business function, and by analytics method(s) used. Almost all sectors of the economy are represented, from obvious candidates like finance and transport to sports, agriculture and forestry, and the public sector. The data on industry sectors are presented in a Word Cloud in .
Figure 10. Industry sectors for UCD MSc business analytics projects.

These analytics projects are in most business functions – from core functions and operations through to sales, CRM, and HR.
A wide variety of analytical methods are used in projects, as shown in .
Figure 11. Methods used in UCD business analytics projects.
Methods range from descriptive statistics, to a traditional tool like regression analysis, to more advanced machine learning. Supervised and unsupervised learning are popular tools. There is continued interest in optimisation methods, both “classical” and metaheuristic. Decision analytics also remains popular. These topics reflect a broad interpretation of analytics in the UCD program, and also reflect its roots in the fields of operations research and management science.
Text processing and time-series methods appear also either as stand-alone methods or as inputs to other algorithms. Projects also often include more niche methods including spatial analytics, recommender systems, network models, and simulation methods. Over time, there has been an increased interest in extracting value from the text, spatial, network, and other forms of non-tabular data. This reflects business intuition that value can be extracted from such data, and a recognition that basic tools and approaches like linear regression are a poor fit for such problems. The dominance of supervised learning suggests that there are opportunities for deep learning and other advanced algorithms which can go beyond the performance of standard regression and classification techniques. Overall, there is continuing evidence of novel applications and methods in projects each year.
6. Discussion of prior analyses and business analytics
This qualitative, interpretive research article describes an empirical approach to creating both a nominal, denotative definition of Business Analytics and an intensional, connotative definition. Both types of definition help better understand this phenomenon. There are useful definitions in academic textbooks like Sharda et al. (Citation2014) that provide nominal, denotative definitions. Sharda et al. (Citation2014) define Business Analytics as “the application of models directly to business data. Business analytics involve using DSS tools, especially models, in assisting decision makers (p. 393).” This definition is narrowly focused and more appropriate for instruction than it is for creating a measure or identifying skill deficiencies.
From a connotative perspective, business analytics differs from the general concept of analytics by requiring business relevance and actionable insights from analyses, and business analytics is especially focused on improving performance. From a more denotative perspective, BA uses statistical and operations analysis tools with a specific dataset. Business analytics can provide evidence for decision-making. An examination of the examples suggests that there are two primary categories of business analytics: (1) routine or routinised business analytics that may be incorporated in decision support and decision automation systems and (2) non-routine, special study business analytics used by an analyst to prepare recommendations in a non-recurring decision situation.
Defining “Business Analytics” has a political dynamic. Many software vendors want their software positioned as a BA tool or as a core BA technology. Industry analysts like Gartner define BA to create a context for their services. Also, academic administrative stakeholders define their BA program so that it is recognised as reputable, or as the best, or as innovative or leading edge. Journals and conferences use the term BA to attract people to read, download, and cite articles and papers and attend conferences. Academic researchers want to be the first to understand a “new” phenomenon, to advance our knowledge, and/or to impact teaching or practice. Stakeholders have diverse interests in the definition of a “new” phenomenon. Creating a shared understanding of the business analytics concept must recognise that the definition might vary depending upon context and usage. For example, an academic program in BA might explain the term in a different way than a vendor explaining their approach to business analytics.
Even though the approach used in this study was decidedly empirical, a decision support bias likely influenced the interpretations. Word Clouds and word occurrences must be interpreted. This analysis has been wide ranging and the focus has been upon a rich understanding of the business analytics phenomenon.
Concerning future research in business analytics, it may be useful to divide it into three types, which we term “tools”, “implementation”, and “organizational impact”. Research on tools consists of research situated in one of the component disciplines of BA. BA practice and instruction relies upon many academic disciplines including statistics, operations research, management and decision sciences, and computer science. Each discipline contributes tools and methods for performing data analyses, modelling situations, and supporting decision-making. For example, the development of improved methods for regression is a topic for research in statistics and machine learning, and the development of new database and processing infrastructures is a topic for research in information technology. Both count as business analytics research since these disciplines are subsumed under BA. They respond to a BA need. Business analytics researchers and practitioners interested in this research agenda will draw on the literature specific to the discipline in question, sometimes making relatively little contact with the BA literature per se. Lim, Chen, and Chen (Citation2012) outline a “business intelligence and analytics” research agenda focusing on this type of research.
Research on BA implementation is concerned with taking known tools from the component disciplines and applying them to real problems. Thus, it often consists of BA case studies. These are more integrative than studies of the first type, with more emphasis on business outcomes than purely technical ones.
Research on organisational impact has a more IS flavour. It asks a very different set of questions: how can we measure BA project success and added value? What factors are associated with BA project success? What is the impact on organisational structure and on society of adopting BA? Several researchers have identified these questions, surveyed the literature, and framed BA (sometimes in combination with big data or business intelligence) as a development in the field of IS, to be studied using the frameworks of that field. Grover, Chiang, Liang, and Zhang (Citation2018) surveyed the question of how business value is created by “big data and analytics”. Abbasi, Sarker, and Chiang (Citation2016) proposed a framework for research into the “information value chain” in the context of big data, using three IS research traditions (“behavioral, design, and economics of IS”). In their editorial to a special issue, Sharma, Mithas, and Kankanhalli (Citation2014) foresaw a trend from one-off decisions informed by analytics to a more pervasive change in decision-making processes. They therefore called for more research into “behavioural, organizational and strategic issues” to help understand impact on organisations.
Several researchers have focused on specific application areas of business analytics, e.g., health care (Chen et al., Citation2012; Gupta & Sharda, Citation2013), location (Pick, Turetken, Deokar, & Sarkar, Citation2017), education (Chen et al., Citation2012), sports analytics (Davenport, Citation2006), insurance (Hopkins & Brokaw, Citation2011), and hospitality/entertainment (Chen et al., Citation2012; Davenport, Citation2006). Given the data-intensive nature of most types of modern business, it is unsurprising that BA is a differentiating factor between organisations operating in the same industry (Davenport, Citation2006). At the heart of every business, managers have decision-making needs and these may be met by designing, developing, testing, and refining effective business analytics approaches, selecting the right mix of BA tools and techniques for the right decision problem.
The healthcare sector is data/information/knowledge intensive with multiple stakeholders. It is considered nuanced and complex. Healthcare analytics can support a wide mix of operational and clinical managerial decision-making including monitoring financial performance, operational efficiency, patient treatment, and patient health outcomes. We are only beginning to scratch the surface on the potential for business analytics in the healthcare domain. In industries where operational efficiency and data-driven metrics have been incorporated in business practices, certain organisations are using BA to achieve further improvements beyond the current best industry standard. For example, Hopkins and Brokaw (Citation2011) reported on Assurant Solutions significant customer retention improvement and upselling of credit insurance and debt protection products when non-conventional parameters were taken into account when routing calls in their call centre.
Finally, “What is the financial impact of business analytics?” In an interview with Power (Citation2006) many years ago, Henry Morris, Fellow for International Data Corporation’s (IDC) Worldwide Big Data, Analytics and Cognitive Software Research and founder of the Analytics program, was asked this question.
Morris’s response in 2006 was:
Three years ago IDC published a study on the financial impact of business analytics. We examined 42 analytics projects across North America and Europe in a variety of industries, collecting metrics from business users and IT. There was a significant return on investment. The benefits we could measure had to do with labour productivity improvements and business process enhancement (i.e., driving more revenue or reducing business costs). The biggest challenge of the study was finding organizations that had maintained metrics that we could examine. And this raises an important point – the need to clarify objectives and capture data that will enable an analysis of the business impact of an analytics project.
In the 2002 IDC study, Morris et al. (Citation2003) found that:
a business analytics implementation generates a median five-year return on investment (ROI) of 112% with a mean payback of 1.6 years on average costs of $4.5 million. Of the organizations included in this study, 54% have an ROI of 101% or more.
Morris et al. (Citation2003) concluded “Business analytics solutions are the next step in using technology to support the decision-making process. These solutions provide trend analysis and performance feedback and facilitate decisive actions that result in measurable gains in cost efficiency or revenue growth.”
The presumption has been that using data with quantitative models can generate evidence and results that will influence choices and improve decision quality and business performance. Are organisations achieving these results? Are the Morris et al.’s (Citation2003) results still achievable?
7. Conclusions
The concept of business analytics is still evolving. There is no single, widely known, authoritative definition of business analytics. That goal seems unreasonable to expect given the varied usages of the term in practice, academic programs, and research. Also, what we teach as “Business Analytics” varies among universities.
In 2012, Chen et al. wrote an extensive review of business intelligence and analytics research that was included in the special issue of MIS Quarterly they edited. They started a conversation about:
how the IS discipline can better serve the needs of business decision makers in light of maturing and emerging BI&A technologies, ubiquitous Big Data, and the predicted shortages of data-savvy managers and of business professionals with deep analytical skills. How can academic IS programs continue to meet the needs of their traditional students, while also reaching the working IT professional in need of new analytical skills? (p. 1185)
The field of business analytics has matured since 2012, but much more needs to be done to address the questions they raised. Business analytics does involve IS, but it is a cross-disciplinary area of research and practice that has evolved rapidly.
Business analytics covers many activities and tasks. The results from implementing business analytics seem to vary by the amount of use and the commitment to using business analytics in decision-making. It is important for managers to track data about business analytics projects, monitor results, and continually improve and expand the use of analytics. Analytics has become part of the job of every manager.
Any BA program occupies a place in the spectrum between Computer Science/Mathematics/Data Science (on one hand) and Business and Management (on the other). Business analytics requires both technical and business knowledge. A major problem in designing a BA curriculum is that the boundaries are not distinct. This “problem” does permit and encourage academic entrepreneurs to create a differentiated program of study.
Is “Business Analytics” an emerging discipline, a research area or a field of study? Is it a subfield of something called Data Science or Management Science? It is too soon to answer these questions definitively, but business analytics is more than buzz or a faddish marketing term. So what definition is appropriate for a broad set of purposes and uses including creating a measure for empirical studies?
Business Analytics is a systematic thinking process that applies qualitative, quantitative, and statistical computational tools and methods to analyse data, gain insights, inform, and support decision-making. Any particular analysis may use a variety of techniques including diagnostic, predictive, prescriptive, and optimisation models.
Both business analytics and data analytics are specialised subtypes of analytics. The concepts diagnostic, predictive, and prescriptive analytics refer to types of models, and all three are shared subtypes of both business and data analytics.
Perhaps, this definition could have been proposed without any empirical analysis by an expert, but the background, text analysis, and literature search results provide context. Also, the prior sections provide evidence about the meaning of this evolving phenomenon. Our objective was to inductively lead readers through analyses to help them assess the meaning of business analytics. Our overall objective is promoting understanding not encouraging memorisation of a definition. So how does the above definition improve upon the more than 20 definitions in this article? The proposed definition builds upon concrete examples, prior research, and search results. The focus and scope are on business decision-making in general, there is some detail about analytics, but every possible method and tool is not enumerated, the definition is concrete enough to assist in developing measures, and finally, the construction of the sentences and word choice are understandable and succinct. This definition is a brief stopping point on a journey.
Acknowledgments
The authors want to thank colleagues at University College Cork and University College Dublin who provided comments, feedback and suggestions following a presentation of many of the analyses and ideas included in this article. Also, the authors want to thank the reviewers for their recommendations which have contributed to this article.
Disclosure statement
No potential conflict of interest was reported by the authors.
Notes
1. We use Business Analytics when referring to the definition or the specific search term, otherwise we use business analytics or BA.
2. worditout.com/word-cloud/.
References
- Abbasi, A., Sarker, S., & Chiang, R. H. L. (2016). Big data research in information systems: Toward an inclusive research agenda. Journal of the Association for Information Systems, 17(2). Article 3. Retrieved from http://aisel.aisnet.org/jais/vol17/iss2/3
- Beal, V. (2018). Webopedia – business analytics. Retrieved from https://www.webopedia.com/TERM/B/business_analytics.html
- Berendt, B., Preibusch, S., & Teltzrow, M. (2008). A privacy-protecting business-analytics service for on-line transactions. International Journal of Electronic Commence, 12(3), 115–150.
- Betterbuys. (2018). Top big data & analytics masters programs. Retrieved from https://www.betterbuys.com/bi/big-data-analytics-programs
- Boyd, A. E. (2012). Profit center: Revisiting ‘what is analytics’. Analytics Magazine, July/August 6. Retrieved from http://analytics-magazine.org/profit-center-revisiting-what-is-analytics/.INFORMS
- Business Dictionary. (2018, May 20). Business analytics: Definition. Retrieved from http://www.businessdictionary.com/definition/business-analytics.htm
- CGMA® Report. (2016). Business analytics and decision making: The human dimension, chartered institute of management accountants. Retrieved from https://www.cgma.org/Resources/DownloadableDocuments/business-analytics-briefing.pdf
- Chen, H., Chiang, R., & Storey, V. (2012). Business intelligence and analytics: From big data to big impact. MIS Quarterly, 36(4), 1165–1188.
- Cook, R. T. (2009). Intensional definition. A dictionary of philosophical logic (pp. 155). Edinburgh: Edinburgh University Press. https://en.wikipedia.org/wiki/Extensional_and_intensional_definitions#Intensional_definition
- Davenport, T. H. (2006). Competing on analytics. Harvard Business Review, 84(1), 98.
- Davenport, T. H., & Harris, J. G. (2007). Competing on analytics: The new science of winning. MA: Harvard Business School Press.
- Dictionary.com. (2018, July 21). “-ics”. Retrieved from http://www.dictionary.com/browse/-ics.
- Faggella, D. (2018, June 1). Business intelligence & analytics case studies across industry. TechEmergence. Retrieved from https://www.techemergence.com/5-business-intelligence-analytics-case-studies-across-industry
- Gabelli School of Business. (2018). Define Business Analytics. Retrieved from https://www.fordham.edu/info/21535/business_analytics
- Galetto, M. (2018, March 8). What Is Business Analytics? NGDATA. Retrieved from https://www.ngdata.com/what-is-business-analytics/
- Gartner. (2018, May 19). IT glossary. Retrieved from https://www.gartner.com/it-glossary/business-analytics.
- Gnatovich, R. (2007). Making a case for business analytics. Strategic Finance, 88(8), 46.
- Grover, V., Chiang, R. H. L., Liang, T. P., & Zhang, D. (2018). Creating strategic business value from big data analytics: A research framework. Journal of Management Information Systems, 35(2), 388–423.
- Gupta, A., & Sharda, R. (2013). Improving the science of healthcare delivery and informatics using modeling approaches. Decision Support Systems, 55, 423–427.
- Hayakawa, S. I. 1978. Language in thought and action. Enlarged ed. San Diego: Harcourt Brace Jovanovich.
- Hopkins, M. S., & Brokaw, L. (2011). Matchmaking with math: How analytics beats intuition to win customers. MIT Sloan Management Review, 52(2), 35. Retrieved from https://sloanreview.mit.edu/article/matchmaking-with-math-how-analytics-beats-intuition-to-win-customers/
- Kohavi, R., Rothleder, N. J., & Simoudis, E. (2002). Emerging trends in business analytics. Communications of the ACM, 45(8), 45–48.
- Lim, E. P., Chen, H., & Chen, G. (2012). Business intelligence and analytics: Research directions. ACM Transactions on Management Information Systems, 3, 4, Article 17 (January 2013).
- Lynda. (2018). What is business analytics. Retrieved from https://www.lynda.com/Data-Science-tutorials/What-business-analytics-BA/647676/719245-4.html
- Management Study Guide. (2018). Business analytics – meaning, importance and its scope. Retrieved from https://www.managementstudyguide.com/business-analytics.htm
- McDermott, J. (2017). What we talk about when we talk about analytics. DatSci Awards blog post. Retrieved from https://www.datsciawards.ie/blog/what-meaning-analytics-business/
- McKinsey Presentation. (2013). Big data and advanced analytics: 16 use cases. Retrieved from https://www.mckinsey.com/business-functions/marketing-and-sales/our-insights/presentation-big-data-and-advanced-analytics-16-use-cases and from URL https://www.slideshare.net/McK_CMSOForum/big-data-and-advanced-analytics-16-use-cases
- Morris, H., Graham, S., Andersen, P., Moser, K., Blumstein, R., Vesset, D., … Carr, M. (2003). Executive summary: The financial impact of business analytics. IDC #28689. Retrieved from https://www-07.ibm.com/services/hk/pdf/finimpact.pdf
- Nelson, G. (2017, July 7). Difference between analytics and big data, data science and informatics. ThotWave Blog. Retrieved from https://www.thotwave.com/blog/2017/07/07/difference-between-analytics-and-bigdata-datascience-informatics/
- Pepper, M., & Driscoll, D. L. (2018, March 20). Writing definitions. Purdie OWL. Retrieved from https://owl.english.purdue.edu/owl/resource/622/01/
- Pick, J., Turetken, O., Deokar, A., & Sarkar, A. (2017). Location analytics and decision support: Reflections on recent advancements, a research framework, and the path ahead. Decision Support Systems, 99, 1–8.
- Power, D. (2006, March 12). Henry Morris interview: Decision support and analytic applications. DSSResources.COM. Retrieved from http://dssresources.com/interviews/morris/morris12032006.html.
- Pratt, M. (2017). What is BI? Business intelligence strategies and solutions. CIO. Retrieved from https://www.cio.com/article/2439504/business-intelligence/business-intelligence-definition-and-solutions.html
- Revionics Press Release. (2018). Lenta, Russia’s leading hypermarket chain, implements Revionics price optimization. DSSResources.com. Retrieved from http://dssresources.com/news/4929.php
- Rose, R. (2016). Defining analytics: A conceptual framework. OR/MS Today, 43(3). Retrieved from https://www.informs.org/ORMS-Today/Public-Articles/June-Volume-43-Number-3/Defining-analytics-a-conceptual-framework.INFORMS
- Schaer, B. (2018). Hitachi solutions – What is business analytics? Retrieved from https://us.hitachi-solutions.com/blog/business-analytics-infographic/
- SearchBusinessAnalytics. (2018). Definition: Software applications – Business analytics. Retrieved from https://searchbusinessanalytics.techtarget.com/definition/business-analytics-BA
- Sharda, R., Delen, D., Turban, E., Aronson, J. E., Liang, T., & King, D. (2014). Business intelligence: A managerial perspective on analytics (3rd ed.). New York: Prentice Hall.
- Sharma, R., Mithas, S., & Kankanhalli, A. (2014). Transforming decision-making processes: A research agenda for understanding the impact of business analytics on organizations. European Journal of Information Systems, 23(4), 433–441.
- Smith, R. (2018). Aristotle’s logic. In E. N. Zalta (Ed.). The Stanford Encyclopedia of Philosophy (Spring 2018 ed.). Retrieved from https://plato.stanford.edu/archives/spr2018/entries/aristotle-logic
- Study.com. (2018). What is business analytics? – Definition & strategy. Retrieved from https://study.com/academy/lesson/what-is-business-analytics-definition-strategy.html
- Techadvisory. (2014). What is business analytics. Retrieved from http://www.techadvisory.org/2014/01/what-is-business-analytics/
- Techopedia. (2018). Definition – What does Business Analytics (BA) mean? Retrieved from https://www.techopedia.com/definition/344/business-analytics-ba
- Teradata Press Release. (2018, March 27). Overstock.com uses Teradata path analysis to boost its customer journey analytics. DSSResources.com. Retrieved from http://dssresources.com/news/4928.php
- Wells, D. (2008). B-eye-network business analytics – Getting the point. Retrieved from http://www.b-eye-network.com/view/7133
- Wikipedia. (2018). Definition. Retrieved from https://en.wikipedia.org/wiki/Definition
- Wilder, C. R., & Ozgur, C. O. (2015). Business analytics curriculum for undergraduate majors. INFORMS Transactions on Education, 15(2), 180–187.