
ABSTRACT
Medical schools store large sets of patient data. The data is important for the analysis of trends and patterns in healthcare practice. However, obtaining access to the data can be problematic due to the data protection mechanisms. In this study, we investigate the current practices from the lens of both the data requester and the data provider. Results reveal discrepancies between how the provider organises the data governance process, how the process is presented to the data requester, and the data requester’s perception of satisfactory user experience. This study provides a simple one interview mental model method approach for data governance services to reveal potential problems in the process. This is a quick and effective method for data providers to help uncover the challenges and to provide foundations for future fully automated (human out of the loop) systems for data accessibility in healthcare organisations.
1. Introduction
Healthcare data is used to study and improve the quality of care and medical treatments by scientific inquiry and real-time patient data analysis (Murdoch & Detsky, Citation2013; Nambiar et al., Citation2013; Wang et al., Citation2018). In the recent past, healthcare research has experienced a growing demand for data accessibility from research investigators, known as data requesters, and healthcare organisations, known as data providers (Feldman et al., Citation2012; Groves et al., Citation2013; Nambiar et al., Citation2013). However, an absence of external regulations and security standards to protect patient data leads to data problems, such as poor quality, exposure to exploitation, misuse of information, and poor decisions (Alofaysan et al., Citation2014). Research suggests studying best practices of data governance and implementing those practices that work to produce maximum benefits to the involved organisations (Groves et al., Citation2013; Patil & Seshadri, Citation2014; Wang et al., Citation2018). Currently, healthcare research is struggling with rather weak data governance practices as the established processes either under-govern or over-govern (Sanders, Citation2013).
While studies in healthcare suggest best practices for data governance in general, research indicates a lack of robust data governance frameworks in healthcare organisations, which emerges as a crucial challenge for effective management of availability, usability, and security of large voluminous sets of health data (Al-Badi et al., Citation2018). Moreover, the process of data retrieval is extremely complex and time consuming due to the heterogeneous nature of structured and unstructured data extracted cross institutionally, which slows down the process of data accessibility. Thus, it often takes months to fulfil a data request (Raghupathi & Raghupathi, Citation2014; Sreenivas et al., Citation2015; Valluripally et al., Citation2019, January, Citation2019). Hence, in this study we explored data governance frameworks implemented in healthcare research organisations from the user perspective.
We worked with a medical school to investigate their institutional process of requesting and fulfiling healthcare data for research studies within an established data governance framework. We wanted to gather insight on the current sociotechnical processes and practical implementation of a data governance framework of the healthcare organisation as well as unpack the user experience with the data governance practices. The goal of this study is twofold. First, it is to unpack the current human-centred practices and highlight the user challenges that may occur in the data governance process in healthcare organisations. Second, it is to apply and study the efficiency of a new, quick, and simple, interview-modelling method for data providers or designers, in which we suggest conducting only one interview per user group as a start in uncovering the central issues in current data governance practices.
We used a framework of mental models (see Section 2.2.) through a simple one-interview modelling method to explore the user experience with the process of data accessibility from the perspective of both the data requester and the data provider. Mental models can be studied with user experience methods such as usability studies or individual interviews (Jonassen, Citation1995) The result can potentially be used to add design recommendations on how to improve the data requesting process. As we know from the fields of knowledge integration, distributed cognition, and human communication theory (e.g., Herrmann et al., Citation2007), the integration of different knowledge held by different users about the same process is key to make a process work (Hantho et al., Citation2002; Moreland, Citation1999; Roschelle & Teasley, Citation1995). In other words, what data providers (the designers of the process) think they are seeing and know about the process can be quite different from how the data requesters are perceiving the process and interpreting what is required of them as users of or participants in the process. In other cases, the mental and conceptual models may be the same. In worst case scenario, there is no shared or mutual understanding of the process, which may complicate the data request process and lead to long delays in providing data access or to users revoking their requests due to timeliness reasons. The central research question is: In what ways do the two user groups (data provider and data requester) have synergistic or different understandings of the current process of requesting and accessing healthcare data in a multi-organisational environment?
Data on potentially different process understandings of the designer or provider and user groups help the designer or data provider to understand the problems, issues, or challenges that users face in the current workflow practice, including potential issues with communication and presentation or documentation of the data governance process. Our findings of such potential practice gaps are a start to improve the semiautomated (human in the loop) or ultimately fully automated (human out of the loop) data governance processes in healthcare organisations. It will enable governance committees to facilitate smooth and secure patient care research.
2. Background: Data Governance Practice
Healthcare data refers to large and complex electronic health data sets related to data generated during day-to-day patient healthcare that is captured in many different ways, such as electronic health records (EHRs), radiology, pathology, pharmacy, and other ancillary systems of outpatient and inpatient units (Raghupathi & Raghupathi, Citation2014). With the digitalisation of EHRs and advancements in healthcare data analytics, healthcare organisations are actively participating in information sharing and building of ecosystems with the hope of examining the emerging health trends in populations through data analytics for disease control and predictive analytics (Patil & Seshadri, Citation2014; Wang et al., Citation2018).
However, healthcare data involves huge volumes of patients’ datasets (in zettabytes) collected from multiple sources in structured or unstructured form. In addition, organisations created specific compliance for sharing, protection, and analytics to achieve final output and compliance requirements can differ across the organisations which might be an additional burden when requesting healthcare data (Al-Badi et al., Citation2018; Tse et al., Citation2018). While there exists a growing opportunity for medical practitioners to utilise healthcare data to develop thorough insights for making better informed decisions (Nambiar et al., Citation2013), healthcare organisations have been relatively slow in adopting health data analytics due to the critical challenges associated with management, processing, and security of patient data (Okal & Loice, Citation2019). Research suggests a need to implement a data governance framework to address the issues of healthcare data requesting processes (Alofaysan et al., Citation2014; Tse et al., Citation2018). The focus of the paper is on data governance practices in healthcare research organisations for improving access to such healthcare big data for research.
summarises the gap identified in the literature of healthcare big data management.
Table 1. Summary table for the literature.
2.1. Data governance practices as a sociotechnical problem
In the current practice, healthcare organisations consider compliance issues of privacy and security, as defined by the Health Insurance Portability and Accountability Act (HIPAA), the Health Information Technology for Economic and Clinical Health Act (HITECH), data stewardship, and quality assurance (Raghupathi & Raghupathi, Citation2014). A steady increase has been observed in security breaches of patients’ health information in the last ten years (Patil & Seshadri, Citation2014). The 2019 report of a Verizon data breach investigation report stated that out of 41,686 compiled security incidents from all industries, 466 incidents confirm data breaches in healthcare (Patil & Seshadri, Citation2014; Verizon, Citation2019). Traditional data security solutions do not integrate well with the healthcare cloud platforms required for large datasets. Therefore, data governance becomes an obvious first step in managing healthcare data before exposing it to analytics (Groves et al., Citation2013; Patil & Seshadri, Citation2014).
Data governance in healthcare is viewed as a sociotechnical process of harnessing data in a multi-organisational setting as it is designed on the principles of people, processes, and policies (Ancker et al., Citation2012). Data accessibility in healthcare organisations is a sociotechnical problem, not just a technical problem. Data governance essentially is comprised of agreements on how to manage data, such as policies and standards for managing data, life-cycle data management (archiving, maintaining, and disposing of data), and data security and privacy management (monitoring, auditing, and protection of data) (Wang et al., Citation2018). Due to the ethical and regulatory challenges of protecting highly sensitive clinical data and patients’ privacy, healthcare organisations need to ensure that they create safe and protected data-sharing environments for controlled use of patient information (Groves et al., Citation2013; Wang et al., Citation2018).
Data analysis for large datasets has many underlying challenges in terms of heterogeneity of acquired data, inconsistency and incompleteness of extracted data because of diverse sources, timeliness, privacy of information, and visualisation of data by consumers (Jagdish et al., Citation2014). The governance of managing data requests and providing data access to researchers incorporates multi-fold steps to ensure privacy and security in terms of compliance with standards, such as HIPAA, and protocol approval from an Institutional Review Board (IRB), verifying validity of the research topic. In addition, authorising access to target population data needs to be tracked for auditability (Groves et al., Citation2013). The data providers (academic medical centres, healthcare organisations, and hospitals) have the responsibility to provide data to the researchers and clinicians in a way that either (a) the data are fully de-identified or aggregated, or (b) approved HIPAA authorisation or HIPAA waiver of authorisation has been obtained from the human subject protection organisations such as the Institutional Review Board (IRB) as part of an approved research protocol (Dhir et al., Citation2008; Williams & Colomb, Citation2020). However, currently, in a multi-organisational environment, the process of ensuring compliance with privacy and security standards within the data request and auditing authorisation of data requesters is essentially manual, which impedes the process of data accessibility and slows down the process of protected data disbursement (Valluripally et al., Citation2019, January, Citation2019).
2.2. Main characteristics of the system as they differ from previous healthcare systems
The focus of this study is data governance practices in healthcare research organisations that will improve access to such healthcare integrated data that go beyond electronic healthcare data systems in order to improve research on precision healthcare.
Precision healthcare has the goal to provide personalised treatment to the right population at the right time, and it uses analytical tools for big data to deliver such highly specified treatment (Colijn et al., Citation2017). For this endeavour, researchers need access to (a) large data sets and (b) other big data sets e.g., sociodemographic dataset by using the geocoding technique. The data come from the electronic medical record system and other ancillary clinical systems. This includes, for example, structured data such as demographic, conditions, diagnosis, procedures, medications, and lab results, as well as unstructured data such as texts, radiology images, pathology images, genomic sequences from genetic testing, and streaming data from vital sign and other diagnostic monitoring devices (Raghupathi & Raghupathi, Citation2014). This new approach integrates healthcare data from all data sources including the electronic medical record systems and also external data sources which is a promising approach for improving precision healthcare. The central challenge is preserving privacy (Raghupathi & Raghupathi, Citation2014). It means the data requesting, providing and delivering process needs to be done in a manner that preserves patient privacy.
However, due to a lack of governance or ad-hoc governance practices, researchers are currently not fully able to take advantage of such big healthcare data in an integrated manner (Alofaysan et al., Citation2014). The system that we built here wants to overcome this challenge. The medical researchers (data requesters) get a system that better supports their requests of getting access to such integrated big data.
3. Theoretical framework: Mental Models and Everyday Practices
There is the assumption that the very same process of requesting data is imagined differently by the two main user groups namely, the data provider and the data requester. This assumption is based on the theory of mental models that says that different users with different access rights to the same system may experience the process the same or very differently. Knowledge about potential differences can be used to clarify and improve the process of data governance. Mental models are ideas residing in the minds of people that represent their understanding of how things work (D. A. Norman, Citation1988). Different people might hold different mental models of the same digital tool or service. A person may even develop different mental models of the same service over time. Variables that affect mental models are, for example, experience with the service, age, training, instruction, and exposure to other similar services (D. Norman, Citation2013). A mental model is the illustration of a user, how s/he makes sense of something, such as a process, for example. Users create imaginations of the process as they make sense of the process, and every user is doing it all the time, though often unconsciously (see ).
Figure 1. Mental models (inspired from D. A. Norman, Citation1988).
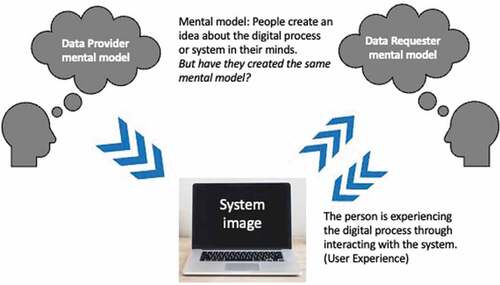
shows the relationship between mental models of how the process and system of requesting data works for both the data provider and the data requester. The data requester creates an idea about the process through interacting with and experiencing the process and system. The requester model is not identical to the provider model, which can lead to misunderstandings or problems during the process. In other words, how the provider thinks the data request process should work and what the requester is experiencing might be different in reality. Communicative actions within groups require members to interact in common language by having a perception of the shared situation; these perceptions can be the same or different (Malone & Crowston, Citation1990).
According to Jonassen (Citation1995), the mental models of the provider and requester “usually vary, often significantly, from the cognitive or conceptual model promoted by the designers” (p. 183). The potential mismatch between the models can lead to misunderstandings and frustrations in the process. Mental models can be studied with user experience methods such as task-based usability studies, System Usability Scale (SUS), or individual interviews.
For a first quick analysis, we here propose a simple set of interview questions to showcase the potential differences between the mental models of the provider and requester.
4. Methods
The data governance and data request processes are viewed as sociotechnical processes of coordination between goals, activities, actors, and interdependencies of the workflows of people, processes, and policies (Ackerman et al., 2018; Ancker et al., Citation2012; Malone & Crowston, Citation1990) (read section 2). More specifically, the process of getting access to protected data is comprised of communicative interaction between the data requester and the data provider through a cloud infrastructure configuration. Such communicative action is based on either the same or different mental models (see Section 3). Hence, we aimed to gather insight into the mental models of two main user groups: (a) the data requesters (researchers, clinicians) and (b) the data providers (medical school, hospitals, private health organisations).
Mental models of the users can be studied via individual interviews or think-aloud protocol in usability studies (Jonassen, Citation1995). Therefore, in order to collect data from the different designer and user groups and their mental models, we conducted the study in two phases using multiple methods. In the first phase, we used semistructured interviews (Creswell, Citation2013) with only two participants to gather insight into the mental models of data requester and data provider with regard to the existing data governance process at the institution.
It may seem unusual for only two interviews to be conducted in phase 1. We operated under the parameters of this new approach, called the one-interview method, in which there is only one interview per designer or user group. This method purports that this is a sufficient start to understand the same or different mental models of the designer and user groups involved. Hence, we conducted only one interview per group, meaning in our case, two interviews (1 data provider, 1 data requester) in total. Then, we validated the results of the two interviews with data from the second phase (the usability study) to ensure that the one-interview method is, in fact, a quick and effective method for healthcare research organisations to uncover the main problems in the process. The institution is in the process of developing a web application that aims to automate the process of requesting healthcare data while adhering to the established data governance policies. Thus, in the second phase, we utilised the opportunity to conduct a usability study of a simulated model of the web application during its development phase (Albert & Tullis, Citation2013) by collecting data about mental models of 12 participants. The second phase served to ensure validity of the results from the first phase.
4.1. Context and participants
The context of this study was a School of Medicine at a Midwestern university in the United States of America. The institution is in the process of developing a web application that aims to automate the process of requesting healthcare data while adhering to the established data governance policies.
The participants identified for the study fulfilled the criteria of having experience in research with healthcare data. In the first phase, we adopted a narrative approach and recruited two participants using purposeful sampling (Creswell, Citation2013). For the second phase (the usability study), participants were recruited until data saturation was reached. Out of 50 participants recruited for the study, 12 participants (58% female) were finally enrolled in the second phase, which was sufficient to identify a minimum of 82% to 90% of usability problems (Faulkner, Citation2003). The age range of enrolled participants was from 26 to 64 years old with an average age of 40 (see ). The governance committee was composed of one data provider assisted by a software engineer for managing data accessibility, and both members were included in the study for collecting data in the second phase.
Table 2. Demographic details of the participants.
4.2. Data collection
In the first phase, individual in-depth interviews were conducted with identified users using a narrative approach (Creswell, Citation2013). IRB approval and participants’ consent were obtained before data collection. A semistructured interview protocol was applied to understand the mental models of data provider and requester regarding their workflows with the data governance and data accessing process. The interview protocol focused on four main parts that included questions about the user’s interaction with the system, potential difficulties, user opinion, and user reflection. The interview questions are listed in Appendix A. The interviews were conducted at user locations in the presence of an interviewer and an observer. Each session lasted for 60 to 90 minutes and was video recorded.
Such interview questions help to uncover the mental models. The interviewer can visualise the hidden mental models (the user’s understanding) by asking those questions. Then it becomes part of the discourse of the same or different understandings of the same process. If there are different understandings of the same data governance process (visualised by the means of mental models), the designer or data provider can start to improve the process and the data governance system. That’s how the questions can be used to understand the inherent challenges and improve the technical system and workflow or processes.
To validate the findings from the first phase, we conducted a usability study of the simulated model of the first prototype of the web application with 12 participants in the second phase. The usability study involved a multimethod approach comprised of semistructured interviews (Creswell, Citation2013), participant observation, task-based usability tests with think-aloud (for two tasks) (McDonald et al., Citation2012), Single Ease Questionnaires (SEQ) (Sauro, Citation2018), and System Usability Scale survey (SUS) (Bangor et al., Citation2008). SEQ is a seven-point rating scale (1: very difficult; 7: very easy) provided to the users after they complete a task to assess task difficulty (Sauro, Citation2012). Usability sessions were conducted in the presence of a test moderator and an observer using Morae software. Morae software basically records how a participant interacts with the system under study; the participant gets predefined tasks that s/he then conducts with the help of the system. These tasks mirror the main system goals. In addition, surveys can be integrated into Morae software that guides the participant process (Kim et al., Citation2012; Zhang et al., Citation2002). In our study, Morae measured the participants’ time on task, and collected data on surveys and questionnaires, such as SEQ for perceived task difficulty and SUS for user satisfaction. Each session lasted for 60 to 75 minutes. For the usability test, participants were asked to think aloud while completing two tasks on the system. The first task was to create and submit a data request and the second task was to review a submitted request. The observer made notes on participants’ behaviour and verbal responses and manually graded their task completion. Task completion was graded on a two-point scale: completed with ease (2 points), completed with difficulty (1 point), or failed to complete (0 point). Written consent was taken from the participants at the beginning of the session. Sessions were video recorded and transcribed in English. We used multiple methods and instruments to generate a robust set of triangulated data to identify problems in the process of data accessibility with certainty.
4.3. Data analysis
Interview data collected in phase one were transcribed and analysed using a sociotechnical modelling method (Herrmann, Citation2009; Herrmann & Loser, Citation1999) inspired by the Sociotechnical Walkthrough (STWT) (Goguen, Citation1994; Herrmann et al., Citation2007). The STWT method is a systematic inspection of the communicative interaction between the organisation and its people, processes, and technical structures graphically represented as a sociotechnical concept through a semiformal modelling notation, known as SeeMe (Herrmann et al., Citation2007). SeeMe facilitates visualisation of complex decision-making software systems through multiple perspectives of its stakeholders and facilitates depiction of uncertainty and incompleteness in user workflows (Goguen, Citation1994; Herrmann, Citation2009; Herrmann et al., Citation2000). Two researchers, including a sociotechnical expert, reviewed and analysed the interview data several times, followed by creating a graphical representation of the process of accessing healthcare data using basic elements of the SeeMe tool, i.e., roles (e.g., end user, social aspect, relations), activities (e.g., change, completing task), and entities (e.g., documents, tools, computer systems) (Herrmann, Citation2009).
In the second phase, a usability study comprised of quantitative and qualitative data which were analysed by two researchers using multiple methods. Usability of the application was measured in terms of task effectiveness (task completion success rate) and efficiency (time on task) (Preece et al., Citation2019), as calculated by Morae software (Kim et al., Citation2012). Morae data was cross validated by the data collected by the observer who tracked time on task through a stopwatch and task completion through manual grading (see section 4.2). Finally, descriptive statistics was used to calculate mean and range values for the overall quantitative data.
Qualitative data consisted of participant observation, interviews, and think-aloud responses. We analysed the interview data using open coding, followed by category development to identify higher-level concepts (Corbin & Strauss, Citation2008), such as a lack of process awareness and communication issues. For usability problems, first we identified the total number of problems detected through participant observation and think-aloud, followed by categorisation of the problems into layout, terminology, data entry, and comprehensive and feedback problems (Van Den Haak et al., Citation2003). Final interpretation of results was reviewed by a usability expert to establish interrater reliability. Data analysis was performed concurrently with participant recruitment and enrolment of new participants continued until saturation of identified problems was achieved. When no new problems were identified by the participants, we ended the recruitment. Methods triangulation was used to ensure reliability by analysing qualitative data collected from phases one and two together with quantitative data collected in phase two to uncover meaningful information related to user behaviour and perceptions (Thurmond, Citation2001).
5. Results
In this section, we present the process of governance and accessibility of big healthcare data, as perceived by both the requesters and the providers. We begin by describing the data accessibility process as established by the governance committee from the perspective of the data provider, which serves a baseline model, and later compare it with the mental model of the data requester. As results show, there are differences in the shared understanding of data accessibility between data provider and data requester, which make it difficult for the data requester to utilise the benefits of accessing data for their research purposes in a timely manner. To validate the results obtained from the one-interview mental model method, we later present the usability study results, and compare the results from the one-interview method with the usability study that was done with a larger population.
5.1. Data governance process: The data provider’s mental model
The data provider was a member of the Research Data Oversight Committee (RDOC) and acted as research data broker at the institution, responsible for data governance and request management. He described four categories of health data query and extraction for research purposes: (a) de-identified aggregated patient count, (b) de-identified row level patient data, (c) limited dataset, and (d) identified dataset. While the first two categories did not require an approved HIPAA waiver of authorisation or IRB approval, the last two categories required both. According to the data provider, health data was accessed for research purposes using two pathways: (a) using the I2B2 (Informatics for Integrating Biology and Bedside) web-client tool for self-service data queries and extraction and/or (b) requesting data queries and extraction through the data broker service by submitting the research data request form. The self-service data queries were administered through the I2B2 access control mechanism and were only allowed for de-identified data extraction that does not require a HIPAA waiver or IRB application. However, limited and de-identified data requests were mandatorily channelled through the research data broker service. Both processes were established as part of the research data governance process at the institution.
The data provider described the process of requesting healthcare data through the research data broker service in detail. illustrates the seven-step process for requesting data, as established at the institution. The researcher submits the research data request form through the School of Medicine’s website (step 1) and the submission is verified by an administrator (step 2). The request is reviewed by RDOC for data security and privacy standpoints if the request is related to limited or identified data (step 3). There are no review requirements for the de-identified data requests. Then, the request is assigned to relevant institutional designated data broker personnel for building the queries and extracting the datasets from the research data warehouse platforms (step 4). The data broker communicates with the study team (including the data requester) for clarifications required in extracting the right dataset (step 5). Finally, the dataset is delivered to the study’s Principal Investigator (PI) (step 6). The data request fulfilment and dissemination of satisfaction feedback survey is documented for quality improvement purposes (step 7).
Figure 2. Requesting data queries and extraction through the data broker service by submitting the research data request form. (RDOC = Research Data Oversight Committee).
The data provider shared his experience and challenges with the current process. From the lens of the data provider, the data request process was a rather manual process. The data provider (p. 1) stated, “We do not have the most sophisticated system of doing this. So, it is kind of a semiautomated process. Communication is the key in the process”. Communication among RDOC members, the data requester, and other stakeholders was mostly ad hoc via emails, and RDOC members communicated with stakeholders several times for clarification of the request and to ensure privacy and security of data delivery. The data provider shared, “They [RDOC members] can put their comments on the submitted request”. The verification and review steps involved a lot of back-and-forth communication and long waiting periods for replies or clarification stretching the approval process to several weeks and months. In this regard, the data provider (p. 1) shared an example,
We could potentially ask for a due date from the researchers, but the challenge is they may not have a reasonable date. So, we do not have that component in the form. Instead, we try to communicate with them to try to understand the urgency and timeline.
The data provider experienced a lack of control over the communication process. According to the data provider, the PIs of the projects were not included in the communication process and were not aware of actions pending on their end. In this regard, P1 stated,
There is a study coordinator [data requester], PI, and data provider. You expect the person who has requested for data would communicate everything to the PI, but this may not happen. This is not good. PI of a project may be blinded out from a communication between data requester and data provider. Sometimes we respond to the study coordinator [data requester] that the PI needs to take an action on it. We later come to know that PI was not communicated about it. Once the communication is out of our outbox, we have no control over whether an action will be taken over it. The question is how to make sure that the responsible person who is supposed to take the next action will do the work?
Second, the data provider shared communication challenges due to delayed responses from the data requester and PI of the study, which slowed down the entire process of request fulfilment. For instance, he stated, “When we have questions, we send emails to the researcher, but the researcher does not respond back in a timely manner … they may not come back with an answer for a month”. The process of data extraction was extremely long and took several weeks to months to fulfil a request and deliver the data. In this regard, data provider expressed, “Actually, the data extraction takes most of the time. Review process goes in parallel”. According to the data provider, data extraction typically involved cleaning huge volumes of large datasets (minimum 1000 entries) sourced from multiple sources, which may mean it takes several weeks to deliver de-identified error-free data to the data requester. Furthermore, the data provider had to prioritise fulfilment of urgent requests (mostly funded projects) which had a limited time to publish results. To avoid queuing of projects and long periods of delay for basic research or non-urgent studies, the data provider had to fetch timelines from data requesters through emails. This email communication caused additional delay.
Third, the data provider pointed out challenges related to authorisation of data requesters which hinders request fulfilment process. P1 stated, “When someone is requesting data, we do not exactly know if that person is on the approved IRB paperwork. PI is always on IRB paperwork and has the right to decide whom to give access for data”. According to the data provider, a data requester might be a member of the study team requesting the data on the PI’s behalf but might not be authorised to receive the data. The data file is shared with the requester only after his/her authorisation is confirmed. In such cases, confirming requester’s authorisation consumes additional time as it is performed through email communication. In this regard, the data provider stated,
Whenever you have the service model where communication is the key to get the best user satisfaction … communicating the information on time for request tracking is the key part. With multiple people, an integrated platform for communication is always better, instead of having ad hoc communication or email communication … a dashboard where people can see what is pending for them or automatic reminder mechanism.
5.2. Data governance process: The data requester’s mental model
First, we present the data requester’s mental model of the process, as the user sees it, and later compare the provider and requester models. We argue later that this simple one-interview mental model method helps to reveal the problems with the process of accessing healthcare data at organisations, thereby providing an effective tool to the data provider to improve the process.
As discussed in the previous section, the School of Medicine shared access to the electronic health record data with researchers or clinicians for IRB approved research studies while maintaining institutional governance. While the processes of request validation and data extraction take an exceptionally long time, sometimes more than three months, data requesters and data providers are mostly unaware of the issues on the other’s side. In , using SeeMe modelling, we illustrate the data requester’s workflow, as described by the data requester (p. 2) in the interview. The data requester and provider (members of RDOC) are represented by red ovals (roles/users). The technology or system features used by the School of Medicine for data accessibility is highlighted in blue. The yellow boxes represent the activities of the users.
Figure 3. Data requester mental model of the data governance process.
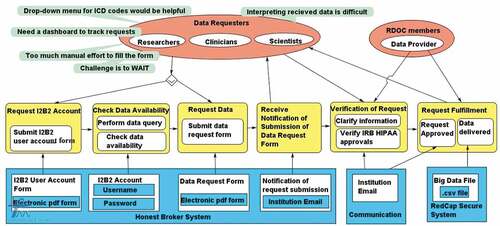
As described by the data requester, the process has six main activities, shown in order from left to right in the yellow boxes in . First, new users request an I2B2 account by filling an electronic PDF (Portable Document Format) form (Request I2B2 Account). Second, after users receive the username/password in a week’s time, they run a query via I2B2 to check data availability in the system (Check Data Availability). Third, if sufficient data is available for research, users proceed to fill an electronic PDF data request form integrated in the system (Request Data). Fourth, the user receives notification of request submission. Fifth, users receive email communication from the data provider team regarding clarification and additional information for their research study. Sixth, upon verification of request, users receive email from RDOC confirming approval of request. The approval process may take a minimum of four weeks. Seventh, users receive the data file through a protected network, which may take a minimum of an additional four weeks.
While this process sounds easy, there are several difficulties that the requester experienced and shared, as outlined in following sections. The analysis of the interview with data requester yielded two major challenges which lead to the difference in mental models of data requesters and providers: (a) lack of process awareness and (b) communication issues.
5.2.1. Lack of process awareness
According to the data requester, users have trouble understanding the first step of the data request: creating an I2B2 account. The data requester, P2, explained,
If they are experienced researchers and are doing several projects, they may directly request the data. For new and inexperienced researchers, first step is to request an I2B2 account. They may not be aware of this. Once we have the account, then we have access to the data request.
Furthermore, it is difficult for new users to understand the terminologies used in the electronic PDF forms. The data requester stated, “If someone is a new user, they would want to know what ICD code [International Classification of Disease] they need to enter in the form. When we have to type exact information, we make mistakes”. Most importantly, P2 pointed out that after he submitted the data request, the process was more like a black box for him.
Once I submit the data request then it is an internal process. It goes through some committee, which I don’t know. They need to approve it. I don’t know how they are extracting the data.
The electronic PDF forms in the system are not intuitive and there are no examples to follow or to help users understand the committee’s expectations from users. There is no way for users to understand how a requested dataset semantically qualifies as identified or de-identified. According to the data requester, knowledge of ICD codes and other medical terminologies are important to request correct data and be able to comprehend delivered data. As an example, data requester shared his experience. “It took me nearly six months to be able to understand what the terminology meant in the csv file shared by the data providers”. He further suggested,
If there is a drop-down menu option for filling the ICD codes, it would be very beneficial. It would help us avoid mistakes. If a sample form can be uploaded on the site as an example guiding users what format of information is expected in the blank fields, it will be very helpful for the users.
5.2.2. Communication issues
Communication formed an extensive part of the request fulfilment process. According to the data requester (p. 2), after submitting the request, users need to communicate back and forth several times with the data provider through emails to clarify their request. P2 shared his experience.
The communication majorly revolves around what data I need, they (data provider) will ask questions and I reply what I want to study. Then they ask more questions to narrow down the dataset to my specifications, for example, demographic information. That time we need to be careful to ask for what we need. Last time I asked for image data for glaucoma patients and my request was rejected. I got the answer that image data is not a de-identified dataset.
The issue in the current communication practice lies in the difficulty of explaining the details and specifics or describing the data requirement via email. This has negative consequences for the data requesters as it leads to lack of interest for him/her or loss of project funding because of time-sensitive issues.
The data requester pointed out that users cannot track the status of their request themselves and the wait period until the next communication from data provider is very long, often more than two months. There is also a long delay in request fulfilment, often extending to more than three months. The data requester said in regard to submitting a form, “ … it may take four weeks for request verification. We get an email from the assistant if the request is approved. From there onwards, it may take another four weeks for them to extract and send the data”. According to the data requester, delays in request fulfilment negatively affects the research activities. Moreover, not all studies are funded and often researchers want to conduct self-study. He said,
Getting a research idea is a passing thing, when we read something, we get excited and we approach the institution to get the data. If getting the data takes two to three months, you lose interest. If data process is happening in a week’s time, you will follow it passionately and may get a publication.
5.3. Data governance process: Comparing the two mental models
As we compare the mental models of data requesters and providers in regard to their understanding of accessing healthcare data, we find multiple gaps. To begin with, the data requester understands creating an I2B2 account to be the first step to request data, followed by submitting a PDF data request form to the data provider. Whereas, according to the data provider, I2B2 accounts are created for self-service where users can extract de-identified data themselves for their research studies as no approval is required for de-identified data. According to the data provider, a request has to go through them only if users require access to an identified dataset. This suggests that data requesters are not fully aware of the process of requesting data at the institution. Moreover, the data requester shared in the interview that users are not aware how their requested dataset qualifies for identified or de-identified data.
After receiving a data request, the data provider stated the next steps were request verification and approval, followed by delivery of data to the PI and a request for feedback of the service provided. Data providers communicate via email with the requesters when they require clarification of the request. However, the data requester emphasised that users are not aware of the steps that follow their submission of a data request form. According to the data requester, once they submit the PDF form, the rest of the process is like a black box for them. They do not know whether a committee approval is needed or not, nor how a request is verified, approved, and fulfilled. While the data provider interprets the process as simple, the data requester finds it challenging to wait for email communication from the providers as there is no other way to track the status of a submitted request.
5.4. Usability study results
To validate the approach of the one-interview mental modelling method, we used the differences in the mental models of the data provider and requester for a traditional usability evaluation of the simulated model of the first prototype of the web application being developed. At the time of the study, the scope of the first prototype was enabling data requesters (users) to submit their request by filling their requirements in a web-based form (see ).
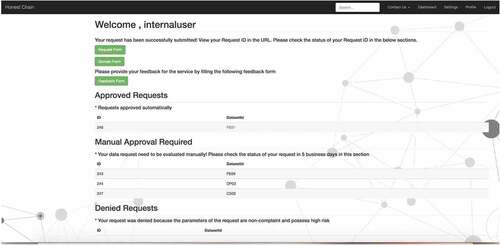
Figure 4. Simulated model displaying the request form for users.
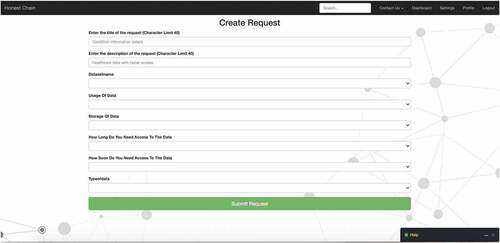
Once the request was submitted, the model evaluated the risk of request. The model automatically approved no or low risk requests and displayed the updated status of the request on the dashboard (see ). Users could click their request id to view the results (dummy output). Total expected time to receive a response for no or low-risk requests was estimated as 60 seconds or lesser. High-risk requests evaluated by the model were put on hold for manual approval process and non-compliant requests were displayed as denied. At the time of the study, there was no time duration estimated for receiving a manual approval for high-risk requests since it was out of scope for the first prototype of the application. However, when compared with the previous process, the time difference between submitting a request and receiving a response from the system was way lesser as the data requesters interviewed for both the phases of the study, told us that the previous process took weeks to months to receive a response or request approval from the data providers.
Figure 5. Dashboard displaying status (Approved/Denied/Manual Approval Required) of submitted requests.
The following usability study’s results indicate that the one-interview mental modelling method and the usability study highlight the same issues of the data request process. summarises the quantitative data.
Table 3. Descriptive statistics for quantitative usability data.
Effectiveness and efficiency. Task 1 (create and submit a data request) was a difficult task for the participants and average time taken to complete the task was 19 minutes. According to the observer’s rating, all 12 users completed Task 1 but with difficulty and all 12 participants failed to complete Task 2 (review the status of your submitted request). For Task 2, the participants were asked to review the status of their submission by locating their submitted data request through a Request ID. All 12 participants were unable to find the Request ID of their submitted data request, and were therefore, unable to review the status of their request. The average time taken by the participants to give up Task 2 was 4.78 minutes. It was surprising to observe that for the SEQ rating (user rating of task difficulty where 1: very difficult and 7: very easy), the majority rated the tasks as easy. Task 1 was rated as easy by 58% (7/12) of participants and 67% (8/12) rated Task 2 as easy. The results indicate a gap between easy task design (it looked easy) and difficulty in actually completing the task as the users were not able to achieve the goal to request the data successfully.
User satisfaction. The average SUS score for the whole process was 66.75, which rates the system as marginally acceptable (scale 0–100; scores above 68 are considered above average) (Bangor et al., Citation2008). While 42% (5/12) rated the system as below average (SUS score range was 27–60), 58% (7/12) rated it above average (SUS score range: 70–97).
While the simulated model estimated a maximum of 5 minutes to submit a request and 60 seconds or lesser to receive a response from the system (Approved/Denied/Manual Approval Required) for the submitted requests, the usability test results show that participants took an average of 20 minutes to fill the request form and approximately 5 minutes to review their request status. Following qualitative analysis of the usability study explains the reasons for the challenges experienced by the participants.
However, when comparing this new model with the previous process in place, the results show a time benefit as the new model simulated 20 to 30 minutes maximum to get a response from the system while the previous process took a minimum of 4 weeks to submit a request and several months (in some cases, more than 10 months) to receive a response back from the data providers depending on the complexity of the data request.
Qualitative analysis. Based on participants’ responses during the tasks with think-aloud and observation and information collected from the reflective follow-up interview, we grouped usability issues into five categories (Van Den Haak et al., Citation2003): (a) layout problems, (b) terminology problems, (c) data entry problems, (d) comprehensiveness problems, and (e) feedback problems (see ).
Table 4. Usability problems detected via participant responses.
Summarising participants’ feedback from the follow-up interviews, several aspects of the process of request fulfilment that lacked clarity emerged. While the participants understood that they had to complete and submit a form to request data, they had trouble understanding how the form impacted their data request. In this regard, P10 expressed that she “ … was not sure what request was I making, later understood that was for data request”. P5 shared a similar perception.
To me, the form [application] is really just about getting the ball rolling so that you’re starting a conversation with somebody. How do I go about getting the data extracted? I am curious what is it that they need from me to make it easier.
Participants expected to see information on how the request will be verified, processed, and approved. They were not sure if the description they provided in the form fell in the approved category or not. For instance, P9 expressed, “I don’t know what the resulting data format will be … what I receive in comparison to what I requested”. Participants had trouble understanding resulting output. In this regard, P3 stated,
What’s the universe of the data? So, for one patient, is all their information in a row. That’s not how the data is. So, if the data isn’t like that. What is it like … It’s hard to understand what constitutes the data if I can’t see?
After completion of the form, participants hit the submit button on the screen. At this point, participants did not receive any system response and were unable to locate the ID of their submitted request. According to the participants, the process appeared to be a black box to them, and they did not know what their next steps were. Participants did not know if they would receive any communication from the data providers regarding their requests. For instance, P2 asked, “Will I receive an email when the request has been responded to?” P5 shared a similar experience. “I did not receive any confirmation email regarding acceptance of my submission and the timeline of when I will get to know the results”. Participants were not able to find information on their submitted request and had trouble understanding their request status. In this regard, P11 expressed, “I wanted to see the status of my request, what I have filled, is it correct or not and by what date will I receive a response. I want to see an expected date of receiving the data”.
In summary, usability results in the second phase show a lack of understanding of the process of submitting a data request successfully. The participants had trouble understanding the process of verification, approval, and fulfiling of a data request which validates our findings from the first phase. Overall, the participants pointed out the need to have a clear understanding of the process of request fulfilment to be able to efficiently request data with minimum effort and time.
6. Discussion and Implications
6.1. RQ1: In what ways do the two user groups (data provider and data requester) have synergistic or different understanding of the current process of requesting and accessing healthcare data in a multi-organisational environment?
The current process of data access at the organisation encompasses a formal governance structure and a designated committee for manually auditing the authorisation of data requesters and checking compliance of health data security standards (Khatri & Brown, Citation2010). Results from the first phase of the study showed a gap in the understanding of the data access process from the data provider and data requester perspectives. According to the data provider, there exists four categories of datasets, namely, (a) de-identified aggregated patient count, (b) de-identified row level patient data, (c) limited dataset, and (d) identified dataset. Only categories (c) and (d) have to be administered through the seven-step process of the data broker service (via the data provider) where an electronic PDF data request form has to be submitted to the RDOC committee by the study team. While the data provider interprets the process as simple, the data requester found the process of accessing data very complex and was not aware whether a request needs approval, and if it does, how it is verified, approved, and processed (Jonassen, Citation1995). There is a lack of understanding in the process of creating the data request. Through the one-interview method of mental models, we were able to identify the gaps in the understanding of the synergistic process between the data provider and the data requester. The usability results validated our findings from the first phase and confirmed that data requesters have expectations regarding the clarity of the process of accessing protected healthcare data.
6.2. Challenges in the current data governance process from both the data requester and data provider perspectives
Lack of understanding the process: In our study, we identified lack of understanding of the process of accessing healthcare data as a major challenge for data requesters. Our usability results further validate this finding. Lack of guidelines and clear instructions cause ambiguity at the data requester’s end (Nielsen, Citation1994). Data requesters were not aware of the criteria of identified and de-identified datasets. Moreover, the terminology used in the request form and the delivered dataset was found to be complicated for data requesters to meaningfully comprehend output. According to Wang et al. (Citation2018), there is a need to train stakeholders with skills to make appropriate use of healthcare data. They suggest hiring employees with data analytic skills or providing data analytics training courses to their employees to help data requesters use data in a meaningful way.
Communication issues: In this study, communication emerged as a key challenge in the process of data accessibility. The data requesters pointed out their struggle with long periods (minimum four weeks) of back-and-forth communication to explain their data requirements with data providers. Similarly, the data providers struggled to receive timely responses from the data requesters for request verification and approval. Furthermore, communication between the stakeholders was facilitated via emails. Once an email is sent, neither group had control over the communication process. Tse et al. (Citation2018) demonstrate that roles and standards for communication, escalation of issues, and data monitoring should be defined at healthcare institutions to improve efficiency of data governance practice.
6.3. Practical implications: How to apply the one-interview mental model method to address data governance process challenges in other institutions
In this study, we used a new method called the one-interview mental model method to suggest a simple and quick method for data providers or designers in healthcare organisations to use as a start in uncovering the central issues in their current data requesting practices. The new method uses one interview per user/designer group, which in our study meant only two interviews as there were only two user groups – the data requesters and the data providers. We validated the relevance and strength of the new method by conducting a usability study.
To analyse an existing data governance process (and to improve and simplify the data request process), this one-interview mental model method, here applied, can help to understand the differences of the two different user groups (data provider and data requester). It is a simple method to use. Visualise the process by first asking the data provider to draw the process on paper, followed by interviewing him or her how he perceives the process. Then ask the data requester to draw the process of data accessibility, followed by interviewing him or her about how s/he experiences the process in reality. This method is based on the following premises.
The data provider has a model in their mind of what the process looks like (i.e., a mental model).
The data requester also has a mental model of the process in their mind.
Provider and requester models may be the same or may differ partly or fully.
The potential differences of the mental models give options on how to improve the data request fulfilment and governance process.
This approach can be used for data governance processes and is a very simple method to quickly reveal the misunderstandings and problems of the existing process. In the following, we enlist the five most important interview questions followed by a short paragraph on how to use the approach in the practice.
(User interaction with the system) The data request is a process, and there are some technologies or technical system design approaches to support the process (e.g., PDF files, web application). Think back to the last time you used the system to request data. Can you describe the activities you did with the system? Please describe in detail. Please describe the process from the start to the end (what did you do first, then next, etc.).
(System’s gaols and user responsibilities) According to you, what is the goal of the system? What are your roles and responsibilities associated with the system?
(Potential difficulties of use, if any) Based on the activities you just mentioned, when interacting with the system, do you have any confusion or uncertainty with the system? How easy or difficult is it for you to accomplish your goals with the system? Describe how you resolve these challenges (if any).
(Additional user opinion) How do you describe your overall experience with the system? Is there anything you like or dislike about the system (if any)? Is there anything you want to do differently with the system?
(Probe user reflection) Is there anything about your experience that you want to share with us that we have not asked you today?
A narrative style free-flowing interview can be conducted with the data requesters and data providers using the above open-ended interview questions. While the interview is unstructured, the interviewer must be prepared to gather information on specific issues. The interview is designed such that it can be conducted individually with each participant or together as a focus group with representatives from each group. Later, data analysis is performed using a modelling tool to illustrate the understanding of the process by each group. Areas of problems, uncertainties, and confusion can be annotated in the illustration. Participants’ quotes can be thematically analysed to support the illustration.
6.4. Limitations
Because of ethical considerations, we do not name the medical school we studied. We make the reader aware that some issues might be specific to that entity. We acknowledge that there can be additional issues of data accessibility in other contexts and other medical schools beyond or different than the issues we found. Although the results show the potential flaws of the current practice, they may not apply to everyone. However, the main message is that the one-interview method (applied in phase 1), nevertheless, is usable for all medical schools as our results indicate validated data (in the second phase). Hence, we argue that the method can be used by everyone to detect the individual issues in any protected data request process. Transferring of findings to a context other than healthcare may be tentative and should be applied carefully.
Results from qualitative interviews may not be generalisable. Nevertheless, we validated our findings through the usability study using multiple methods. We hope to reduce any limitation of sample size through rich analysis of quantitative and qualitative data.
It is also important to note that the interviewer may have a bias that may affect the validity and reliability of the findings of the study. Hence, for the accuracy of the findings, the interviewer needs to maintain a balanced attitude during the interview, avoid emotionally loaded words (e.g., good system, bad system), use open-ended questions, and be careful when summarising as it may lead to suggesting approval or disapproval of the content (Salazar, Citation1990).
7. Conclusion
Data applications in the healthcare research community target data requesters/consumers and data providers/custodians who are increasingly working synergistically towards data accessibility to contribute to the research field for finding solutions to critical medical problems (Groves et al., Citation2013). Healthcare organisations feel duly responsible for the security of sharing health records with data consumers for ethical reasons. Therefore, data governance is seen as the first step before providing access to data analytics (Groves et al., Citation2013; Patil & Seshadri, Citation2014). However, accessing healthcare data through the established governance structure at an organisation is a daunting task for data requesters. Through our study in an exemplary protected data governance environment, we found that data requesters experience a lack of understanding of the process of requesting and accessing data. Previous studies have pointed to the dynamic nature of data governance for healthcare institutions and suggest that “data governance should not be considered a one size fits all” (Reeves & Bowen, Citation2013, p. 86).
Our study suggests a simple method to identify problems in the existing data governance practices at healthcare institutions to help them improve the governance and research practices. Our proposed one-interview mental modelling method is based on five interview questions and is a simple and easy method to apply for anyone who takes part of data governance in an organisation. By applying this method as described here, our study found communication issues and process awareness issues that suggest the necessity of a robust data governance and communication system for request fulfilment in the future (e.g., using digital technologies to support the process). Other organisations may find similar or different issues. In all cases, the results can be used as a start to improve the current data governance practices. The understanding of the basic process of data accessibility can be used as a foundation for further studies by researchers working on improving manual processes (human in the loop) and developing semiautomated (human on the loop) or fully automated (human out of the loop) systems for data accessibility processes in healthcare organisations.
Acknowledgments
This work was supported by the National Science Foundation (NSF [OAC-1827177]). Any opinions, findings, and conclusions or recommendations expressed in this publication are those of the author(s) and do not necessarily reflect the views of the National Science Foundation. We are thankful for the participants for sharing their workflows and practices with us.
Disclosure statement
No potential conflict of interest was reported by the author(s).
Additional information
Funding
References
- Al-Badi, A., Tarhini, A., & Khan, A. I. (2018). Exploring big data governance frameworks. Procedia Computer Science, 141, 271–277. https://doi.org/10.1016/j.procs.2018.10.181
- Albert, B., & Tullis, T. (2013). Measuring User Experience. Morgan Kaufmann Publishers.
- Alofaysan, S., Alhaqbani, B., Alseghayyir, R., & Omar, M. (2014, March). The significance of data governance in healthcare. In Proceedings of the International Joint Conference on Biomedical Engineering Systems and Technologies-Volume 5 (pp. 178–187). SCITEPRESS-Science and Technology Publications, Lda.
- Ancker, J. S., Kern, L. M., Abramson, E., & Kaushal, R. (2012). The Triangle Model for evaluating the effect of health information technology on healthcare quality and safety. Journal of the American Medical Informatics Association, 19(1), 61–65. https://doi.org/10.1136/amiajnl-2011-000385
- Bangor, A., Kortum, P. T., & Miller, J. T. (2008). An empirical evaluation of the system usability scale. International Journal of Human–Computer Interaction, 24(6), 574–594. https://doi.org/10.1080/10447310802205776
- Colijn, C., Jones, N., Johnston, I. G., Yaliraki, S., & Barahona, M. (2017). Toward precision healthcare: Context and mathematical challenges. Frontiers in Physiology, 8, 136. https://doi.org/10.3389/fphys.2017.00136
- Corbin, J., & Strauss, A. (2008). Basics of qualitative research: Techniques and procedures for developing grounded theory (3rd ed.). Sage Publications.
- Creswell, J. (2013). Qualitative Inquiry & Research Design: Choosing Among Five Approaches (3rd ed.). Sage Publications.
- Dhir, R., Patel, A. A., Winters, S., Bisceglia, M., Swanson, D., Aamodt, R., & Becich, M. J. (2008). A multidisciplinary approach to honest broker services for tissue banks and clinical data: a pragmatic and practical model. Cancer: Interdisciplinary International Journal of the American Cancer Society, 113(7), 1705–1715.
- Faulkner, L. (2003). Beyond the five-user assumption: Benefits of increased sample sizes in usability testing. Behavior Research Methods, Instruments and Computers, 35(3), 379–383. https://doi.org/10.3758/BF03195514
- Feldman, B., Martin, E. M., & Skotnes, T. (2012). Big Data in Healthcare - Hype and Hope. Dr. Bonnie 360, https://www.west-info.eu/files/big-data-in-healthcare.pdf
- Goguen, J. A. (1994). Requirements engineering as the reconciliation of social and technical issues. In M. Jirotka & J. A. Goguen (Eds.), Requirements engineering: Social and technical issues (pp. 165–199)). Academic Press Professional.
- Groves, P., Kayyali, B., Knott, D., & Kuiken, S. V. (2013, January). The Big Data Revolution in Healthcare: Accelerating Value and Innovation. McKinsey & Company. http://repositorio.colciencias.gov.co/bitstream/handle/11146/465/1661-The_big_data_revolution_in_healthcare.pdf?sequence=1&isAllowed=y
- Hantho, A., Jensen, L., & Malterud, K. (2002). Mutual understanding: A communication model for general practice. Scandinavian Journal of Primary Health Care, 20(4), 244–251. https://doi.org/10.1080/028134302321004926
- Herrmann, T. (2009). Systems design with the socio-technical walkthrough. In A. Whitworth & B. De Moore (Eds.), Handbook of research on socio-technical design and social networking systems (pp. 336–351). Idea Group Publishing.
- Herrmann, T., & Loser, K. (1999). Vagueness in models of socio-technical systems. Behavior & Information Technology, 18(5), 313–323. https://doi.org/10.1080/014492999118904
- Herrmann, T., Loser, K., & Jahnke, I. (2007). Sociotechnical walkthrough: A means for knowledge integration. The Learning Organization, 14(5), 450–464. https://doi.org/10.1108/09696470710762664
- Herrmann, T., Loser, K., & Moysich, K. (2000). Intertwining training and participatory design for the development of groupware applications. In Proceedings of PDC (pp. 106–115). Location: Publisher.
- Jagdish, H. V., Gehrke, J., Labrinidis, A., Papakonstantinou, Y., Patel, J., Ramakrishnan, R., & Shahabi, C. (2014). Big data and its technical challenges. Communications of the ACM, 57(7), 86–94. https://doi.org/10.1145/2611567
- Jonassen, D. H. (1995, October). Operationalizing mental models: Strategies for assessing mental models to support meaningful learning and design-supportive learning environments. The first international conference on Computer support for collaborative learning, Proceedings of CSCL (pp. 182–186). https://doi.org/10.3115/222020.222166
- Khatri, V., & Brown, C. V. (2010). Designing data governance. Communications of the ACM, 53(1), 148–152. https://doi.org/10.1145/1629175.1629210
- Kim, M. S., Shapiro, J. S., Genes, N., Aguilar, M. V., Mohrer, D., Baumlin, K., & Belden, J. L. (2012). A pilot study on usability analysis of emergency department information system by nurses. Applied Clinical Informatics, 3(1), 135. https://doi.org/10.4338/ACI-2011-11-RA–0065
- Malone, T. W., & Crowston, K. (1990). What is coordination theory and how can it help design cooperative work systems? CSCW ‘90: Proceedings of the 1990 ACM conference on Computer-supported cooperative work, 357–370, https://doi.org/10.1145/99332.99367
- McDonald, S., Edwards, H. M., & Zhao, T. (2012). Exploring think-alouds in usability testing. An International Survey. IEEE Transactions on Professional Communication, 55(1), 2–19. https://doi.org/10.1109/TPC.2011.2182569
- Moreland, R. L. (1999). Transactive memory: Learning who knows what in work groups and organizations. In Thompson L., Levine J., & Messick D. (Eds.), Shared Cognition in Organizations: The Management of Knowledge, (pp. 3–31). Psychology Press
- Murdoch, T. B., & Detsky, A. S. (2013). The inevitable application of big data to health care. American Medical Association (JAMA), 309(13), 1351–1352. https://doi.org/10.1001/jama.2013.393
- Nambiar, R., Bhardawaj, R., Sethi, A., & Vargheese, R. (2013, October). A look at challenges and opportunities of big data analytics in healthcare. In Proceedings of 2013 IEEE International Conference of Big Data (pp. 17–22).
- Nielsen, J. (1994). 10 usability heuristics for user interface design. Nielsen Norman Group. Retrieved September 2020, from https://www.nngroup.com/articles/ten-usability-heuristics/
- Norman, D. (2013). The design of everyday things: Revised and expanded edition. Basic books.
- Norman, D. A. (1988). The psychology of everyday things. Basic Books.
- Okal, C. O., & Loice, H. T. (2019). Usability of big data analytics Within clinical decision support systems. International Journal of Engineering Applied Sciences and Technology, 4(5), 64–73. https://doi.org/10.33564/IJEAST.2019.v04i05.010
- Patil, H., & Seshadri, R., (2014, June). Big data security and privacy issues in healthcare. In The Proceedings of the IEEE International Congress on Big Data (pp. 762–765)
- Preece, J., Sharp, H., & Rogers, Y. (2019). Interaction Design: Beyond Human-Computer Interaction. John Wiley & Sons.
- Raghupathi, W., & Raghupathi, V. (2014). Big data analytics in healthcare: Promise and potential. Health Information Science and Systems, 2(3), 1–10. https://doi.org/10.1186/2047-2501-2-3
- Reeves, M. G., & Bowen, R. (2013). Developing a data governance model in health care: Although the term may be unfamiliar, data governance is a longstanding obligation of the healthcare industry. Healthcare Financial Management, 67(2), 82–87.
- Roschelle, J., & Teasley, S. D. (1995). The construction of shared knowledge in collaborative problem solving. In C. O’Malley (Ed.), Computer Supported Collaborative Learning (pp. 69–97). Springer.
- Salazar, M. K. (1990). Interviewer bias: How it affects survey research. Aaohn Journal, 38(12), 567–572. https://doi.org/10.1177/216507999003801203
- Sanders, D. (2013). 7 essential practices for data governance in healthcare. HealthCatalyst.
- Sauro, J. (2012). 10 things to know about the Single Ease Question (SEQ). Measuring U. https://measuringu.com/seq10
- Sauro, J. (2018). Using Task Ease (SEQ) to predict completion rates and times. Measuring U. https://measuringu.com/seq-prediction/
- Sreenivas, S., Ramchandran, N., & Ferrell, R. (2015). Quality of big data in health care. International Journal of Health Care Quality Assurance, 28(6), 621–634. https://doi.org/10.1108/IJHCQA-07-2014-0080
- Thurmond, V. A. (2001). The point of triangulation. Journal of Nursing Scholarship, 33(3), 253–258. https://doi.org/10.1111/j.1547-5069.2001.00253.x
- Tse, D., Chow, C. K., Ly, T. P., Tong, C. Y., & Tam, K. W. (2018, August). The challenges of big data governance in healthcare. In 2018 17th IEEE International Conference On Trust, Security And Privacy In Computing And Communications/12th IEEE International Conference On Big Data Science And Engineering (TrustCom/BigDataSE) (pp. 1632–1636). https://doi.org/10.1109/TrustCom/BigDataSE.2018.00240
- Valluripally, S., Raju, M., Calyam, P., Chisholm, M., Sivarathri, S. S., Mosa, A., & Joshi, T. (2019, January). Community cloud architecture to improve use accessibility with security compliance in health big data applications. In Proceedings of the 20th International Conference on Distributed Computing and Networking (pp. 377–380).
- Valluripally, S., Raju, M., Calyam, P., Lemus, M., Purohit, S., Mosa, A., & Joshi, T. (2019). Increasing protected data accessibility for age-related cataract research using a semi-automated honest broker. Modeling and Artificial Intelligence in Ophthalmology, 2(3), 115–132.
- Van Den Haak, M., De Jong, M., & Jan Schellens, P. (2003). Retrospective vs. concurrent think-aloud protocols: Testing the usability of an online library catalogue. Behaviour & Information Technology, 22(5), 339–351. https://doi.org/10.1080/0044929031000
- Verizon. (2019). Data breach investigation report. https://enterprise.verizon.com/resources/reports/2019-data-breach-investigations-report.pdf. Accessed September 2020
- Wang, Y., Kung, L., & Byrd, T. (2018). Big data analytics: Understanding its capabilities and potential benefits for healthcare organizations. Technological Forecasting and Social Change, 126, 3–13. https://doi.org/10.1016/j.techfore.2015.12.019
- Williams, K., & Colomb, P. (2020). Important considerations for the institutional review board when granting health insurance portability and accountability act authorization waivers. The Ochsner Journal, 20(1), 95–97. https://doi.org/10.31486/toj.19.0083
- Zhang, J., Patel, V. L., Johnson, K. A., & Smith, J. W. (2002). Designing human-centered distributed information systems. IEEE Intelligent Systems, 17(5), 42–47. https://doi.org/10.1109/MIS.2002.1039831
Appendix A
Interview Questions
Part 1 - User interaction with the system
1. Think back the last time, when you used the system, can you tell me: what did you do with the system? So, you came to your office, and then you did what first (for example, you clicked where to open the system and next step was to do what)? Please describe in detail.
Prompts (to probe the interviewee for details):
Activity related question
Describe your activities with the systems.
What are the primary activities that you need to use the system for?
Do you have to wait for responses? How long is it usually? How long do you expect the system to take for the activity you described?
Roles /access related question
What is your role and responsibilities?
What level or kind of access do you have within the system? What can you do and not do in the system (technical roles: for example, edited or just read files?)
System related questions
Describe the system. What is your main goal with the system?
Can you describe or show us how you use the system for the activity/activities you mentioned?
How long have you been using the system? On an average day, how much time do you spend with the system daily?
Do you receive alerts in the system? Under what circumstances do you receive these alerts? Do you find these alerts helpful? Under what circumstances would you want to receive an alert in the system?
Others involved?
When you are using the system, who else is using it? Is their access level different than yours? What level or kind of access do they have with the system?
Do you need to communicate or follow-up with others for this activity?
Part 2 - User’s experience in terms of difficulty of use
2. Based on the process you just mentioned, when interacting with the system, do you have any confusion or uncertainty on the system, or you encounter difficulties or not?
Prompts (to probe the interviewee for details):
How easy or difficult is it for you to complete the goals that you mentioned?
Do you encounter any difficulty with the activities you mentioned? If yes, what kind of difficulty? Is there anything that prevents you from achieving the goals? (Which ones?) How do you resolve these difficulties? How long does it take for these issues/difficulties to get resolved?
Do you have any flexibilities when using the system? Which ones?
Part 3 - User’s opinions
3. How do you describe your overall experience with the system?
Prompts (to probe the interviewee for details):
What do you like most about the system?
What do you like least about the system?
What do you want to do differently? Any recommendations?
Part 4 encourages users to reflect
4. What have we not asked you today related to the system or process that you think would be valuable for us to know?