ABSTRACT
Studies on cultural ecosystem services (CES) in urban forests using Public Participation GIS mapping are a well-established field of research. However, far fewer studies do exist that also illuminate perceived disservices, thus omitting an important part of human-forest relationships. Advancing knowledge on unpleasant places can promote outdoor recreation and help forest managers focus on disservices that matter. This study aims at spatially identifying people’s perceptions in urban forests with focus on unpleasant experiences. We elicited perceived disservices and CES spatially by collecting Public Participation GIS data (PPGIS) from city dwellers in three urban forests in Germany’s Southwest (755 respondents mapped 1552 places of disservices). We investigated relationships between sociodemographic characteristics and the number of mapped places using Spearman’s rank. We also explored the spatial concurrence between disservices and CES using Spearman’s rank. We identified a hierarchy of importance of forest visitors’ perceived dislikes. We revealed that negative perceptions of urban forest visitors originated broadly from people and their traces and rarely from the ecosystem according to existing ecosystem disservices typologies (EDS). We found a significant relationship between age and the number of mapped services. We found clusters of disliked places and correlations between disservices and CES, indicating that hotspots of CES in turn are also hotspots of disservices. We conclude that city foresters may best address disservices by advancing guidance-concepts for spatial movements of urban forest visitors within the forest to avoid conflicting clusters of various stakeholders. Our results may help city foresters to better manage both the forest and visitors’ various interests.
EDITED BY:
1. Introduction
Since 2003, when the Millennium Ecosystem Assessment typology was agreed upon by many researchers around the globe, numerous studies have provided insights into urban nature’s invaluable benefits for human health and well-being (Bieling et al. Citation2014; Pietilä et al. Citation2015; Völker et al. Citation2018). Urban nature offers besides provisioning-, and regulating-, also cultural ecosystem services (CES). CES represent non-material nature values for city dwellers, such as spiritual and religious values, educational values, social relations, cultural heritage, and recreation (Millennium Ecosystem Assessment Citation2005). Urban forests represent a substantial component of nature in cities and encompass urban parks, single trees, urban woodlands, and woods with closed canopy covers (Konijnendijk et al. Citation2005). People experience CES in urban forests while recreating, enjoying the beauty of nature, or being socially engaged (Pulighe et al. Citation2016). The global COVID-19 pandemic in 2020 has highlighted the growing importance of urban forests as critical infrastructure for CES delivery since visitor numbers have increased significantly (Derks et al. Citation2020; Beckmann-Wübbelt et al. Citation2021).
People perceive urban forests as a symbolic environment, created by a human act of conferring meaning on nature and on the environment (Greider and Garkovich Citation1994). Focussing on people, the perception of urban forests is consequently socially constructed (Stedman Citation2003; Winthrop Citation2014). In fact, benefits from ecosystems are not produced by ecosystems independently of humans, but arise because of people’s interactions with the ecosystem: ecosystem services are thus a co-production of human-nature interactions (Fischer and Eastwood Citation2016; Palomo et al. Citation2016; Raymond et al. Citation2017; Torralba et al. Citation2018). Quantifying and evaluating CES is challenging because of the complexity of interactions (Fish et al. Citation2016b) and the ‘intangible nature’ of CES (Chan et al. Citation2012; Hernández-Morcillo et al. Citation2013). Nevertheless, the study of CES of urban green infrastructure is now a well-established field of research. Numerous publications have explored the linkages between ecosystem characteristics (supply) and people’s characteristics and needs (demand) for delivery of CES (Hegetschweiler et al. Citation2017a). Participatory mapping approaches (using Public Participation Geographic Information Systems, PPGIS) are a sound method being used to assess preferences and values directly to quantify demand (Palomo et al. Citation2013; Plieninger et al. Citation2013). PPGIS can capture the heterogeneity of human desires, values, and preferences, which is essential for understanding human demand (Wolff et al. Citation2015). In fact, existing studies identified the linkages between CES hotspots (demand) and physical landscape features (supply) and revealed a hierarchy of importance of various types of CES, also with special focus on urban forests (Agimass et al. Citation2017; Baumeister et al. Citation2020; Gerstenberg et al. Citation2020).
However, these studies did rarely encompass negative perceptions of urban forest visitors and far less attention has been given to equally address negative effects of natural environments. Such knowledge would be needed to provide a complete picture on people’s preferences: it would illuminate two sides of the same coin and could manage to close the loop. In fact, nature may account for costs in terms of maintenance and management (Mullaney et al. Citation2015; McPherson et al. Citation2016; Saunders and Lemasson Citation2020). Moreover, nature may have negative effects on people’s health (Douglas Citation2012): Wildlife and animals may be dangerous (Bixler et al. Citation1994; Butler et al. Citation2003; Destefano and Deblinger Citation2005) or may cause danger to humans through transmission of zoonotic pathogens (Dunn et al. Citation2010; Ostfeld and Keesing Citation2017; Ehrmann et al. Citation2018). Furthermore, urban trees may cause allergic reactions to humans (D’Amato Citation2000; Baro et al. Citation2014; Livesley et al. Citation2016), emit unpleasant odours (Shackleton and Mograbi Citation2019), or create nuisances by dropping leaves in autumn (Flannigan Citation2012; Camacho-Cervantes et al. Citation2014). Likewise, urban trees may be seen as potential hazards in storm events (Conway and Yip Citation2016) or disliked because of blocking views (Schroeder and Anderson Citation1984; Jorgensen et al. Citation2002; Herzog and Kropscott Citation2016). Finally, urban forests may be perceived unpleasantly because of missing aesthetics or poor maintenance (Plieninger et al. Citation2013; Rodríguez-Morales et al. Citation2020).
The negative effects of nature have been referred to as ecosystem disservices (EDS) in the literature. The term EDS describes functions or properties of ecosystems that cause effects that are perceived as harmful, unpleasant, or unwanted (Lyytimäki Citation2015). However, there is ambiguity in the term ‘EDS’ since some negative effects of nature, e.g. wood damage by wood-boring beetles, could, in turn, support greater functional diversity of beneficial species such as cavity-nesting bees (Sydenham et al. Citation2016). Moreover, given many studies that focused on forest preferences (Gundersen et al. Citation2015; Ciesielski and Sterenczak Citation2017) it is apparent that some perceived services such as shading of trees may be in turn perceived as disservices because of blocked views (Lyytimäki et al. Citation2008). A growing number of researchers argue that ecosystem services research should incorporate both services and disservices equally (Shapiro and Báldi Citation2014; Schaubroeck Citation2017) to provide a full picture of how people benefit or suffer from nature (Lyytimäki and Sipilä Citation2009; Sandbrook and Burgess Citation2015; Shackleton et al. Citation2016; Blanco et al. Citation2019) Typologies of EDS have been developed (Lyytimäki Citation2014; Shackleton et al. Citation2016; Vaz et al. Citation2017), including some with focus on urban nature (Gómez-Baggethun and Barton Citation2013; von Döhren and Haase Citation2015). Urban trees and forest-specific typologies encompass disservices causing social problems (e.g. fears of trees or crime), health problems (e.g. allergy and animal attacks), visual and aesthetic problems (e.g. darkness and blocked view), environmental problems (e.g. cracked sidewalks, volatile organic compounds), and costs (e.g. maintenance, administration) (Escobedo et al. Citation2011; Roy et al. Citation2012; Kirkpatrick et al. Citation2013).
Existing studies focusing on EDS do not reflect the full picture of negative aspects that people may experience when visiting urban forests. There are additional disservices that would not be encompassed by existing typologies for EDS since they are of a more anthropogenic nature. These additional disservices encompass for instance fear of crime (Weinborn et al. Citation2017; Mak and Jim Citation2018; Williams et al. Citation2020) and anthropogenic noise (Liu et al. Citation2018a, Citation2018b, Citation2017; Song et al. Citation2018). Furthermore, forest visitors may perceive discomfort because of garbage dropped by other people (Agbenyega et al. Citation2009; Fish et al. Citation2016a), bad forest road conditions (Rodríguez-Morales et al. Citation2020), or forest management that impairs aesthetic values (Bethmann et al. Citation2018). Finally, there may be other disservices perceived by city dwellers that are still unknown. In this study, we understand the term disservices encompassing both EDS and disservices of anthropogenic origin.
To better understand city dwellers’ individual perceptions of CES and disservices in urban forests, it is vital to look at their knowledge about the forest as well as sociodemographic characteristics (Arnberger Citation2006; Plieninger et al. Citation2013; Spangenberg et al. Citation2014; Hegetschweiler et al. Citation2017a; Meyer et al. Citation2019). Previous studies indicate that economic activity status, age, number of children, ethnicity, educational attainment, and marital status significantly influence urban forest visit-related preferences (Mak and Jim Citation2019). For example, Hegetschweiler et al. (Citation2017b) found that frequency of visits positively affects visual attractiveness of forests. Meyer et al. (Citation2019) found that age, education, household income, family status, and recreational activity affect forest perception. Similarly, Tyrväinen et al. (Citation2003) found effects of gender, age, housing style, and education on the evaluation of forests’ scenic beauty. However, several studies found no effects of sociodemographic characteristics on visual attractiveness of forests (Eriksson et al. Citation2012; Chen et al. Citation2016; Hegetschweiler et al. Citation2020). In summary, there is a knowledge gap on linkages between urban forest visitors‘ socio-demographic characteristics and visit-related preferences. This information may aid in visitor-group specific urban forest management and decision-making.
Finally, we want to explore whether there are spatial bundles of disservices and perceived CES. Existing studies found that various types of CES spatially overlap, indicating that people do not clearly separate one cultural service category from the other. This can be understood as evidence of the interlinked nature of CES (Daniel et al. Citation2012; Bieling and Plieninger Citation2013) and the bundled occurrence of CES (Raudsepp-Hearne et al. Citation2010). Furthermore, existing studies also indicate a spatial congruence between CES and disservices (Plieninger et al. Citation2013), but this needs further testing.
In summary, little research has been done that spatially examined a broad range of negative perceptions of urban forest visitors in addition to CES. In Germany, forest authorities have sound inventory data to assess ecosystem services supply. Additionally, forest function maps help balancing economic, ecological, and social objectives in forest management. Forest function mapping as a planning approach is different from the ecosystem services framework (Meyer and Schulz Citation2017; Tiemann and Ring Citation2018) and based upon a regional-scale expert assessment of forest agencies that incorporate the expertise of other sectorial authorities (for example, agencies for water resource management). The public is involved either in participatory workshops or through public displays of forestry plans. Forest function maps, however, do not illustrate perceived urban forest values, and hotspots of visitor frequencies are not finely graduated – they only display heavy and moderate recreational use intensity. Concerning disservices, there are no maps available to forest services that account for disliked places – neither spatially nor qualitatively to indicate where and to what extent urban forest visitors are concerned. However, forest managers need sound data on the spatial distribution of unpopular places in urban forests to ameliorate disservices in urban forests on-site and focussing their capacities and monetary endeavors on disservices that matter. This study therefore aims at exploring perceived disservices and CES (demand) in three urban forests in Germany’s Southwest. Consequently, we raise the following research questions and hypothesize as follows:
How important are disservices for urban forest visitors?
Do sociodemographic characteristics of respondents have an effect on perceived services and disservices?
Are mapped disservices spatially clustered?
Are there spatial bundles of both CES and disservices and, in turn, are there cold spots with little public interests within urban forests? We hypothesize that mapped disservices are clustered and spatially congruent with CES.
2. Materials and methods
2.1. Study forest
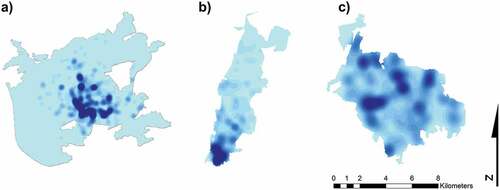
We selected three urban forests in the federal state of Baden-Württemberg in Germany’s Southwest to gather city dwellers’ perceived disservices and CES. The urban forests we selected as case studies represent varying degrees of peri-urbanity and urbanity (Konijnendijk et al. Citation2005). The forests – located in the districts of Stuttgart, Karlsruhe, and Heidelberg – provide important green infrastructure for outdoor recreation. Selected urban forests are characterized by broadly closed canopy covers and thus form contiguous pieces of forest. The urban forest of Karlsruhe touches the inner-city-center. The urban forests of Stuttgart and Heidelberg have a more peri-urban character, being adjacent to urban areas. The forest in the district of Heidelberg (Schwetzinger Hardt) is surrounded by eight middle-sized municipalities (275,000 inhabitants). The city of Heidelberg is the largest city in the district, and downtown is roughly 7 km away northeast. The urban forest in the district of Karlsruhe (Karlsruher Hardt) is adjacent to the city center and ranges about 15 km north from downtown. It is also surrounded by five middle-size municipalities located north of the city of Karlsruhe (375,000 inhabitants). The urban forest in the district of Stuttgart (Rotwildpark) is located west of the city and touches two larger cities (810,000 inhabitants) ().
Figure 1. Three urban forests in Germany’s Southwest: (a) district of Stuttgart, (b) district of Karlsruhe (c) district of Heidelberg. Built environments are grey-coloured, indicating [a] downtown Stuttgart in the East, [b] downtown Karlsruhe in the South, and [c] the eight municipalities around the urban forest in the district of Heidelberg.
![Figure 1. Three urban forests in Germany’s Southwest: (a) district of Stuttgart, (b) district of Karlsruhe (c) district of Heidelberg. Built environments are grey-coloured, indicating [a] downtown Stuttgart in the East, [b] downtown Karlsruhe in the South, and [c] the eight municipalities around the urban forest in the district of Heidelberg.](/cms/asset/d40c79f1-4964-47c2-9b50-88801449329f/tbsm_a_2021289_f0001_oc.jpg)
The three urban forests were selected because of their similarity in terms of forest coverage (Stuttgart 81%, Karlsruhe 84%, and Heidelberg 80%) and size (Stuttgart 51 km2, Karlsruhe 53 km2, and Heidelberg 45 km2). Furthermore, all three forests are owned by the federal state and subject to similar management approaches. The three urban forests are managed according to multipurpose forestry objectives: social, ecological, and economic aims are equally addressed. In the urban forests, there are areas dedicated for recreation and conservation as well as areas for water, climate, noise, and air pollution protection. Logging activities take place in all three study areas.
2.2. Assessing disservices in urban forests
2.2.1. Survey
We used a map-based online questionnaire tool to assess the perception of CES and disservices in urban forests, following standard PPGIS protocols (Brown and Fagerholm Citation2015). We expected to reach more participants with broader representativeness using web-based approaches instead of paper-based mapping on locations. Existing studies indicate that an internet-based PPGIS system is relatively easy to use (Brown et al. Citation2012) and spatial results between paper- and web-based mapping approaches typically do not differ (Pocewicz et al. Citation2012). The used survey-tool (Mapita, www.maptionnaire.com, 2017) allows for combining survey questions with an online mapping interface to collect spatially explicit data. The survey consisted of 16 web-pages and started with descriptions of objectives, technical user instructions including an explanatory video, and the privacy policy. Subsequently, we asked participants about their access to and familiarity with the urban forest. In the following section, we asked for sociodemographic background characteristics, including age, gender, education degree (including school, university, and vocational education), marital status, housing, and work situation, as well as income. Furthermore, using continuous scales, we asked participants to rate their life satisfaction, mental and physical health, place attachment, expertise in urban forestry, and importance of urban forest design. Also, we asked how important provisioning, regulating, and supporting ecosystem services were perceived using examples from the urban forests. Finally, we asked for intensity of recreational use of the urban forests and how participants were advertised for participating in the survey. In the main part of the survey, we asked participants to map CES and disservices in the respective forests. We labelled point markers to be placed within the forest. In terms of CES, we pre-defined categories based on the Millennium Ecosystem Assessment (Citation2005) and according to existing studies (Rall et al. Citation2017). The results of cultural ecosystem services perceptions have been published in Baumeister et al. (Citation2020). Concerning disservices, we referred to suggested categories in existing literature (Escobedo et al. Citation2011; Roy et al. Citation2012; Kirkpatrick et al. Citation2013; von Döhren and Haase Citation2015; Vaz et al. Citation2017). Each pre-defined marker included a short description of the respective category to operationalize the intangible CES- and disservices framework for participants (c.f. ).
Table 1. Pre-defined CES-markers and disservices-markers in the survey
The supplementary category labelled ‘place of discomfort: places I find uncomfortable for another reason (e.g. forest management, anthropogenic noise, garbage, missing accessibility, dogs or other bothering visitors)’ was added to elicit additional disservices. Using this marker was followed by the open question: ‘What makes this place uncomfortable for you?’. Two types of maps were provided to enhance orientation for participants in the urban forest: an orthophoto-map (Microsoft® BingTM Maps Citation2018) and a street map (OpenStreetMap contributors Citation2018). Respondents were able to zoom in and out and the default map displayed the center of the respective urban forest. We neither limited the number of markers per respondent nor the places where markers could be placed spatially within the urban forest to account for individual differences in perception of urban forests. Likewise, we did not ask participants to use every individual marker being provided. We pretested the survey with students and elderly people not familiar with the topic. Furthermore, we asked colleagues and friends to take part in the survey in regard to another urban forest not presented in this paper. Subsequently, we adjusted the text of the survey by making some technical terms more tangible for people not acquainted with the topic. Also, we decided to produce a short technical video in which we described the mapping procedure to make mapping easier to accomplish – especially for the elderly.
2.2.2. Sampling approach
We advertised study participation using various approaches. We drew a random sample of households, addressing city dwellers between 16 and 75 years of age. The gender ratio for the random sample was 50/ 50. We sent flyers to advertise the study to 9327 homes – located in cities that were adjacent to the urban forests (district of Stuttgart 3274, district of Karlsruhe 3194, district of Heidelberg 2859). Addresses were provided by city administrations. Additionally, we sent 1189 letters to affiliated people with the forestry administration of the state of Baden-Württemberg (district of Stuttgart 414, district of Karlsruhe 423, district of Heidelberg 352), such as timber and venison customers, hunters, and sawmill industry representatives located in the targeted cities. In addition, we advertised our study by sending emails to schools and local associations. We were also present in radio and newspapers. Advertisement of the study was in German. The survey was online from May to September 2017.
2.3. Data analysis
2.3.1. Identifying the relative importance of disservices
We first used inductive category formation (Mayring Citation2014) to analyze the responses to the open question ‘What makes this place uncomfortable for you?’, which followed after using the ‘place of discomfort’ marker. This involves first defining categories according to given answers and second assigning each answer according to this scheme. Statements that did not match any category and were mentioned only once were subsumed to the category ‘other’. Statements that involved several meanings were assigned to each addressed category (e.g. ‘place of bad smell and loud place’ were assigned to ‘odour pollution’ as well as ‘anthropogenic noise’). This resulted in a differentiation of disservices.
2.3.2. Investigating the impact of individual background characteristics on perception of services and disservices
We used Kruskal-Wallis tests and Wilcoxon rank-sum tests to investigate potential effects of gender, education degree (including school and university education), marital status, housing and work situation, and income, as well as expertise in urban forestry on the total of mapped liked and disliked places (across all services and disservices categories) per person. Furthermore, we used Spearman’s rank correlation to examine the relationship of age, perceived life satisfaction, mental and physical health, place attachment, familiarity with the respective forest, and rated importance of urban forest design to the number of mapped popular and unpopular places. We used R statistical software (R Core Team Citation2020, version 4.0.2) for these data analyses.
2.3.3. Visualizing hotspots of disservices
We visualized the spatial distribution of perceived disservices within the urban forest using hotspot maps. We calculated the average distance from every mapped point to its nearest neighbour based on feature centroids to further analyse use intensity patterns. Therefore, we used the spatial statistics tool ‘average nearest neighbour’ in ArcGIS version 10.7.1 (ESRI Citation2019). Subsequently, we visualized spatial density of mapped unpopular places for each urban forest using the Kernel Density tool for point features (ESRI Citation2019). The tool calculates the density of point features around each output raster cell and fits a smoothly curved surface over each point (Mitchell Citation1999). To create this density surface, a search radius around each cell center needs to be defined as it specifies the level of smoothing. Small values produce peaky estimates, whereas large values produce smooth functions (Bivand et al. Citation2013). The Kernel Density tool then calculates the density of each raster cell output by adding the number of features of all kernel surfaces where they overlay the raster cell center (Mitchell Citation1999). We used the default search radius – which is calculated based on the spatial configuration and number of input points to correct for spatial outliers – and set the output cell size to ten meters. The map outputs were visualized using standard deviation (interval size 1/4 SD) with 13–17 classes depending on the number of mapped points. For each urban forest, we used these settings to visualize intensity for each disservice-category individually (n = 7). We removed mapped places of discomfort not being placed within the urban forest. Additionally, we removed mapped disservices being left on the default position since we assumed them having no spatial meaning.
2.3.4. Analyzing the relationship between cultural ecosystem services and disservices in urban forests
In order to find spatial bundles of CES and disservices, we created grids for three urban forests with cell sizes of 100 m × 100 m, resulting in a total of 16713 grids (Ungaro et al. Citation2016). Subsequently, we counted the number of markers per grid being placed for disservices and CES separately. We used Spearman’s rank correlation to analyze the relationship between CES and disservices (Bagstad et al. Citation2018; Campagne et al. Citation2018; Nesbitt et al. Citation2019). We conducted all statistical analyses using R version 4.0.2 (R Core Team Citation2020). For visualization, we used circle-symbols be correlated in size with the number of mapped points per grid. We normalized values, ranging from zero to one for a better comparison of the total high number of services and lower number of disservices in one map. One outlier value (city of Stuttgart) has been visualized differently (grey circle) since referring all other values to the outlier would have strongly decreased visibility of all mapped positive and negative markers.
3. Results
3.1. Respondents characteristics by study district
The extrapolated response rates of participants who had been invited via postal mail were 8% (district of Stuttgart), 10% (district of Karlsruhe), and 7% (district of Heidelberg), respectively. Given the expenses of rounded EUR 4000, for mail advertisement (shipping and printing), we had an imputed expenditure of EUR 5 for each response that had been acquired by mail. Overall, 1849 residents accomplished placing markers in the online-survey map (Stuttgart n = 798, Karlsruhe n = 630, and Heidelberg n = 421), and 755 of them also mapped places of disservices (n = 1552). 63% (n = 1173) of these participants completed all questions about their sociodemographic background. The average respondent spent 19 minutes to take part in the survey. The number of placed markers increased with the time they were engaged (CES, rs = 0.582; disservices, rs = 0.44). The mean age of our respondents was 47.2 years (SD = 15.17, range = 15–85), and 37% were female. Within our sample, the educational background was high, since 80% held a higher secondary school certificate. 74% of our participants completed a vocational training, and 62% held a university degree. For each of our study districts, most respondents were married (53% to 64%), employed (61% to 64%), lived in multi-person households (79% to 86%), and had monthly net household incomes between 2600 and 7500 Euro (52% to 54%) ().
3.2. The relative importance of cultural ecosystem services and disservices in urban forests
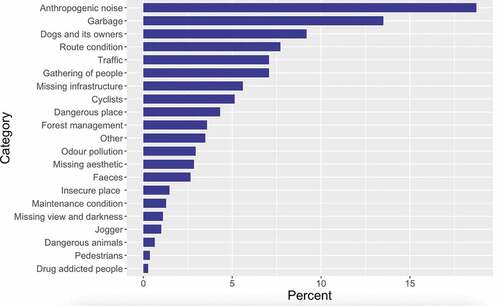
In the three urban forests, respondents mapped places of discomfort, making use of all given pre-defined categories. The marker ‘place of discomfort’ has most often been used (53%), followed by ‘insecurity’ (21%), ‘blocked view’ (6%), ‘invasive species’ (7%), ‘restricted access’ (5%), ‘inconvenient plants’ (4%), and ‘allergy’ (4%). Qualitative answers of respondents to the open question ‘places I find uncomfortable for another reason’ are summarized in .
Figure 2. Proportions of mentions (in percent) of qualitatively stated disservices in three urban forests of Stuttgart, Karlsruhe, Heidelberg (in total). Answers were summarized using inductive category formation.
3.3. The impact of individual background characteristics on perception of disservices
The total number of positive and negative attributes did not vary significantly by either education degree, marital status, or income (). Similarly, the total of mapped attributes did not differ significantly by housing situation (single-person household versus multi-person household), work situation (working versus non-working), and expertise in urban forestry (expert versus layperson; ). However, the total of mapped attributes varied significantly by gender. Female respondents mapped significantly more disservices than male respondents (on average per person 1.02 versus 0.9 mappings) as well as services (on average per person, 5.52 versus 4.86 mappings). However, the effect size was weak (). Finally, using the middle 90% of the data, the time respondents spent for taking part in the survey varied by gender: female respondents spent significantly more time with the questionnaire than male respondents (Mdn = 1300 seconds versus Mdn = 1204 seconds, respectively; mean = 1932 seconds versus mean = 1739 seconds, respectively). However, the effect size was weak (W = 299,217, r = −0.050, p = 0.021).
Table 2. Results of Kruskal-Wallis tests of sociodemographic effects on the total of mapped services and disservices
Table 3. Results of Wilcoxon rank-sum tests of sociodemographic effects on the total of mapped services and disservices
Spearman’s rank correlation analyses revealed no significant relationships of age, perceived physical health, perceived psychological health, and place attachment to the total of mapped disservices per respondent (). In terms of mapped services, we found significant relationships of age and place attachment to the total of mapped services. Furthermore, we found significant positive relationships between familiarity with the respective urban forest as well as rated importance of urban forest design with the total of mapped services and disservices per respondent. Furthermore, we found a significant negative relationship of weak effect size between perceived life satisfaction and the total of mapped disservices per respondent ().
Table 4. Results of Spearman’s rank correlation analyses of relationships between individual background characteristics and the total of mapped services and disservices
3.4. Spatial patterns of disservices
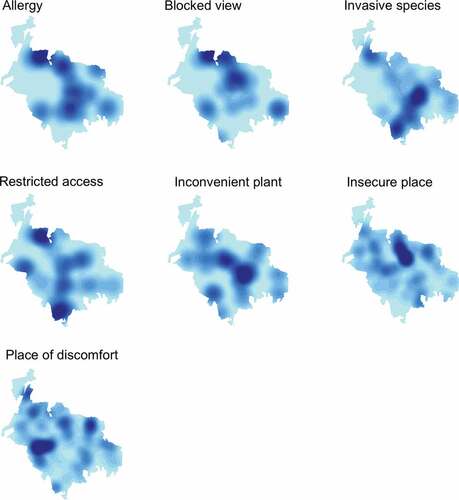
Hotspot maps of disservices derived from the kernel density estimates differed in their patterns for our three urban forests (). With respect to the urban forest of Stuttgart, clustering of disservices was greatest there and hotspots were located at the center of the forest close to a lake that is being frequently visited within the urban forest. For the urban forest of Karlsruhe and Heidelberg, the hotspots were located towards the forest edges and closer to build infrastructure near the city centers (in Karlsruhe) and close to the surrounding communities (urban forest of Heidelberg) (). Furthermore, hotspots were more dispersed in the forests of Karlsruhe and Heidelberg. The calculated Nearest Neighbor Ratios for the three urban forests were 0.548 in Stuttgart (z = −23.059, p = <0.001), 0.662 in Karlsruhe (z = −13.201, p = <0.001), and 0.661 in Heidelberg (z = −13.383, p = <0.001). In summary, mapped disservices were spatially clustered and not evenly distributed over the study area. The analysis of various types of disservices showed several spatial differences in the patterns of hotspots: Allergy (Stuttgart, Heidelberg), restricted access (Stuttgart, Karlsruhe), and blocked view (Heidelberg and Karlsruhe) were more concentrated on fewer hotspots in the urban forest and less distributed within the urban forest. In contrast, hotspots of insecure place and place of discomfort were more numerous and more distributed all over the study area in the three urban forests (Appendix A ). Concerning the spatial distribution of services, human-made infrastructure as well as bluespaces both were most important predictors for the supply of services, whereas natural features and biophysical characteristics (habitat) were less important (Baumeister et al. Citation2020).
Figure 3. Hotspots of urban forest disservices, using kernel density estimates for point features (dark blue represents hotspots. Point densities decrease from dark blue to bright blue): (a) urban forest of Stuttgart, (b) Karlsruhe, (c) Heidelberg (Urban forest disservices n = 7, output cell size = 10 m, classification using standard deviation ¼, classes 13–18).
3.5. Relationship between cultural ecosystem services and disservices in urban forests
Places where respondents mapped CES far overweighed those of mapped discomfort. Respondents in the three urban forests placed only 16% disservices and 84% CES markers: Stuttgart 14% disservices, and 86% CES; Karlsruhe 18% disservices and 82% CES; and Heidelberg 22% disservices and 78% CES. Spearman’s rank correlation analyses revealed statistically significant positive relationships of low to medium effects sizes between mapped CES and disservices in urban forests (the three urban forests in total rs = 0.267, p = < 0.001; Stuttgart rs = 0.395, p = < 0.001; Karlsruhe rs = 0.281, p = < 0.001; and Heidelberg rs = 0.159, p = < 0.001) ().
Figure 4. Spatial congruence of disservices and cultural ecosystem services using symbols according to number of markers per grid: (a) urban forest of Stuttgart (max. CES n = 128 [outlier in grey n = 729], max. disservices n = 18 per grid), (b) urban forest of Karlsruhe (max. CES n = 51, max. disservices n = 8 per grid), (c) urban forest of Heidelberg (max. CES n = 41, max. disservices = 6 per grid).
![Figure 4. Spatial congruence of disservices and cultural ecosystem services using symbols according to number of markers per grid: (a) urban forest of Stuttgart (max. CES n = 128 [outlier in grey n = 729], max. disservices n = 18 per grid), (b) urban forest of Karlsruhe (max. CES n = 51, max. disservices n = 8 per grid), (c) urban forest of Heidelberg (max. CES n = 41, max. disservices = 6 per grid).](/cms/asset/65b87043-2f37-4571-aaca-b1215a5ffe62/tbsm_a_2021289_f0004_oc.jpg)
4. Discussion
This study aimed at spatially identifying disservices that matter to urban forest visitors. We expected that the use of a PPGIS approach would reveal a more holistic and spatially explicit picture on city dwellers’ preferences compared with choice experiments or interviews. Three case studies represent forests with high canopy-cover above 80% coverage in densely populated areas. Our research intended to expose whether there are hotspots of unpopular places in urban forests to guide forestry practitioners and administrations to ameliorate sites of disservices. Additionally, we examined the spatial distribution of disservices to identify hot and cold spots of public interests within the study area. Finally, we looked at the congruence of cultural ecosystem services and disservices in urban forests.
4.1. Respondent characteristics
With regard to age, our sample is representative for the German general population, but it is not for the gender ratio (mean Germany = 44.4 years, 51% female) (Federal Statistical Office Citation2019, Citation2020b). Within our sample, the educational background was higher than the one compared with the general population of Germany, since 80% held a higher secondary school certificate (versus 34% in the German general population) (Federal Statistical Office Citation2020a). Similarly, 74% of our participants had completed a vocational training and 62% had held a university degree (versus 58% and 14%, respectively, in the German general population) (Federal Statistical Office Citation2020a). The higher educational status of respondents may be explained with the used method (web-based survey) as suggested by (Brown et al. Citation2012). Furthermore, people with higher education are more likely to visit urban forests (Mak and Jim Citation2019). For each of our study districts, most of our respondents were married, employed, lived in multi-person households, and had monthly net household incomes between 2600 and 7500 Euro. In comparison, the average monthly net household income of Baden-Württemberg’s inhabitants is 3525 Euro (Eisenreich Citation2015). In the German general population, 43% are married (Federal Statistical Office Citation2020b), 58% live in a multi-person household, and the average monthly net household income is 3399 Euro (Federal Statistical Office Citation2019).
4.2. The relative importance of disservices in urban forests
According to our results, disservices that fit into existing EDS typologies are of lower relevance compared with other disservices resulting from people and their traces: people found anthropogenic noise being the most important disservice in the three urban forests. This is consistent with a previous study from Germany (Plieninger et al. Citation2013). Traffic noise – emitted nearby but not within the urban forest – was mapped more frequently than all other anthropogenic noises resulting from people within the forest (e.g. by social gathering or celebrating), most likely caused by large roads close to the urban forests (Stuttgart, Heidelberg) and the nearby city center in Karlsruhe with high traffic volume. High noise emissions may further stem from a racetrack close to the urban forest in Heidelberg. Traffic noise has previously been identified as important disservice in urban park settings (Liu et al. Citation2017, Citation2018b; Song et al. Citation2018).
Garbage as well as dogs and dog owners were the second and third most stated disservice in our study. Garbage is frequently left in the urban forests, for instance, around officially declared barbecue places that are intensively used by the public especially during the summer. Dogs may be perceived disservice, as dog walkers follow a spatially clustered pattern that is similar to that of other user groups (Gerstenberg et al. Citation2020). This finding is also consistent with previous research (Agbenyega et al. Citation2009; Fish et al. Citation2016a). Finally, road conditions were ranked as the fourth disservice in our urban forests. Forest roads are typically broad, unpaved, and composed of loose gravel; they are also used for logging activities. Our findings concerning forest road dislikes are consistent with other research that focused on single trees (Delshammar et al. Citation2015) and peri-urban community forests (Rodríguez-Morales et al. Citation2020). Ultimately, places of crime and fear as well as health problems were ranked of minor importance in our study, which is inconsistent with previous research that emphasized scary places (Madge Citation1997; Skår Citation2010; Shackleton et al. Citation2015) and negative effects of nature on human health (Lohr et al. Citation2004; Campagne et al. Citation2018; Larson et al. Citation2019) as the most important disservices. Inconsistent results in terms of crime may be explained by the fact that surrounding cities in Germany have lower crime rates than surroundings of other presented study areas (Leicester, UK (Madge Citation1997) and Bela Bela and Tzaneen in Limpopo Province, SA (Shackleton et al. Citation2015)
4.3. Impact of individual background characteristics on perception of disservices
In line with some previous findings (Eriksson et al. Citation2012; Chen et al. Citation2016; Hegetschweiler et al. Citation2020), our study revealed that sociodemographic background characteristics do rarely affect perceptions of urban forest disservices. However, some other studies had identified age (Tyrväinen et al. Citation2003; Meyer et al. Citation2019), gender, and educational level (Tyrväinen et al. Citation2003) being influential. These findings are consistent with our study in terms of gender (services and disservices) as well as age (services). In fact, elder respondents mapped services more frequently than younger participants of our study. This is consistent with other studies (Ode Sang et al. Citation2016). Our finding that female respondents mapped significantly more disservices than male respondents may be associated with the fact that women spent more time with the questionnaire than men. Differences in terms of sociodemographic characteristics may be explained by different methodological approaches and different cultural and geographical contexts. Finally, the more familiar the respondents are with the forest, the more they mapped liked and disliked places.
4.4. Patterns of disservices and relations between cultural ecosystem services and disservices
A PPGIS approach may better satisfy people’s demand for public participation in environmental decision-making and may give voice to the ‘silent majority’ represented by the general public (Brown and Reed Citation2009). Existing studies highlight that forestry planning maps are overall spatially well congruent with maps using PPGIS approaches, but the former are typically too general to guide place-specific forest planning needs (Brown and Donovan Citation2013). Maps such as those generated in our study may thus assist in place-specific forest management decisions. A less obvious but equally important benefit may be the restoration of public trust in state forest planning and decision processes (Brown and Reed Citation2009). Moreover, spatially visualized disliked places could encourage forest managers to either mitigate disservices or to promote CES on-site. The maps of unpopular places in urban forests that we present in this paper have the potential to advance existing planning instruments, such as forest function maps. Furthermore, presented maps of disservices can help local management to focus on disservices that matter. For instance, noise emitted by traffic and industry is in practice being addressed in forest function maps using exemplary measured and subsequently calculated sound emissions (Wirth et al. Citation2015; Palm and Wirth Citation2020). Our findings have the potential to complement this good practice by integrating spatially disliked soundscapes and in doing so focussing on people’s perceptions as opposed to measured sound intensities.
In terms of spatial distribution of mapped places of disservices within the urban forests, we found hotspots of unpopular places. This is consistent with previous research that used transferable indicators instead of survey data to derive places of discomfort and calculate spatial congruence (Dobbs et al. Citation2014). Finally, we found CES and disservices to be spatially congruent. In fact, outcomes demonstrate overlapping clusters of perceived CES and disservices (bundles): locations where people referred the most positive meanings to were also the places where the most negative disservices were perceived. This is consistent with previous studies that also found statistically significant correlation of definite services with disservices (Plieninger et al. Citation2013; Campagne et al. Citation2018; Rodríguez-Morales et al. Citation2020). In fact, the spatial congruence of perceived CES and disservices underpin the competing nature of both: the delivery of CES brings along disservices caused by recreational use intensity, for instance, garbage and noise caused by urban forest visitors. In turn, there were existing cold spots of CES and disservices with little public interest within the urban forest. This fact may indicate that people merely mapped places they are familiar with and as a result of this often visit. However, given that CES–and consequently also disservices–arise because of people’s interactions with the ecosystem as described in section 1 introduction, there is no CES nor disservices without people (Potschin-Young et al. Citation2017).
In terms of identified cold spots in the urban forest, forestry practitioners may be encouraged to give priority to other than recreational objectives on these areas. For example, disturbance-sensitive wildlife could be promoted there or these sites could alternatively be managed with higher priority on timber production. Furthermore, our results enable forest managers to look at specific individual dislikes to consider them in planning and management. Finally, the high importance of disservices originating from people and their traces may indicate concentrating on the public – instead of focussing on natural environments. City foresters could, for instance, establish visitor group-specific zones in urban forests to ameliorate places of discomfort.
4.5. Limitations of the study and implications for future research
Elicited PPGIS-data using points instead of polygons may not account for the spatial extent of perceived disservices. For instance, poisonous plants have typically a low spatial extent, whereas noise can be perceived across large distances from the emitting source. Future research could develop specific buffers for different types of disservices, as suggested by a recent study (Koprowska et al. Citation2018). Furthermore, future studies could enable study participants to map the spatial extent by incorporating polygon features in the survey. However, existing studies that explored the validity of point versus polygon features for eliciting spatial perceptions of respondents indicate a strong degree of overlap of both when the number of collected point data is high enough (Brown and Pullar Citation2012). Our mapping approach required respondents to be familiar with maps as well as with the used software tool. Although the method has been often applied and validity of spatial data has been found to be moderate to high (Brown et al. Citation2017), mapped locations may lack accuracy. We faced this challenge allowing respondents to zoom in for mapping to gain detailed information on maps. Future research could develop approaches that overcome limitations in terms of orientation by providing small-scale maps using a definite zoom-in as a mandatory prerequisite. Revealed CES and disservices may not reflect the full range of perceived CES and disservices of respondents, since the number of placed markers increased with the time participants spent for taking part in the survey and they might have had lack of time. Future research could better represent people with lower educational and different cultural backgrounds by making more effort inviting them to participate in the study. This could be accomplished by other methodical approaches like face-to-face interviews or mapping on physical maps, since web-based survey methods were reported to be cognitively challenging (Brown et al. Citation2012) and addressing younger participants with higher educational status (Pocewicz et al. Citation2012). Likewise, future research in other parts of the world may study disservices with other environmental settings.
The presented share of EDS as opposed to all perceived disservices may be too high since our seven markers included five pre-defined categories that are based upon existing EDS typologies and only two other disservices categories. Because of the timing of the survey (spring to summer), it is likely that perceived disservices in winter are under-represented. Consequently, effects of the daytime on perception of disservices might have influenced results of studies. Finally, survey data were collected before the global COVID-19 pandemic. Hence, one future research question may be the potential impact of the pandemic on perceptions of ecosystem services and disservices–such as perceived risks of vector-borne diseases.
5. Conclusions
In this study, we revealed that perceived dislikes in urban forests are rarely caused by ecosystem disservices in a narrow sense. Human-caused disservices are in contrast much more dominant. This finding may put the discussion of integrating disservices research into the ecosystem services framework in perspective. It also implies that city foresters should focus more on managing disservices caused by forest visitors instead of those provided by natural environments. Our visualization of hotspots of unpopular places in urban forests can complement existing planning instruments, such as forest function maps, as they are based on more reliable spatially explicit data. In most cases, forestry authorities do not have spatial data available that show places where people feel unpleasant. Known locations of disliked places may help forest managers to anticipate potential conflicts. We also found that cultural ecosystem services were much more important than disservices, which implies that urban forest visitors have largely positive perceptions when recreating in the forest. Our spatial analysis indicated a strong overlap of sites perceived for their services and their disservices: The delivery of cultural ecosystem services comes along with the drawback of perceived disservices on-site. Urban forest managers may thus guide the spatial movements of urban forest visitors within the forest more actively to avoid conflicts among various stakeholders. Finally, we identified cold spots of little public interest within the urban forest. Urban forestry practitioners may be encouraged to dedicate these sites to other than recreational objectives, such as timber production or conservation.
Geolocation information
Urban Forest in the district of Stuttgart, Germany (WGS84): 48.765708, 9.099172
Urban Forest in the district of Karlsruhe, Germany (WGS84): 49.084120, 8.433979
Urban Forest in the district of Heidelberg, Germany (WGS84): 49.337616, 8.584177
Acknowledgments
We thank respondents of our study for participation. We also thank Severin Hauenstein and the biometry team at Albert-Ludwigs-University of Freiburg for advice on statistics. Furthermore, we are grateful for advice on geographic information systems by Mirko Mälicke at the Institute of Technology Karlsruhe. Finally, we thank The Forestry Administration of Baden-Württemberg and the Eva Mayr-Stihl Foundation for funding this research. The article processing charge was funded by the Baden-Wuerttemberg Ministry of Science, Research and Art and the University of Freiburg in the funding programme Open Access Publishing.
Disclosure statement
No potential conflict of interest was reported by the author(s).
References
- Agbenyega O, Burgess PJ, Cook M, Morris J. 2009. Application of an ecosystem function framework to perceptions of community woodlands. Land Use Policy. 26(3):551–557. doi:10.1016/j.landusepol.2008.08.011.
- Agimass F, Lundhede T, Panduro TE, Jacobsen JB. 2017. The choice of forest site for recreation: a revealed preference analysis using spatial data. Ecosyst Serv. doi:10.1016/j.ecoser.2017.11.016.
- Arnberger A. 2006. Recreation use of urban forests: an inter-area comparison. Urban For Urban Greening. 4(3–4):135–144. doi:10.1016/j.ufug.2006.01.004.
- Bagstad KJ, Cohen E, Ancona Z, McNulty G, Sun G. 2018. The sensitivity of ecosystem service models to choices of input data and spatial resolution. Appl Geogr. 93:25–36. doi:10.1016/j.apgeog.2018.02.005.
- Baro F, Chaparro L, Gomez-Baggethun E, Langemeyer J, Nowak DJ, Terradas J. 2014. Contribution of ecosystem services to air quality and climate change mitigation policies: the case of urban forests in Barcelona, Spain. Ambio. 43(4):466–479. doi:10.1007/s13280-014-0507-x.
- Baumeister CF, Gerstenberg T, Plieninger T, Schraml U. 2020. Exploring cultural ecosystem service hotspots: linking multiple urban forest features with public participation mapping data. Urban For Urban Greening. 48:126561. doi:10.1016/j.ufug.2019.126561.
- Beckmann-Wübbelt A, Fricke A, Sebesvari Z, Yakouchenkova IA, Fröhlich K, Saha S. 2021. High public appreciation for the cultural ecosystem services of urban and peri‑urban forests during the COVID-19 pandemic. Sustainable Cities Soc. 74:103240. doi:10.1016/j.scs.2021.103240.
- Bethmann S, Simminger E, Baldy J, Schraml U. 2018. Forestry in interaction. Shedding light on dynamics of public opinion with a praxeological methodology. For Policy Econ. 69:93–101. doi:10.1016/j.forpol.2018.08.005.
- Bieling C, Plieninger T. 2013. Recording manifestations of cultural ecosystem services in the landscape. Landscape Res. 38(5):649–667. doi:10.1080/01426397.2012.691469.
- Bieling C, Plieninger T, Pirker H, Vogl CR. 2014. Linkages between landscapes and human well-being: an empirical exploration with short interviews. Ecol Econ. 105:19–30. doi:10.1016/j.ecolecon.2014.05.013.
- Bivand RS, Pebesma E, Gomez-Rubio V. 2013. Applied Spatial Data Analysis with R. 2nd ed. New York (NY): Springer.
- Bixler RD, Carlisle CL, Hammltt WE, Floyd MF. 1994. Observed fears and discomforts among urban students on field trips to wildland areas. J Environ Educ. 26(1):24–33. doi:10.1080/00958964.1994.9941430.
- Blanco J, Dendoncker N, Barnaud C, Sirami C. 2019. Ecosystem disservices matter: towards their systematic integration within ecosystem service research and policy. Ecosyst Serv. 36:100913. doi:10.1016/j.ecoser.2019.100913.
- Brown G, Donovan S. 2013. Escaping the national forest planning quagmire: using public participation GIS to assess acceptable national forest use. J For. 111(2):115–125. doi:10.5849/jof.12-087.
- Brown G, Fagerholm N. 2015. Empirical PPGIS/PGIS mapping of ecosystem services: a review and evaluation. Ecosyst Serv. 13:119–133. doi:10.1016/j.ecoser.2014.10.007.
- Brown G, Montag JM, Lyon K. 2012. Public participation GIS: a method for identifying ecosystem services. Soc Nat Resour. 25(7):633–651. doi:10.1080/08941920.2011.621511.
- Brown G, Pullar DV. 2012. An evaluation of the use of points versus polygons in public participation geographic information systems using quasi-experimental design and Monte Carlo simulation. Int J Geog Inf Sci. 26(2):231–246. doi:10.1080/13658816.2011.585139.
- Brown G, Reed P. 2009. Public participation GIS: a new method for use in national forest planning. For Sci. 55(2):166–182.
- Brown G, Strickland-Munro J, Kobryn H, Moore SA. 2017. Mixed methods participatory GIS: an evaluation of the validity of qualitative and quantitative mapping methods. Appl Geogr. 79:153–166. doi:10.1016/j.apgeog.2016.12.015.
- Butler JS, Shanahan J, Decker DJ. 2003. Public attitudes towards wildlife are changing: a trend analysis of New York residents. Wildl Soc Bull. 31(4): 1027–1036. http://www.jstor.org/stable/3784448
- Camacho-Cervantes M, Schondube JE, Castillo A, MacGregor-Fors I. 2014. How do people perceive urban trees? Assessing likes and dislikes in relation to the trees of a city. Urban Ecosyst. 17(3):761–773. doi:10.1007/s11252-014-0343-6.
- Campagne CS, Roche PK, Salles J-M. 2018. Looking into Pandora’s Box: ecosystem disservices assessment and correlations with ecosystem services. Ecosyst Serv. 30:126–136. doi:10.1016/j.ecoser.2018.02.005.
- Chan KMA, Satterfield T, Goldstein J. 2012. Rethinking ecosystem services to better address and navigate cultural values. Ecol Econ. 74:8–18. doi:10.1016/j.ecolecon.2011.11.011.
- Chen Y, Sun B, Liao S, Chen L, Luo S. 2016. Landscape perception based on personal attributes in determining the scenic beauty of in-stand natural secondary forests. Ann For Res. 59(1). doi:10.15287/afr.2015.440.
- Ciesielski M, Sterenczak K. 2017. What do we expect from forests? The European view of public demands. J Environ Manage. 209:139–151. doi:10.1016/j.jenvman.2017.12.032.
- Conway TM, Yip V. 2016. Assessing residents’ reactions to urban forest disservices: a case study of a major storm event. Landsc Urban Plan. 153:1–10. doi:10.1016/j.landurbplan.2016.04.016.
- D’Amato G. 2000. Urban air pollution and plant-derived respiratory allergy. Clinical and Experimental Allergy. 30(5):628–636. doi:10.1046/j.1365-2222.2000.00798.x.
- Daniel TC, Muhar A, Arnberger A, Aznar O, Boyd JW, Chan KM, von der Dunk A, Elmqvist T, Flint CG, Gobster PH. 2012. Contributions of cultural services to the ecosystem services agenda. Proc Natl Acad Sci U S A. 109(23):8812–8819. doi:10.1073/pnas.1114773109.
- Delshammar T, Östberg J, Öxell C. 2015. Urban trees and ecosystem disservices–a pilot study using complaints records from three Swedish cities. Arboric Urban For. 41(4). doi:10.48044/jauf.2015.018.
- Derks J, Giessen L, Winkel G. 2020. COVID-19-induced visitor boom reveals the importance of forests as critical infrastructure. For Policy Econ. 118:102253. doi:10.1016/j.forpol.2020.102253.
- Destefano S, Deblinger RD. 2005. Wildlife as valuable natural resources vs. intolerable pests: a suburban wildlife management model. Urban Ecosyst. 8(2):179–190. doi:10.1007/s11252-005-4379-5.
- Dobbs C, Kendal D, Nitschke CR. 2014. Multiple ecosystem services and disservices of the urban forest establishing their connections with landscape structure and sociodemographics. Ecol Indic. 43:44–55. doi:10.1016/j.ecolind.2014.02.007.
- Douglas I. 2012. Urban ecology and urban ecosystems: understanding the links to human health and well-being. Curr Opin Environ Sustainability. 4(4):385–392. doi:10.1016/j.cosust.2012.07.005.
- Dunn RR, Davies TJ, Harris NC, Gavin MC. 2010. Global drivers of human pathogen richness and prevalence. Proc Biol Sci. 277(1694):2587–2595. doi:10.1098/rspb.2010.0340.
- Ehrmann S, Ruyts SC, Scherer-Lorenzen M, Bauhus J, Brunet J, Cousins SAO, Liira J, Decocq G, De Frenne P, De Smedt P. 2018. Habitat properties are key drivers of Borrelia burgdorferi (s.l.) prevalence in Ixodes ricinus populations of deciduous forest fragments. Parasit Vectors. 11(1):23. doi:10.1186/s13071-017-2590-x.
- Eisenreich D. 2015. Income and consumption expenditure of private households in Baden-Württemberg: results of the income and consumption survey 2013. Mon Stat Bull Baden-Württemberg, Germany. 12:43–47.
- Eriksson L, Nordlund AM, Olsson O, Westin K. 2012. Beliefs about urban fringe forests among urban residents in Sweden. Urban For Urban Greening. 11:321–328. doi:10.1016/j.ufug.2012.02.004.
- Escobedo FJ, Kroeger T, Wagner JE. 2011. Urban forests and pollution mitigation: analyzing ecosystem services and disservices. Environ Pollut. 159(8–9):2078–2087. doi:10.1016/j.envpol.2011.01.010.
- ESRI. 2019. ArcGIS desktop version 10.7.1. Environmental systems. Redlands (CA): Research Institute.
- Federal Statistical Office. 2019. Year’s statistics–Germany and international affairs, Wiesbaden (Germany).
- Federal Statistical Office. 2020a. Education level of the population–results of the microcensus 2019 Wiesbaden (Germany).
- Federal Statistical Office. 2020b. Population and employment –Population update based on the 2011 census - Subject-matter series 1 series 1.3 - 2018. Wiesbaden (Germany).
- Fischer A, Eastwood A. 2016. Coproduction of ecosystem services as human–nature interactions—An analytical framework. Land Use Policy. 52:41–50. doi:10.1016/j.landusepol.2015.12.004.
- Fish R, Church A, Willis C, Winter M, Tratalos JA, Haines-Young R, Potschin M. 2016a. Making space for cultural ecosystem services: insights from a study of the UK nature improvement initiative. Ecosyst Serv. 21:329–343. doi:10.1016/j.ecoser.2016.09.017.
- Fish R, Church A, Winter M. 2016b. Conceptualising cultural ecosystem services: a novel framework for research and critical engagement. Ecosyst Serv. 21:208–217. doi:10.1016/j.ecoser.2016.09.002.
- Flannigan J. 2012. An evaluation of residents’ attitudes to street trees in Southwest England. Arboric J. 28(4):219–241. doi:10.1080/03071375.2005.9747428.
- Gerstenberg T, Baumeister CF, Schraml U, Plieninger T. 2020. Hot routes in urban forests: the impact of multiple landscape features on recreational use intensity. Landsc Urban Plan. 203. doi:10.1016/j.landurbplan.2020.103888.
- Gómez-Baggethun E, Barton DN. 2013. Classifying and valuing ecosystem services for urban planning. Ecol Econ. 86:235–245. doi:10.1016/j.ecolecon.2012.08.019.
- Greider T, Garkovich L. 1994. Landscapes: the social construction of nature and the environment. Rural Sociol. 59(1):1–24. doi:10.1111/j.1549-0831.1994.tb00519.x.
- Gundersen V, Clarke N, Dramstad W, Fjellstad W. 2015. Effects of bioenergy extraction on visual preferences in boreal forests: a review of surveys from Finland, Sweden and Norway. Scand J For Res. 31(3):323–334. doi:10.1080/02827581.2015.1099725.
- Hegetschweiler KT, de Vries S, Arnberger A, Bell S, Brennan M, Siter N, Olafsson A, Voigt A, Hunziker M. 2017a. Linking demand and supply factors in identifying cultural ecosystem services of urban green infrastructures: a review of European studies. Urban For Urban Greening. 21:48–59. doi:10.1016/j.ufug.2016.11.002.
- Hegetschweiler KT, Fischer C, Moretti M, Hunziker M. 2020. Integrating data from National Forest Inventories into socio-cultural forest monitoring – a new approach. Scand J For Res. doi:10.1080/02827581.2020.1799066.
- Hegetschweiler KT, Plum C, Fischer C, Brändli U-B, Ginzler C, Hunziker M. 2017b. Towards a comprehensive social and natural scientific forest-recreation monitoring instrument—A prototypical approach. Landsc Urban Plan. 167:84–97. doi:10.1016/j.landurbplan.2017.06.002.
- Hernández-Morcillo M, Plieninger T, Bieling C. 2013. An empirical review of cultural ecosystem service indicators. Ecol Indic. 29:434–444. doi:10.1016/j.ecolind.2013.01.013.
- Herzog TR, Kropscott LS. 2016. Legibility, mystery, and visual access as predictors of preference and perceived danger in forest settings without pathways. Environ Behav. 36(5):659–677. doi:10.1177/0013916504264138.
- Jorgensen A, Hitchmough J, Calvert T. 2002. Woodland spaces and edges: their impact on perception of safety and preferences. Landsc Urban Plan. 60(3):135–150. doi:10.1016/S0169-2046(02)00052-X.
- Kirkpatrick JB, Davison A, Daniels GD. 2013. Sinners, scapegoats or fashion victims? Understanding the deaths of trees in the green city. Geoforum. 48:165–176. doi:10.1016/j.geoforum.2013.04.018.
- Konijnendijk CC, Nilsson K, Randrup TB, Schipperijn J. 2005. Urban forests and trees. A reference book. 1st ed. City of Heidelberg (Germany): Springer International. (Konijnendijk CC, Nilsson K, Randrupp TB, Schipperijn J, editors).
- Koprowska K, Łaszkiewicz E, Kronenberg J, Marcińczak S. 2018. Subjective perception of noise exposure in relation to urban green space availability. Urban For Urban Greening. 31:93–102. doi:10.1016/j.ufug.2018.01.018.
- Larson KL, Corley EA, Andrade R, Hall SJ, York AM, Meerow S, Coseo P, Childers DL, Hondula DM. 2019. Subjective evaluations of ecosystem services and disservices: an approach to creating and analyzing robust survey scales. Ecol Soc. 24(2). doi:10.5751/es-10888-240207.
- Liu H, Hu Y, Li F, Yuan L. 2018a. Associations of multiple ecosystem services and disservices of urban park ecological infrastructure and the linkages with socioeconomic factors. J Clean Prod. 174:868–879. doi:10.1016/j.jclepro.2017.10.139.
- Liu J, Wang Y, Zimmer C, Kang J, Yu T. 2017. Factors associated with soundscape experiences in urban green spaces: a case study in Rostock, Germany. Urban For Urban Greening. doi:10.1016/j.ufug.2017.11.003.
- Liu J, Xiong Y, Wang Y, Luo T. 2018b. Soundscape effects on visiting experience in City Park: a case study in Fuzhou, China. Urban For Urban Greening. doi:10.1016/j.ufug.2018.01.022.
- Livesley SJ, McPherson GM, Calfapietra C. 2016. The urban forest and ecosystem services: impacts on urban water, heat, and pollution cycles at the tree, street, and city scale. J Environ Qual. 45(1):119–124. doi:10.2134/jeq2015.11.0567.
- Lohr VI, Pearson-Mims CH, Tarnai J, Dillman DA. 2004. How urban residents rate and rank the benefits and problems associated with trees in cities. J Arboric. 30(1):28–35.
- Lyytimäki J. 2014. Bad nature: newspaper representations of ecosystem disservices. Urban For Urban Greening. 13(3):418–424. doi:10.1016/j.ufug.2014.04.005.
- Lyytimäki J. 2015. Ecosystem disservices: embrace the catchword. Ecosyst Serv. 12:136. doi:10.1016/j.ecoser.2014.11.008.
- Lyytimäki J, Petersen LK, Normander B, Bezák P. 2008. Nature as a nuisance? Ecosystem services and disservices to urban lifestyle. Environ Sci. 5(3):161–172. doi:10.1080/15693430802055524.
- Lyytimäki J, Sipilä M. 2009. Hopping on one leg – the challenge of ecosystem disservices for urban green management. Urban For Urban Greening. 8(4):309–315. doi:10.1016/j.ufug.2009.09.003.
- Madge C. 1997. Public parks and the geography of fear. Tijdschrift Voor Economische En Sociale Geografie. 88(3):237–250. doi:10.1111/j.1467-9663.1997.tb01601.x.
- Mak BKL, Jim CY. 2018. Examining fear-evoking factors in urban parks in Hong Kong. Landsc Urban Plan. 171:42–56. doi:10.1016/j.landurbplan.2017.11.012.
- Mak BKL, Jim CY. 2019. Linking park users’ socio-demographic characteristics and visit-related preferences to improve urban parks. Cities. 92:97–111. doi:10.1016/j.cities.2019.03.008.
- Mayring P. 2014. Qualitative content analysis: theoretical foundation, basic procedures and software solution. Klagenfurt (Austria). http://nbn-resolving.de/urn:nbn:de:0168-ssoar-395173.
- McPherson EG, van Doorn N, de Goede J. 2016. Structure, function and value of street trees in California, USA. Urban For Urban Greening. 17:104–115. doi:10.1016/j.ufug.2016.03.013.
- Meyer MA, Rathmann J, Schulz C. 2019. Spatially-explicit mapping of forest benefits and analysis of motivations for everyday-life’s visitors on forest pathways in urban and rural contexts. Landsc Urban Plan. 185:83–95. doi:10.1016/j.landurbplan.2019.01.007.
- Meyer MA, Schulz C. 2017. Do ecosystem services provide an added value compared to existing forest planning approaches in Central Europe? Ecol Soc. 22(3). doi:10.5751/es-09372-220306.
- Microsoft® BingTM Maps. 2018. https://www.bing.com/maps.
- Millennium Ecosystem Assessment. 2005. Ecosystems and Human Well-being: Synthesis. https://www.millenniumassessment.org/documents/document.356.aspx.pdf.
- Mitchell A. 1999. The ESRI guide to GIS analysis. Volume 1: geographic patterns & relationships, Vol. 1. Redlands (CA): ESRI Press.
- Mullaney J, Lucke T, Trueman SJ. 2015. A review of benefits and challenges in growing street trees in paved urban environments. Landsc Urban Plan. 134:157–166. doi:10.1016/j.landurbplan.2014.10.013.
- Nesbitt L, Meitner MJ, Girling C, Sheppard SRJ, Lu Y. 2019. Who has access to urban vegetation? A spatial analysis of distributional green equity in 10 US cities. Landsc Urban Plan. 181:51–79. doi:10.1016/j.landurbplan.2018.08.007.
- Ode Sang Å, Knez I, Gunnarsson B, Hedblom M. 2016. The effects of naturalness, gender, and age on how urban green space is perceived and used. Urban For Urban Greening. 18:268–276. doi:10.1016/j.ufug.2016.06.008.
- OpenStreetMap contributors. 2018. Planet dump. openstreetmap.org. https://planet.osm.org.
- Ostfeld RS, Keesing F. 2017. Is biodiversity bad for your health? Ecosphere. 8(3):1–12. doi:10.1002/ecs2.1676.
- Palm T, Wirth K. 2020. Waldfunktionenkartierung in Baden-Württemberg [Forest function maps in Baden-Wuerttemberg]. City of Freiburg (Germany). https://www.fva-bw.de/daten-und-tools/geodaten/waldfunktionenkartierung.
- Palomo I, Felipe-Lucia MR, Bennett EM, Martín-López B, Pascual U. 2016. Disentangling the pathways and effects of ecosystem service co-production. Adv Ecol Res. 245–283. doi:10.1016/bs.aecr.2015.09.003.
- Palomo I, Martín-López B, Potschin M, Haines-Young R, Montes C. 2013. National Parks, buffer zones and surrounding lands: mapping ecosystem service flows. Ecosyst Serv. 4:12. doi:10.1016/j.ecoser.2012.09.001.
- Pietilä M, Neuvonen M, Borodulin K, Korpela K, Sievänen T, Tyrväinen L. 2015. Relationships between exposure to urban green spaces, physical activity and self-rated health. J Outdoor Recreation Tourism. 10:44–54. doi:10.1016/j.jort.2015.06.006.
- Plieninger T, Dijks S, Oteros-Rozas E, Bieling C. 2013. Assessing, mapping, and quantifying cultural ecosystem services at community level. Land Use Policy. 33:118–129. doi:10.1016/j.landusepol.2012.12.013.
- Pocewicz A, Nielsen-Pincus M, Brown G, Schnitzer R. 2012. An evaluation of internet versus paper-based methods for public participation geographic information systems (PPGIS). Trans GIS. 16(1):39–53. doi:10.1111/j.1467-9671.2011.01287.x.
- Potschin-Young M, Haines-Young R, Görg C, Heink U, Jax K, Schleyer C. 2017. Understanding the role of conceptual frameworks: reading the ecosystem service cascade. Ecosyst Serv. doi:10.1016/j.ecoser.2017.05.015.
- Pulighe G, Fava F, Lupia F. 2016. Insights and opportunities from mapping ecosystem services of urban green spaces and potentials in planning. Ecosyst Serv. 22:1–10. doi:10.1016/j.ecoser.2016.09.004.
- R Core Team. 2020. A language and environment for statistical computing. R Foundation for Statistical Computing. Vienna, Austria. https://www.R-project.org/
- Rall E, Bieling C, Zytynska S, Haase D. 2017. Exploring city-wide patterns of cultural ecosystem service perceptions and use. Ecol Indic. 77:80–95. doi:10.1016/j.ecolind.2017.02.001.
- Raudsepp-Hearne C, Peterson GD, Bennett EM. 2010. Ecosystem service bundles for analyzing tradeoffs in diverse landscapes. Proc Natl Acad Sci U S A. 107:5242–5247.
- Raymond CM, Giusti M, Barthel S. 2017. An embodied perspective on the co-production of cultural ecosystem services: toward embodied ecosystems. J Environ Plann Manage. 61(5–6):778–799. doi:10.1080/09640568.2017.1312300.
- Rodríguez-Morales B., Roces-Díaz JV, Kelemen E, Pataki G, Díaz-Varela, E. 2020. Perception of ecosystem services and disservices on a peri-urban communal forest: Are landowners’ and visitors’ perspectives dissimilar? Ecosyst Serv. 43. doi:10.1016/j.ecoser.2020.101089.
- Roy S, Byrne J, Pickering C. 2012. A systematic quantitative review of urban tree benefits, costs, and assessment methods across cities in different climatic zones. Urban For Urban Greening. 11(4):351–363. doi:10.1016/j.ufug.2012.06.006.
- Sandbrook CG, Burgess ND. 2015. Biodiversity and ecosystem services: not all positive. Ecosyst Serv. 12:29. doi:10.1016/j.ecoser.2014.12.006.
- Saunders ME, Lemasson A. 2020. Conceptual ambiguity hinders measurement and management of ecosystem disservices. J Appl Ecol. 57:1840–1846. doi:10.1111/1365-2664.13665.
- Schaubroeck T. 2017. A need for equal consideration of ecosystem disservices and services when valuing nature; countering arguments against disservices. Ecosyst Serv. 26:95–97. doi:10.1016/j.ecoser.2017.06.009.
- Schroeder HW, Anderson LM. 1984. Perception of personal safety in urban recreation sites. J Leisure Res. 16(2):178–187. doi:10.1080/00222216.1984.11969584.
- Shackleton CM, Mograbi PJ. 2019. Meeting a diversity of needs through a diversity of species: urban residents’ favourite and disliked tree species across eleven towns in South Africa and Zimbabwe. Urban For Urban Greening. doi:10.1016/j.ufug.2019.126507.
- Shackleton CM, Ruwanza S, Sanni GS, Bennett S, De Lacy P, Modipa R, Mtati N, Sachikonye M, Thondhlana G. 2016. Unpacking Pandora’s box: understanding and categorising ecosystem disservices for environmental management and human wellbeing. Ecosystems. 19(4):587–600. doi:10.1007/s10021-015-9952-z.
- Shackleton S, Chinyimba A, Hebinck P, Shackleton C, Kaoma H. 2015. Multiple benefits and values of trees in urban landscapes in two towns in northern South Africa. Landsc Urban Plan. 136:76–86. doi:10.1016/j.landurbplan.2014.12.004.
- Shapiro J, Báldi A. 2014. Accurate accounting: how to balance ecosystem services and disservices. Ecosyst Serv. 7:201–202. doi:10.1016/j.ecoser.2014.01.002.
- Skår M. 2010. Forest dear and forest fear: dwellers’ relationships to their neighbourhood forest. Landsc Urban Plan. 98(2):110–116. doi:10.1016/j.landurbplan.2010.07.017.
- Song X, Lv X, Yu D, Wu Q. 2018. Spatial-temporal change analysis of plant soundscapes and their design methods. Urban For Urban Greening. 29:96–105. doi:10.1016/j.ufug.2017.11.002.
- Spangenberg JH, Von Haaren C, Settele J. 2014. The ecosystem service cascade: further developing the metaphor. Integrating societal processes to accommodate social processes and planning, and the case of bioenergy. Ecol Econ. 104:22–32. doi:10.1016/j.ecolecon.2014.04.025.
- Stedman RC. 2003. Is it really just a social construction?: The contribution of the physical environment to sense of place. Soc Nat Resour. 16(8):671–685. doi:10.1080/08941920309189.
- Sydenham MAK, Häusler LD, Moe SR, Eldegard K. 2016. Inter-assemblage facilitation: the functional diversity of cavity-producing beetles drives the size diversity of cavity-nesting bees. Ecol Evol. 6:412–425. doi:10.1002/ece3.1871.
- Tiemann A, Ring I. 2018. Challenges and opportunities of aligning forest function mapping and the ecosystem service conept in Germany. Forests. 9:691. doi:10.3390/f9110691.
- Torralba M, Oteros-Rozas E, Moreno G, Plieninger T. 2018. Exploring the role of management in the coproduction of ecosystem services from Spanish Wooded Rangelands. Rangeland Ecol Manage. 71(5):549–559. doi:10.1016/j.rama.2017.09.001.
- Tyrväinen L, Silvennoinen H, Kolehmainen O. 2003. Ecological and aesthetic values in urban forest management. Urban For Urban Greening. 1(3):135–149. doi:10.1078/1618-8667-00014.
- Ungaro F, Häfner K, Zasada I, Piorr A. 2016. Mapping cultural ecosystem services: connecting visual landscape quality to cost estimations for enhanced services provision. Land Use Policy. 54:399–412. doi:10.1016/j.landusepol.2016.02.007.
- Vaz AS, Kueffer C, Kull CA, Richardson DM, Vicente JR, Kühn I, Schröter M, Hauck J, Bonn A, Honrado JP. 2017. Integrating ecosystem services and disservices: insights from plant invasions. Ecosyst Serv. 23:94–107. doi:10.1016/j.ecoser.2016.11.017.
- Völker S, Heiler A, Pollmann T, Claßen T, Hornberg C, Kistemann T. 2018. Do perceived walking distance to and use of urban blue spaces affect self-reported physical and mental health? Urban For Urban Greening. 29:1–9. doi:10.1016/j.ufug.2017.10.014.
- von Döhren P, Haase D. 2015. Ecosystem disservices research: a review of the state of the art with a focus on cities. Ecol Indic. 52:490–497. doi:10.1016/j.ecolind.2014.12.027.
- Weinborn C, Ariel B, Sherman LW, O’ Dwyer E. 2017. Hotspots vs. harmspots: shifting the focus from counts to harm in the criminology of place. Appl Geogr. 86:226–244. doi:10.1016/j.apgeog.2017.06.009.
- Williams TG, Logan TM, Zuo CT, Liberman KD, Guikema SD. 2020. Parks and safety: a comparative study of green space access and inequity in five US cities. Landsc Urban Plan. 201:103841. doi:10.1016/j.landurbplan.2020.103841.
- Winthrop RH. 2014. The strange case of cultural services: limits of the ecosystem services paradigm. Ecol Econ. 108:208–214. doi:10.1016/j.ecolecon.2014.10.005.
- Wirth K, Wurster M, Waldenspuhl T. 2015. Leitfaden zur Kartierung der Schutz- und Erholungsfunktion des Waldes [guidlines for mapping forest functions]. City of Freiburg (Germany). https://www.fva-bw.de/fileadmin/user_upload/Daten_und_Tools/Geodaten/Waldfunktionenkartierung/geodaten_waldfunktionenkartierung_leitfaden_wfk_2016.pdf.
- Wolff S, Schulp CJE, Verburg PH. 2015. Mapping ecosystem services demand: a review of current research and future perspectives. Ecol Indic. 55:159–171. doi:10.1016/j.ecolind.2015.03.016.
Appendix
Table A1. Sociodemographic characteristics of study participants who placed markers of CES and disservices
Figure A1. Hotspot maps of individual urban forest disservices (urban forest of Stuttgart), using kernel density estimates for point features (dark blue represents hotspots; point densities decrease from dark blue to bright blue; disservices n = 7, output cell size = 10 m, classification using standard deviation ¼, classes 13–15).
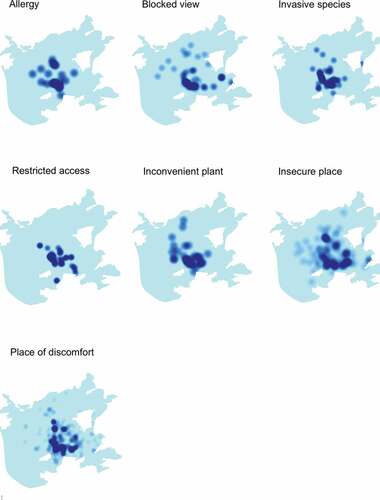
Figure A2. Hotspot maps of individual urban forest disservices (urban forest of Karlsruhe), using kernel density estimates for point features (dark blue represents hotspots; point densities decrease from dark blue to bright blue; disservices n = 7, output cell size = 10 m, classification using standard deviation ¼, classes 15–16).
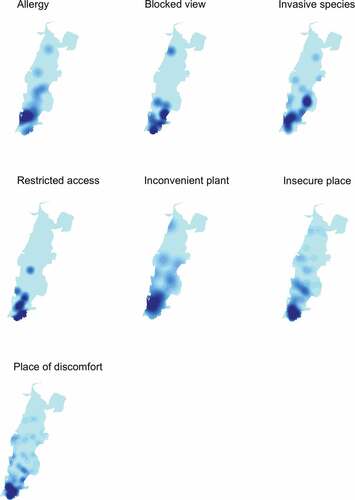
Figure A3. Hotspot maps of individual urban forest disservices (urban forest of Heidelberg), using kernel density estimates for point features (dark blue represents hotspots; point densities decrease from dark blue to bright blue; disservices n = 7, output cell size = 10 m, classification using standard deviation ¼, classes 16–17).