
ABSTRACT
Parks and protected areas (PPAs) are crucial for providing society with essential ecosystem services, encompassing both tangible and intangible benefits derived from healthy ecosystems. While previous research has predominantly focused on material-based ecosystem services, limited attention has been devoted to the impact of non-material cultural ecosystem services (CES), such as recreation and cultural-historic aspects, on visitor loyalty. Visitor loyalty refers to an individual’s commitment and willingness to repeatedly visit a PPA. CES can significantly shape these attitudes, as many visitors are drawn to specific PPAs due to their cultural significance or scenic beauty. This study investigated how CES influences visitor loyalty attitudes and intention-to-return at the Great Bay National Estuarine Research Reserve (GBE). In the summer of 2022, data were collected from 645 GBE visitors using a population sampling approach. Structural equation modeling analyses revealed a robust link between various CES factors, visitor loyalty attitudes, and intention-to-return. For instance, findings suggest that education and the sense of place exert a strong and consistent influence on visitor attitudes regarding referrals, financial support, volunteerism, and advocacy. Additionally, positive visitor attitudes toward referrals strongly and independently predicted their overall intent to revisit the GBE. This research contributes to the advancement of both CES and visitor loyalty frameworks, offering empirical insights for natural resource managers. By acknowledging the significance and trade-offs associated with CES elements, like education and the sense of place, resource managers can enhance visitor loyalty and secure the long-term sustainability of natural resources worldwide.
Edited by:
1. Introduction
Visitation to parks and protected areas (PPAs) within the United States increased gradually during the 21st century, and skyrocketed in the last few years, due largely to the COVID-19 pandemic (Outdoor Foundation Citation2021; Ferguson et al. Citation2022c, Citation2023). Water-based recreation (WBR) is one of the most popular forms of outdoor recreation in the United States with more than 179 million visitors engaged in some form of WBR in 2020 (Mimbs et al. Citation2020; Outdoor Foundation Citation2021). Water-based recreation broadly refers to outdoor recreation activities conducted in and around water resources such as motorized and non-motorized boating, angling, hunting, birding, hiking, picnicking, etc. (Kakoyannis and Stankey Citation2002; Ferguson et al. Citation2018). Recent research suggests that ecosystem services or the benefits provided to humans by healthy ecosystems within WBR settings (e.g. fishing, water) serve as a primary catalyst for WBR recreation visitation (Martin et al. Citation2020; Mimbs et al. Citation2020). Research regarding ecosystem services within WBR resources has largely focused on material-based and monetary ecosystem services such as provisioning services (e.g. water), regulating services (e.g. climate regulation), and supporting services (e.g. nutrient cycling) (Grizzetti et al. Citation2019; Vallecillo et al. Citation2019), with a limited focus on cultural ecosystem services (CES). CES refers to the non-material benefits provided to humans by ecosystems such as recreation, education, sense of place, and aesthetics (Martin et al. Citation2020; Beckmann-Wubbelt et al. Citation2021).
Visitor loyalty attitudes, in comparison, refer to the affirmative intention of visitors to return to a specific PPA (e.g. intention to revisit, word of mouth). A visitor’s loyalty attitudes towards a specific PPA are often influenced by various factors such as the ecological integrity and overall quality of a natural resource (Seebunruang et al. Citation2022). Intuitively, CES and visitor loyalty attitudes are intertwined concepts as they are both instrumental in WBR and visitor management. For example, WBR visitors may continue to return to a specific PPA because of its cultural-historic and/or recreation significance (Ament et al. Citation2017). As such, the overall quality of CES may influence an individual’s decision to return, and ultimately, their long-term loyalty to a specific PPA. The relationship between CES and visitor loyalty, however, is understudied in PPA settings. Accordingly, this study examined the influence of various CES upon visitor loyalty attitudes and intention-to-return at the Great Bay National Estuarine Research Reserve (GBE) in New Hampshire. The study findings inform natural resource management and policy and aid in the long-term retention and loyalty of PPA visitors.
2. Literature review
2.1. Social-ecological systems
The social-ecological systems (SES) framework serves to combine various interconnected social and ecological sub-systems more broadly, such as the connection between natural resources, visitor experiences, and communities (Morse Citation2020). PPAs embody this framework through their ability to supply ecological resources as a public service, providing benefits to both visitors and surrounding communities (Colding and Barthel Citation2019). SES research, however, has historically been over-simplified in PPA settings, often neglecting to incorporate ecological, natural, and cultural systems (Colding and Barthel Citation2019; Morse Citation2020; Ferguson et al. Citation2022a).
This integrated SES approach serves to assess more broadly the complex and adaptive components of entire ecosystems from a systems perspective (Colding and Barthel Citation2019; Ferguson et al. Citation2022a, Citation2022d). For instance, recent research has established that social and ecological impacts in PPA settings have distinct downstream influences upon visitor attitudes and perceptions (e.g. ecosystem services), visitor outcomes (e.g. intention-to-return, loyalty), and proximate community impacts (e.g. economic vitality, health, well-being) (Morse Citation2020; Ferguson et al. Citation2022a, Citation2022b). Thus, the SES framework serves to further explore the complex connections between humans and natural systems while providing for the sustainable management of PPAs.
2.2. Cultural ecosystem services
Ecosystem services are a key component to the overall understanding of resource and visitor use management. Ecosystem services refer to the various benefits that healthy ecosystems and both material and non-material resources provide humans (Martin et al. Citation2020). Outdoor recreation experiences within PPAs fall under the umbrella of cultural ecosystem services (CES) (Ament et al. Citation2017; Martin et al. Citation2020). CES assess the cultural offerings of ecosystems or natural resources through non-material evaluation, considering perspectives like recreation, education, and aesthetics (Martin et al. Citation2020; Beckmann-Wubbelt et al. Citation2021). In the context of this study, culture refers to the collective human interactions, traditions, activities, and values that shape social, ecological, and recreation experiences within PPA settings (Spencer-Oatey and Franklin Citation2012).
The integration of CES within WBR settings is underdeveloped, particularly within the context of understanding how visitors value WBR resources (Martin et al. Citation2020). Breaking CES down into smaller sub-constructs (e.g. recreation, education, sense of place, aesthetics) allows for an easier understanding of visitor perceptions of CES on a given WBR resource. Within CES, various sub-constructs are often represented. For this study, eight CES sub-constructs were examined: recreation, education, sense of place, aesthetics, community and social relations, nature connection, sounds and acoustics, and cultural-historic. Each of the study sub-constructs were developed and defined from the literature (Bryce et al. Citation2016; Cabana et al. Citation2020; Martin et al. Citation2020).
Recreation encompasses the benefits and opportunities provided by healthy ecosystems for individuals to engage in outdoor activities such as boating, fishing, and bird watching. Education as a CES refers to opportunities for healthy ecosystems to facilitate individual learning and knowledge acquisition, often thought the use of natural settings for educational purposes. Sense of place encompasses the emotional and/or psychological attachment and identity that individuals and communities develop with a healthy ecosystem, often serving to foster a deeper connection between individuals and healthy ecosystems. Aesthetics relates to the overall appearance and beauty of a healthy ecosystem, including its distinctive and memorable features. Aesthetics refers to the overall appearance and beauty of a healthy ecosystem, including its distinctive and memorable features. Community and social relations as a CES refer to the social benefits and values achieved from interactions with healthy ecosystems such as community cohesion, social interaction, and the formation of meaningful individual and community bonds within a resource. Nature connection encompasses the physical and psychological benefits and values that individuals derive from their interactions and relationships with healthy ecosystems such as aesthetic, recreational, and cultural-historic aspects of nature appreciation and connection. Sounds and acoustics as a CES encompass the auditory experiences and benefits provided by healthy ecosystems such as the sounds of nature, water, and wildlife, all of which contribute to the enjoyment of nature and cultural richness of both individuals and societies. In the context of this study, cultural-historic refers to the collective interactions, traditions, activities, and values within PPA settings, encompassing elements of historical and cultural significance that contribute to appreciation and education.
2.3. Loyalty attitudes
Visitor loyalty is a broad construct related to an individual’s behavioral and/or attitudinal intentions-to-return and/or recommend others in PPA settings (Moore et al. Citation2015). Behavioral loyalty refers to systematic patterns of consumer actions (e.g. order placements, frequency of visitation) (Suhartanto et al. Citation2020). Attitudinal loyalty, on the other hand, was employed in this study and refer to the affirmative intention of visitors to return to a chosen destination (e.g. intention to revisit, word of mouth) (Wang and Li Citation2023). While there are significant discussions regarding the efficacy of behavioral (i.e. observed) versus attitudinal (i.e. intended) aspects of the visitor loyalty concept in the literature (Wang and Li Citation2023), attitudinal loyalty measures are widely accepted and employed in both PPA research and industry (Suhartanto et al. Citation2020; Wang and Li, Citation2023). Specifically, attitudinal loyalty focuses on the cognitive and emotional state of visitors, in addition to their desire to engage in future visits and recommend a specific experience (Azis et al. Citation2020). It is the mechanism by which visitors can apply pro-commitment attitudes such as advocacy, financial support, volunteerism, and referral, which may lead to/result in visitor retention. Thus, visitor loyalty attitudes serve as an effective and critical measure in PPA settings to assess overall visitor retention and experience quality.
Within visitor loyalty attitudes, various sub-constructs are represented. Within this study, four main visitor attitudinal loyalty sub-constructs were studied: advocacy, financial support, volunteerism, and referral. Advocacy, for this study, is defined as willingness to write or speak about a recreation resource to friends, family, politicians, or the public (Moore et al. Citation2015; Rodger et al. Citation2015; Pinkus et al. Citation2016). Advocacy is often exhibited by groups and local organizations of visitors that are passionate about the resource. Financial support is another key visitor loyalty behavior that is defined as willingness to donate money to organizations that regulate, conserve, and/or maintain recreation resources and facilities (Moore et al. Citation2015; Rodger et al. Citation2015; Pinkus et al. Citation2016). The financial support of a resource is often one of the most involved forms of visitor loyalty due to the involvement of monetary donation. Similarly, volunteer is defined as willingness to volunteer to improve, conserve, or give back to the given recreation resource and its community (Moore et al. Citation2015; Rodger et al. Citation2015; Pinkus et al. Citation2016). Visitors who volunteer are often passionate about the physical components of the resource. Referral is referenced to and defined within literature as willingness to recommend the recreation resource or say positive things to others about the given recreation resource (Moore et al. Citation2015; Rodger et al. Citation2015; Pinkus et al. Citation2016) and is often an informal form of visitor loyalty that is commonplace in conversation. Together, these sub-constructs represent retention-related visitor attitudes.
2.4. Summary and research questions
This study examined the influence of CES (e.g. recreation, education, sense of place, aesthetics, community and social relations, nature connection, sounds and acoustics, and cultural-historic) upon specific elements of visitor loyalty attitudes (e.g. referral, financial support, volunteerism, advocacy) and overall intention-to-return in an estuary setting. The following research questions were examined:
R1:
To what extent do visitors value CES at the GBE?
R2:
To what extent are visitors loyal to the GBE?
R3:
To what extent do visitors intend to return to the GBE?
R4:
What is the relationship between CES, visitor loyalty attitudes, and intention-to-return at the GBE?
3. Methods
3.1. Study area
The Great Bay National Estuarine Research Reserve (GBE) encompasses more than 10,000 acres of brackish tidal estuary located 10 miles from the New Hampshire coastline (Mills Citation2009). The GBE is managed at the state level by the New Hampshire Fish and Game Department and at the federal level by the National Oceanic and Atmospheric Administration, specifically, the Office of Coastal Management – National Estuarine Research Reserve program. The National Estuarine Research Reserve program specializes in estuary management and is responsible for 30 protected coastal sites spanning nearly 1.4 million acres across the country (NOAA Citation2022). The brackish waters of the GBE create a unique environment and diverse flora and fauna including approximately 1,600 acres of eelgrass, 1,000 acres of cord grass and salty hay grasses, seven acres of knotted wrack and rockweed, a multitude of herbaceous perennials (e.g. Joe Pye Weed, Garden Phlox, Bee Balm, Ironweed, Goatsbeard), 20 species of waterfowl, 27 species of shorebirds, 13 species of wading birds, more than 600 species of fish, and a multitude of shellfish populations including lobsters and oysters (Mills Citation2009; Barker Citation2018). The GBE receives an average of 40 inches of precipitation annually and the average water temperature is 62.1 degrees (Ward and Bub Citation2005). The average daily tidal fluctuations (6.8 feet twice per day) at the GBE create rare and unique wetland and upland habitats in the form of salt marshes, rocky bluffs, and diverse tidal riverine systems (NOAA Citation2022). Additionally, the GBE connects the waters of the Piscataqua River and Little Bay with the Atlantic Ocean, creating a substantial system of interconnected waterways in southern New Hampshire.
The GBE provides countless opportunities for water-based recreation. The GBE is surrounded by more than 125,000 people within a 20-minute radius and, due to abundant highway access, is located within 1 day of driving to approximately 25 million people. With more than 100,000 registered boats in the state, there are ample boating opportunities provided in this area (Statista Citation2022). From a recreation resource perspective, the GBE has one visitor center, approximately 15 miles of hiking trails, about 1,500 acres of game lands, one campground, one private marina, and one waterside fueling site (Great Bay Marine Citation2022; New Hampshire Coastal Program Citationn.d.). The GBE also has five boat launches/ramps (four are publicly accessible and one is private), however, only one provides consistent access to the GBE at both high and low tide (Great Bay Marine Citation2022; New Hampshire Coastal Program Citationn.d.). This unique combination of biological and geological diversity, abundant access, and proximity to the New Hampshire seacoast and dense metropolitan centers makes the GBE an attractive destination for local and regional visitors.
3.2. Data collection
This study employed an adjusted drop-off pick-up survey technique referred to as a knock-and-drop method (Allred and Ross-Davis Citation2011; Jackson-Smith et al. Citation2016; Ferguson et al. Citation2022d). Population-level data were collected from May to September of 2022 with survey sampling taking place across nine specific towns proximate to the GBE. These nine towns were identified via a secondary analysis of GBE visitor center data and selected based on high concentrations of GBE visitors () (Great Bay Visitors Center Citation2021).
Table 1. GBE visitation and survey response information.
A stratified cluster sampling design was employed for data collection via four primary steps (Danz et al. Citation2005; Tipton Citation2013). First, the study area was stratified by nine total towns based on the secondary analysis of visitor center data. Next, each of the nine towns was further stratified into clusters, with each cluster consisting of 75 residential home units. Each of the 75-home unit clusters were generated using the ArcGIS Pro tool Build Balances Zones function. Next, four 75-home unit clusters were randomly selected within each town using a random number generator. Finally, all four of the randomly selected clusters in each separate town were surveyed, with trained researchers individually canvasing and surveying 75 units per cluster. In total, 36 residential home unit clusters across nine towns were sampled, for a grand total of 2,700 contacts.
This unique methodology was developed and employed for three primary reasons. First, this technique allows for a social distance survey approach required during the COVID-19 pandemic. Second, this method allowed for the sampling of possibly displaced and/or impacted visitors who would not be captured via on-site survey modalities. Finally, this approach offers a methodical and geographically varied sampling plan that considers a wide range of visitors.
The knock-and-drop survey methodology required trained field researchers to canvas neighborhoods, place survey kits on doorknobs, knock, introduce themselves, and request respondent participation in the survey. Each survey kit consisted of a protective bag holding a cover letter, a paper survey, and a pre-paid return envelope. Two survey response options were provided: 1) a link to an online Qualtrics survey and 2) a printed survey with a postage-paid return envelope. Approximately 2 weeks after initial contact, field researchers provided all non-respondents with a reminder postcard. The postcard reminder process was repeated one final time for any remaining non-respondents. Only consenting adults (18+) were eligible to participate in this study.
For a prerequisite screen-out question, respondents were questioned if they had visited the GBE within the past 2 years. If the respondent replied, ‘yes’, they began the survey, but if the respondent replied ‘no’, they proceeded to complete a short non-respondent socio-demographic survey. At the conclusion of the survey, respondents were thanked for their time and were invited to enter a voluntary prize drawing. In total, 2,700 surveys were dispersed, resulting in 645 completed surveys and a 23.8% response rate (). Fifty-two per cent of the surveys were completed via the online option, while 48% of the surveys were completed via the mail-back option.
3.3. Survey instrumentation
For each survey question, respondents were prompted to refer to their ‘most recent visit to the GBE’. The questions within the first section of the survey included trip visitation patterns and sociodemographic characteristics. Next, respondents were asked to assess a series of items evaluating perceptions of CES. This study introduced and employed an innovative quantitative multi-item CES survey battery. This CES assessment was created based on a compilation of smaller previously validated CES scales (Bryce et al. Citation2016; Ament et al. Citation2017; Martin et al. Citation2020; Beckmann-Wubbelt et al. Citation2021), expert panel review, pilot testing, and statistical analyses (e.g. exploratory and confirmatory factor analyses) to examine the overall scale reliability and validity.
Initially, researchers conducted a literature review and compiled all potential CES sub-constructs along with related survey items relevant to the GBE. This process resulted in the identification of 12 CES sub-constructs: 1) recreation, 2) education, 3) sense of place, 4) aesthetics, 5) community and social relations, 6) nature connection, 7) sounds and acoustics, 8) cultural-historic, 9) environmental justice and equity, 10) therapeutic recreation, 11) spiritual enrichment, and 12) reflection and creative experiences. Next, the research team sought input from five social science experts and five resource manager experts. These experts were tasked with reviewing and rank-ordering the compiled CES items based on their relevance to the GBE resource, while also providing general grammatical and syntax feedback. This process clearly identified eight CES sub-constructs deemed relevant to the GBE. Following this, researchers conducted a pilot test of the compiled survey instrument with GBE visitors (n = 126). Participants were asked to complete the survey, rank-order the compiled CES items based on their relevance to the GBE resource, and provide general grammatical and syntax feedback. The results of this rank-order process unequivocally confirmed the top eight CES constructs relevant to the GBE, aligning with the feedback from the expert panel review. The four CES sub-constructs consistently identified as least relevant to the GBE were removed from the survey: 1) environmental justice and equity, 2) therapeutic recreation, 3) spiritual enrichment, and 4) reflection and creative experiences. Finally, a series of statistical analyses were conducted on the CES pilot data to ensure appropriate dimension reduction and factor loadings and to assess scale reliability and validity; all of which were appropriate.
Respondents were asked, ‘The following are various cultural ecosystem services provided by nature in the GBE. Please tell us how important each of them is to you at the GBE’. The 24 individual CES items were evaluated on a 7-point Likert scale of 1–7: 1 = not at all important and 7 = extremely important (). This multi-item scale represented eight previously validated CES sub-constructs, with each sub-construct consisting of three individual survey items: 1) recreation, 2) education, 3) sense of place, 4) aesthetics, 5) community and social relations, 6) nature connection, 7) sounds and acoustics, and 8) cultural-historic (Bryce et al. Citation2016; Ament et al. Citation2017; Martin et al. Citation2020; Beckmann-Wubbelt et al. Citation2021).
Table 2. Visitor perceptions of cultural ecosystem services on the GBE.
Next, respondents were asked to assess items related to visitor loyalty attitudes. First, respondents were prompted with, ‘Please indicate whether you intend to take the following actions in the future at the GBE’. The 12 individual loyalty attitude items were evaluated on a 7-point Likert scale of 1–7: 1= definitely not and 7 = without a doubt (). This multi-item scale represented four previously validated sub-constructs, with each sub-construct consisting of three individual survey items: 1) advocacy, 2) financial support, 3) volunteering, and referral (Moore et al. Citation2015; Rodger et al. Citation2015; Pinkus et al. Citation2016).
Finally, respondents were asked to assess their overall intention-to-return to the GBE. Respondents were prompted with, ‘Please indicate whether you intend to return to the GBE in the future’. This previously validated single-item construct was evaluated on a 7-point Likert scale of 1–7: 1= definitely not and 7 = without a doubt () (McCreary et al. Citation2019).
Table 3. Confirmatory factor analysis – final Model for GBE visitors.
3.4. Data analysis
Data analyses were conducted using the Statistical Package for the Social Sciences (SPSS) version 27.0. Research questions R1, R2, and R3 were addressed using frequencies, percentages, and measures of central tendency. To address R4, structured equation modeling (SEM) was employed. SEM creates a theoretical model which uses confirmatory factor analysis to create multiple variables and provide visualization of their connection via structural regression pathways.
4. Results
4.1. Visitor descriptive statistics and visitation patterns
Of the 645 respondents in the study, 48% self-identified as male, 51% as female, and 1% as non-binary. Most respondents (94%) indicated their race/ethnicity as White, while Black/African American, Spanish/Hispanic/Latino, Asian, and American Indian/Alaskan Native ethnicities were also represented. Respondents average age was 57. The most common recreation activity among respondents was visiting the Great Bay Discovery Center (36%) with Hiking/Walking (26%) being a close second. Respondents also recreated via Great Bay Discovery Center launch (21%), Adams Point Wilderness Management Area launch (17%), and Great Bay National Wildlife Refuge (13%). Respondents, on average, visited the GBE 3.5 times per month, 30 times per year, and have been visiting for 16 years.
4.2. Research question one
To understand the extent to which visitors value various CES at the GBE, the researchers utilized frequencies, means, and measures of central tendencies. The overall results suggest that visitors do indeed value certain CES from the GBE, with relatively positive construct mean values ranging from 4.49 to 6.19 (). Specific results indicate that nature connection was the most valued CES (mean = 6.19) followed closely by aesthetics (mean = 6.16) and sounds and acoustics (mean = 6.04), indicating high perceived importance. Recreation (mean = 5.66), cultural-historic (mean = 5.51), and education (mean = 5.48) were also highly valued, indicating moderately high importance. Community and social relations (mean = 4.49) followed by sense of place (mean = 4.86) were the lowest rated CES constructs, indicating moderate levels of importance on the GBE.
4.3. Research question two
To investigate the extent to which visitors are loyal to the GBE, the researchers utilized frequencies, means, and measures of central tendencies. Overall results suggest that visitors are devoted and highly supportive of certain aspects of visitor loyalty, moderately supportive towards various aspects of visitor loyalty, and demonstrated limited support and commitment towards other aspects of visitor loyalty, with construct mean values ranging from 3.10 to 6.30 (). Specific results indicate that visitor attitudes were most supportive and devoted towards referral (mean = 6.30), with the highest rated individual item being ‘say positive thing about the GBE to others’ (mean = 6.33). GBE visitors were moderately supportive towards financial support on the GBE (mean = 4.52), with the highest rated individual item being, ‘donate money to conserve the GBE’ (mean = 4.66). Finally, GBE visitors indicated that they were least committed and supportive towards volunteerism (mean = 3.79) followed closely by advocacy (mean = 3.10).
4.4. Research question three
To understand the extent to which visitors intend to return to the GBE, the researchers utilized frequencies, means, and measures of central tendencies. Overall results indicate that visitors are extremely likely to revisit the GBE again in the future with an item mean score of 6.73 (). Moreover, approximately 97% of visitors suggest they are highly likely (a Likert ranking of 5–7 on a 7-pt scale) to return to the GBE in the future, and approximately 84% of visitors noted they are ‘without a doubt’ (a Likert ranking of 7 on a 7-pt scale) planning to return to the GBE in the future.
4.5. Research question four
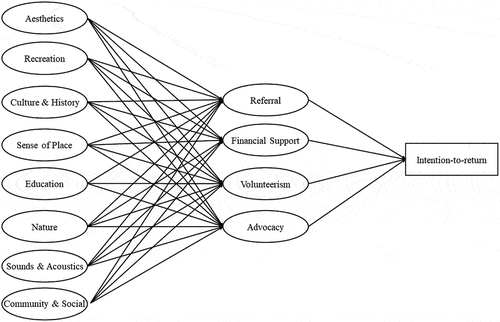
To evaluate the overarching relationship between CES, visitor loyalty attitudes, and intention-to-return at the GBE, structural equation modeling (SEM) was employed. First, a full SEM consisting of eight CES latent factors, four loyalty latent factors, and one intention-to-return variable was created based on theoretical and hypothesized relationships (). Confirmatory factor analysis (CFA) was employed to create a measurement model for the full SEM (see Supplemental Materials Appendix). The full SEM showed adequate fit to the data (χ2: 1135.3, df = 527, p < 0.001; CFI = 0.967; TLI = 0.961; RMSEA = 0.050; SRMR = 0.062) (Hooper et al. Citation2008).
Figure 1. Structural equation model – full model for GBE visitors.
Despite the adequate model fit and strong effect sizes, the full SEM contained far too much noise to be useful. Amongst its 36 structural regression pathways, 26 were non-significant, and a majority contained shared-variance and cross-loading. Thus, a more parsimonious model () allows for a clearer understanding of the interaction between study variables. Note that, due to space limitations, the full SEM, its associated CFA, and a nuanced discussion of the relationships and findings are provided in a Supplemental Materials Appendix.
Figure 2. Structural equation model – final model for GBE visitors.
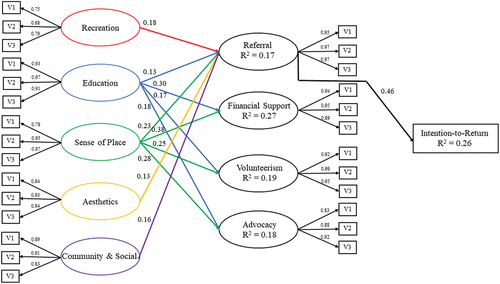
Next, a backward search approach (BSA) process was employed to refine and simplify the final SEM (). BSA is a commonly employed stepwise model selection technique used to simplify and refine a SEM model by iteratively removing non-significant paths or variables from the model (Chou and Bentler Citation2002). BSA is used to strike a balance between adequately representing the underlying theoretical relationships among variables and model parsimony (Green et al. Citation1999). Ultimately, the BSA process in this study resulted in the removal of three CES latent variables from the full SEM to achieve the final SEM: 1) cultural-history, 2) nature connection, and 3) sounds and acoustics.
Finally, a second round of CFAs () was used to generate a measurement model for the final SEM (). The latent variables derived from these CFAs were then used to predict the likelihood of visitor loyalty attitudes and intent-to-return using theoretically informed structural regression pathways. The results indicate significant relationships with satisfactory pathway coefficients between five CES factors, four visitor loyalty attitudinal factors, and intention-to-return. The final SEM model, with all CFAs and structural regression pathways, is displayed in . The final SEM showed a very good fit to the data (χ2: 619.0, df = 308, p < 0.001; CFI = 0.976; TLI = 0.970; RMSEA = 0.047; SRMR = 0.043) (Hooper et al. Citation2008). It should be noted that only significant pathways are shown in the final SEM; however, all pathways were included in model development.
Model pathways within the final SEM suggest sense of place and education have the largest influence of any of the five CES factors on the visitor loyalty attitudes to support GBE in the future. Sense of place and education were the only two factors that significantly influenced propensity to contribute financially, to volunteer, and to engage in advocacy for the GBE. The other three CES factors (recreation, aesthetics, and community and social relations) only affected propensity to refer the GBE to others. Sense of place had the strongest effect (highest standardized pathway coefficients) of any CES factors on each of the four visitor loyalty attitudes. A reasonable percentage of the variation in visitor loyalty attitudes is explained by CES latent items (17–27%, see R2 values). The dependent variable of interest (intention-to-return) is only significantly predicted by propensity to refer the GBE to others. This finding also infers that each of the effects of the CES factors on intention-to-return is mediated by propensity to refer the GBE to others.
5. Discussion
This study examined the influence of CES upon visitor loyalty attitudes and intention-to-return at the GBE. Findings suggest that education and sense of place have a unique and strong influence upon visitor attitudes towards referral, financial support, volunteerism, and advocacy. Moreover, visitor attitudes towards referral strongly and independently influence the overall intention-to-return to the GBE. This research contributes to both the cultural ecosystem services and visitor loyalty frameworks while offering empirical insights into the sustainable management of PPAs.
5.1. Theoretical implications
This study has several key theoretical implications for social science research related to CES survey instrumentation, CES and their relationship with visitor loyalty attitudes, and visitor loyalty attitudes and their relationship with intention-to-return. First, this study introduced and employed an innovative quantitative multi-item CES survey battery. This CES assessment was created based on a compilation of smaller previously validated CES scales, expert panel review, pilot testing, and statistical analyses to ensure overall-scale reliability and validity. While these individual scales have been used in the past, to these authors’ knowledge, this is the first time all CES items have been aggregated and empirically examined in a WBR setting. Employing and validating an extensive multi-item CES quantitative survey item enhances the body of social science literature but requires further validation.
Next, this study validates the CES literature as it pertains to visitor loyalty attitudes. Findings suggest that GBE visitors largely value certain CES provided by a healthy natural resource, reinforcing previous CES research in PPA settings (Rodger et al. Citation2015; Bryce et al. Citation2016; Cabana et al. Citation2020; Martin et al. Citation2020). Study findings also suggest that education and sense of place are strong and robust predictors of visitor loyalty attitudes by a considerable margin (see ), corroborating previous research in PPA settings (Bryce et al. Citation2016; Cabana et al. Citation2020; Martin et al. Citation2020).
Moreover, the latent variables of cultural-historic, nature connection, and sound and acoustics dropped out of the final SEM due to non-significant relationships with visitor loyalty attitudes. The authors suggest that this lack of significance may primarily stem from two areas. First, each of these three latent variables was relatively highly valued by GBE visitors and had the lowest variances of all CES latent variables. For instance, nature connection was the number one most highly rated CES (and the least variable) while sound and acoustics and cultural-historic ranked three and four, respectively. Thus, while these three latent variables were relevant and important to most visitors, they seem to lack variance and therefore likely have little discriminant ability and relationship with visitor loyalty attitudes. Second, there appears to be overlapping and/or complementary individual items within these specific latent variables. For instance, cultural-historic with education as well as nature connection with aesthetics all had substantial cross-loadings. These findings add to the CES literature and indicate that further refinement of the CES multi-item may be necessary.
Finally, this research corroborates the relationship between visitor loyalty attitudes and intention-to-return. Study findings suggest that visitor loyalty attitudes, specifically referral, are strongly related to overall intention to revisit the GBE. As noted throughout the literature, the more positively a visitor assesses their overall experience (e.g. satisfaction), the more likely they are to make recommendations to friends and family and to revisit a location again (Wang and Li Citation2023). Building on this foundational premise, this study found that as sense of place and educational opportunities increase, instances of visitor referral also increase, ultimately leading to an increased intention-to-return to the GBE. These findings validate and extend the literature by using CES for both experiential and ecosystem service valuation, influencing visitor recommendations and return intentions within a PPA.
5.2. Managerial implications
The study’s key applied insights, relevant to resource managers, community members, and GBE visitors, focus on visitor perceptions of four loyalty attitudes and how different CES factors affect these attitudes and overall intention-to-return. First, the positive mean scores for all CES items should be viewed positively by resource managers as affirmation of their hard work and best practices.
Study results show that visitor loyalty attitudes are primarily influenced by sense of place and education at the GBE. For instance, sense of place and education were the only CES factors that significantly influenced propensity to contribute financially, to volunteer, and to engage in advocacy for the GBE. This suggests a need for increased investments in improving and enhancing sense of place and visitor education at the GBE. Research shows that a combination of visitor education and marketing/branding can strengthen the bond and/or sense of place between visitors and a PPA (Smith Citation2015). For example, managers can enhance community connection through programs that showcase valued components of the GBE such as guided naturalist and cultural-historic boating tours, fishing tournaments, and floating workshops and other educational programming at popular access points (Hosany et al. Citation2017; Yuan et al. Citation2019). Additionally, educating visitors about cultural-historic aspects of the GBE and employing resource branding taglines (e.g. ‘Don’t take The Great Bay for granite’ or ‘It’s not just a good bay- it’s a Great Bay’) may also serve to further deepen a sense of place and identity (Hosany et al. Citation2017; Yuan et al. Citation2019).
Finally, the study findings suggest that visitor referral (i.e. referring the GBE to others) is significantly influenced by all five CES factors and may be the most important factor in shaping intention-to-return to the GBE. Resource managers should engage and invest in various strategies aimed at enhancing the visitor experience and fostering positive word-of-mouth. Effective visitor referral strategies in the literature often revolve around the creation of memorable experiences (e.g. interactive and well-maintained facilities), leveraging social media and online platforms (e.g. actively engaging visitors and encouraging them to share experiences), and implementing referral incentive programs (e.g. rewarding visitors for bringing new guests) (Tukamushaba et al. Citation2016; Bergel et al. Citation2019). Resource managers pursuing CES, however, must also recognize the inherent trade-offs in their decision-making processes such as cultural preservation vs. economic development, access vs. conservation, and recreation promotion vs. cultural-historic authenticity (Ament et al. Citation2017).
5.3. Study limitations and implications for future research
There were several study limitations and implications for future research such as the employment of secondary data, visitor residency status, seasonality bias, the CES multi-item battery, and the exclusion of non-significant factors from the final SEM. This study’s survey method required the use of secondary data to identify survey distribution locations based on GBE visitor density. While this method was effective, future research should consider triangulating multiple secondary datasets for potentially more robust sampling. Moreover, while approximately 64% of all GBE visitation was accounted for in this sampling framework, it should be noted that this study focused on in-state/New Hampshire visitors due largely to funding constraints as well as the relatively low percentage of overall visitation represented by out-of-state visitors. Moreover, this study collected data during the summer season only and elements of seasonality bias and cross-sectional research may have been present. Future research should consider pursuing both in-state and out-of-state samples over the course of an entire year in an effort to obtain more comprehensive and robust trend data.
Finally, this study introduced and employed an innovative quantitative multi-item CES survey battery. It should be noted that the full CES survey battery included eight CES sub-constructs consisting of 24 individual items and that the full SEM also included all eight CES sub-constructs. Despite the adequate model fit and strong effect sizes, the full SEM contained far too much noise to be useful. Amongst its 36 structural regression pathways, 26 were non-significant, and a majority contained shared-variance and cross-loading. To create a more parsimonious model that allowed for a clearer understanding of the interaction between study variables, all three of the non-significant CES sub-constructs (e.g. nature connection, sound and acoustics, cultural-historic) were eventually dropped from the final analyses. Future research should consider applying the full CES survey battery with all eight sub-constructs in addition to other empirically validated CES survey items to assess visitor perceptions of CES in natural resource settings.
6. Conclusion
This study examined the influence of CES on visitor loyalty attitudes and the intention-to-return in a national estuarine setting. The data suggests that visitors value CES are supportive of certain elements of visitor loyalty, and are highly likely to revisit the GBE again in the future. Results indicate a strong relationship between certain CES, various visitor loyalty attitudes, and intention-to-return. For instance, SEM findings suggest that education and sense of place have a strong and consistent influence on visitor attitudes toward referrals, financial support, volunteerism, and advocacy. Moreover, visitor attitudes toward referrals strongly and independently influence the overall intention-to-return to the GBE. These findings suggest that resource managers should consider increasing investments in and enhancing sense of place, visitor education, and fostering positive word-of-mouth and referrals to continue enhancing the overall visitor experience and retention at the GBE. Resource managers must also be mindful, however, of the inherent trade-offs in their decision-making processes when pursuing specific CES. Overall, this study demonstrates the importance and influence of CES in shaping visitor attitudes and decision-making. This research advances both the CES and visitor loyalty frameworks and provides empirical evidence for natural resource managers.
Supplementary Material
Download PDF (613.9 KB)Disclosure statement
No potential conflict of interest was reported by the author(s).
Data availability statement
The survey instrumentation and data presented in this study are available upon request from the corresponding author, but they are not publicly available for proprietary and privacy reasons.
Supplementary material
Supplemental data for this article can be accessed online at https://doi.org/10.1080/26395916.2023.2297560.
Additional information
Funding
References
- Allred SB, Ross-Davis A. 2011. The drop-off and pick-up method: an approach to reduce nonresponse bias in natural resource surveys. Small-Scale For. 10(3):305–12. doi: 10.1007/s11842-010-9150-y.
- Ament JA, Moore CA, Herbst M, Cumming GS. 2017. Cultural ecosystem services in protected areas: understanding bundles, trade-offs, and synergies. Conserv Lett. 10(4):440–450. doi: 10.1111/conl.12283.
- Azis N, Amin M, Chan S, Aprilia C. 2020. How smart tourism technologies affect tourist destination loyalty. J Hosp Tour Technol. 11(4):603–625. doi: 10.1108/JHTT-01-2020-0005.
- Barker S. 2018. Eelgrass distribution in the great bay estuary (Report No. P18-UZM17). Piscataqua Region Estuaries Partnership. https://scholars.unh.edu/cgi/viewcontent.cgi?article=1408&context=prep
- Beckmann-Wubbelt A, Fricke A, Sebesvari Z, Yakouchenkova IA, Frolich K, Saha S. 2021. High public appreciation for the cultural ecosystem services of urban and peri‑urban forests during the COVID-19 pandemic. Sustainable Cities Society. 74:103240. doi: 10.1016/j.scs.2021.103240.
- Bergel M, Frank P, Brock C. 2019. The role of customer engagement facets on the formation of attitude, loyalty, and price perception. J Serv Mark. 33(7):890–903. doi: 10.1108/JSM-01-2019-0024.
- Bryce R, Irvine KN, Church A, Fish R, Ranger S, Kenter KO. 2016. Subjective well-being indicators for large-scale assessment of cultural ecosystem services. Iss Environ Sci Tech. 21:258–269. doi: 10.1016/j.ecoser.2016.07.015.
- Cabana D, Ryfield F, Crowe TT, Brannigan J. 2020. Evaluating and communicating cultural ecosystem services. Iss Environ Sci Tech. 42:101085. doi: 10.1016/j.ecoser.2020.101085.
- Chou CP, Bentler PM. 2002. Model modification in structural equation modeling by imposing constraints. Comput Stat Data Anal. 41(2):271–287. doi: 10.1016/S0167-9473(02)00097-X.
- Colding J, Barthel S. 2019. Exploring the social-ecological systems discourse 20 years later. Ecol Soc. 24(1). doi: 10.5751/ES-10598-240102.
- Danz NP, Regal RR, Niemi GJ, Brady VJ, Hollenhorst T, Johnson LB, Kelly JR. 2005. Environmentally stratified sampling design for the development of Great Lakes environmental indicators. Environ Monit Assess. 102(1–3):41–65. doi: 10.1007/s10661-005-1594-8.
- Ferguson MD, Caraynoff A, Ferguson LA, Barcelona R, Evensen D, Knox H, Pytlik S, Grosz D. 2022b. Weather they return: modeling outdoor recreation behaviors, decision-making, and intention-to-return in federally designated wilderness. Forests. 13(7):1018. doi: 10.3390/f13071018.
- Ferguson MD, Giles G, Ferguson LA, Barcelona R, Evensen D, Barrows C, Leberman M. 2022d. Seeing the forest for the trees: a social-ecological systems approach to managing outdoor recreation visitation in parks and protected areas. J Outdoor Recr Tour. 38:100473. doi: 10.1016/j.jort.2021.100473.
- Ferguson MD, Lynch ML, Evensen D, Ferguson LA, Barcelona R, Giles G, Leberman M. 2023. The nature of the pandemic: exploring the negative impacts of the COVID-19 pandemic upon recreation visitor behaviors and experiences in parks and protected areas. J Outdoor Recr Tour. 41:100498. doi: 10.1016/j.jort.2022.100498.
- Ferguson MD, McIntosh K, English DB, Ferguson LA, Barcelona R, Giles G, Fraser O, Leberman M. 2022c. The outdoor renaissance: assessing the impact of the COVID-19 pandemic upon outdoor recreation visitation, behaviors, and decision-making in New England’s national forests. Soc Nat. 35(10):1063–1082. doi: 10.1080/08941920.2022.2055247.
- Ferguson MD, Mueller JT, Graefe AR, Mowen AJ. 2018. Coping with climate change: a study of great lakes water-based recreationists. J Park Recreat Adm. 36(2):52–74. doi: 10.18666/JPRA-2018-V36-I2-8296.
- Ferguson MD, Perry EE, Lynch M, Ferguson LA, Kiewra LA, Leberman M, Manning RE. 2022a. Expanding the viewshed: insights and implications for examining visitor use management across scales and modalities in an iconic national forest. J Outdoor Recr Tour. 40:100570. doi: 10.1016/j.jort.2022.100570.
- Great Bay Marine. 2022 Aug 8. Services. [accessed 2022 Dec 18]. https://www.greatbaymarine.com/service/.
- Great Bay Visitors Center. 2021. Great Bay visitor center - visitor attendance logs [dataset]. Great Bay National Estuarine Research Reserve.
- Green SB, Thompson MS, Poirier J. 1999. Exploratory analyses to improve model fit: errors due to misspecification and a strategy to reduce their occurrence. Struct Equ Modeling. 6(1):113–126. doi: 10.1080/10705519909540122.
- Grizzetti B, Liquete C, Pistocchi A, Vigiak O, Zulian G, Bouraoui F, De Roo A, Cardoso AC. 2019. Relationship between ecological condition and ecosystem services in European rivers, lakes and coastal waters. Sci Total Environ. 671:452–465. doi: 10.1016/j.scitotenv.2019.03.155.
- Hooper D, Coughlan J, Mullen M. 2008. Evaluating model fit: a synthesis of the structural equation modeling literature. In: 7th European Conference on research methodology for business and management studies, London. p. 195–200.
- Hosany S, Prayag G, Van Der Veen R, Huang SS, Deesilatham S. 2017. Mediating effects of place attachment and satisfaction on the relationship between tourists’ emotions and intention to recommend. J Travel Res. 56(8):1079–1093. doi: 10.1177/0047287516678088.
- Jackson-Smith D, Flint CG, Dolan M, Trentelman CK, Holyoak G, Thomas B, Ma G. 2016. Effectiveness of the drop-off/pick-up survey methodology in different neighborhood types. J Rural Social Sci. 31(3):3.
- Kakoyannis C, Stankey G. 2002. Assessing and evaluating recreational uses of water resources: implications for an integrated management framework. USDA Forest Service - General Technical Report.
- Martin CL, Momtaz S, Gaston T, Moltschaniwskyj NA. 2020. Estuarine cultural ecosystem services valued by local people in New South Wales, Australia, and attributes important for continued supply. Ocean Coast Manag. 190:105160. doi: 10.1016/j.ocecoaman.2020.105160.
- McCreary A, Seekamp E, Larson LR, Smith JW, Davenport MA. 2019. Predictors of visitors’ climate-related coping behaviors in a nature-based tourism destination. J Outdoor Recr Tour. 26:23–33.
- Mills K 2009. Ecological trends in the great bay estuary. https://www3.epa.gov/region1/npdes/schillerstation/pdfs/AR-186.pdf
- Mimbs BP, Boley BB, Bowker JM, Woosnam KM, Green GT. 2020. Importance-performance analysis of residents’ and tourists’ preferences for water-based recreation in the Southeastern United States. J Outdoor Recr Tour. 31:100324. doi: 10.1016/j.jort.2020.100324.
- Moore SA, Rodger K, Taplin R. 2015. Moving beyond visitor satisfaction to loyalty in nature-based tourism: a review and research agenda. Curr Issues Tour. 18(7):667–683. doi: 10.1080/13683500.2013.790346.
- Morse WC. 2020. Recreation as a social-ecological complex adaptive system. Sustainability. 12(3):753. doi: 10.3390/su12030753.
- New Hampshire Coastal Program. n.d. Coastal access map. https://wildlife.state.nh.us/marine/documents/coastal-access-map.pdf
- NOAA. 2022. Great bay national estuarine research reserve. https://coast.noaa.gov/nerrs/reserves/great-bay.html
- Outdoor Foundation. 2021. Outdoor participation trends report. Outdoorindustry.org. https://outdoorindustry.org/wp-content/uploads/2015/03/2021-Outdoor-Participation-Trends-Report.pdf
- Pinkus E, Moore SA, Taplin R, Pearce J. 2016. Re-thinking visitor loyalty at ‘once in a lifetime’ nature-based tourism destinations: empirical evidence from Purnululu National Park, Australia. J Outdoor Recr Tour. 16:7–15. doi: 10.1016/j.jort.2016.08.002.
- Rodger K, Taplin RH, Moore SA. 2015. Using a randomized experiment to test the casual effect of service quality on visitor satisfaction and loyalty in a remote national park. Tourism Manage. 50:172–183. doi: 10.1016/j.tourman.2015.01.024.
- Seebunruang J, Burns RC, Arnberger A. 2022. Is national park affinity related to visitors’ satisfaction with park service and recreation quality? A case study from a Thai forest national park. Forests. 13(5):753. doi: 10.3390/f13050753.
- Smith S. 2015. A sense of place: place, culture and tourism. Tourism Recreat Res. 40(2):220–233. doi: 10.1080/02508281.2015.1049814.
- Spencer-Oatey H, Franklin P. 2012. What is culture. A compilation of quotations. GlobalPad Core Concepts. 1:22.
- Statista. 2022. Registered boats by state in the U.S. 2021. Statista. [accessed 2022 Dec 18]. https://www.statista.com/statistics/1155988/us-recreational-boating-vessels/.
- Suhartanto D, Brien A, Primiana I, Wibisono N, Triyuni NN. 2020. Tourist loyalty in creative tourism: the role of experience quality, value, satisfaction, and motivation. Curr Issues Tour. 23(7):867–879. doi: 10.1080/13683500.2019.1568400.
- Tipton E. 2013. Stratified sampling using cluster analysis: a sample selection strategy for improved generalizations from experiments. Eval Rev. 37(2):109–139. doi: 10.1177/0193841X13516324.
- Tukamushaba EK, Xiao H, Ladkin A. 2016. The effect of tourists’ perceptions of a tourism product on memorable travel experience: implications for destination branding. European Journal of Tourism, Hospitality and Recreation. 7(1):2–12.
- Vallecillo S, la Notte A, Zulian G, Ferrini S, Maes J. 2019. Ecosystem service accounts: valuing the actual flow of nature-based recreation from ecosystems to people. Ecol Modell. 392:196–211. doi: 10.1016/j.ecolmodel.2018.09.023.
- Wang L, Li X. 2023. The five influencing factors of tourist loyalty: a meta-analysis. PLoS ONE. 18(4):e0283963. doi: 10.1371/journal.pone.0283963.
- Ward LG, Bub FL. 2005. Temporal variability in salinity, temperature and suspended sediments in a Gulf of Maine estuary (Great Bay estuary, New Hampshire). High Resolut Morphodynamics Sediment Evol Estuaries. 115–142.
- Yuan Q, Song H, Chen N, Shang W. 2019. Roles of tourism involvement and place attachment in determining residents’ attitudes toward industrial heritage tourism in a resource-exhausted city in China. Sustainability. 11(19):5151. doi: 10.3390/su11195151.