
Abstract
Objective: The aim of this study was to evaluate the mechanical properties of 3D printed zirconia (ZrO2).
Materials and Methods: The test specimens were produced with a 3D printer that uses lithography-based ceramic manufacturing (LCM) technique with two different parameters in horizontal and vertical printing orientations. Altogether four groups of nine specimens were printed and examined. Mechanical characterization was performed using 3-point bending test (ISO 10477) and surface microhardness (Vickers) test. Grain structure, porosity and printing layer morphology were examined with optical and scanning electron microscopy (SEM). Additionally fractography analysis was done to investigate and evaluate features of fracture initiation site. Numeric results were statistically analyzed with ANOVA (a = 0.05).
Results: The average flexural strength reached for printed zirconia was 499 MPa (+/−75 MPa) for specimens printed in horizontal orientation and 575 MPa (+/−69 MPa) for specimens printed in vertical orientation. Optical microscopy and SEM analysis revealed that fractures initiated between the printing layers or from a local porosity. Printing layer thickness varied from under 13 μm to over 20 μm.
Conclusions: The study revealed that 3D printed zirconia has challenges in regards to layer integration. Based on this study, 3D printed zirconia still suffers from low mechanical strength, which together with long carbon-debinding time, does not make 3D printed zirconia a potential material for dental appliances at this stage. Further research is needed to create more suitable zirconia precursor slurries and to optimize printing parameters and sintering conditions to be able to 3D print zirconia with higher mechanical properties.
Introduction
In dentistry, a regularly used method for producing zirconia crowns, implant abutments and fixed dental prostheses is CAD/CAM milling of green state zirconia followed by sintering. Disadvantages of milling include waste of raw materials and possible microscopic cracks if the sintered dental device made of zirconia is mechanically finished. To some extent these shortcomings can be avoided by machining green stage material and sintering the material after milling [Citation1–3]. Milling is also rather energy consuming, heavy on the milling tools and it causes a lot of noise and heat [Citation4,Citation5]. In general, zirconia as a material is reputed for its positive properties such as high mechanical strength, high toughness compared to other ceramic materials and adequate esthetic qualities which all have encouraged the use of zirconia in dentistry [Citation6]. Before the era of yttria stabilized zirconia, alumina was the most promising fully crystallized dental ceramic. Clinically, zirconia restorations have functioned well, although recently long term clinical follow-up studies have shown some concern with the durability of zirconia restorations [Citation7–10].
Three-dimensional printing (3D printing), which is also termed additive manufacturing, solid freeform fabrication and rapid prototyping, is in use on a large scale in many industries. The printing of different plastics and metals has been in industrial use for years now, however currently the printing process of ceramics is not well established. 3D printing has several benefits. For example, it permits designing internal morphology, allows more freedom with the shape of the work piece, produces less waste material and consumes less energy [Citation6].
Currently there are several potential additive manufacturing techniques for printing ceramic. One potential technique is the lithography-based ceramic manufacturing (LCM) technology, also known as stereolithography, which is based on building the structure layer-by-layer, by using selective light curing to cure photosensitive ceramic suspension. The ceramic suspension contains photocurable resin and homogenously dispersed ceramic particles. Other additive manufacturing techniques for ceramics include Fused Deposition Modeling [Citation11], Direct Ink Writing [Citation1,Citation12,Citation13], Selective Laser Sintering [Citation11,Citation14] and Binder Jetting, also known as 3DP (Three Dimensional Printing, 3D Printing) [Citation11,Citation15].
The LCM technology was used to manufacture the specimens in this study [Citation16,Citation17]. In the specific technique used in this study, the part is not fully immersed in the suspension but it is mounted upside down and dipped in a thin suspension layer placed in a vat. This technique demands only a small amount of ceramic suspension for building the part and produces less waste material. The structure produced is called a green body, and it has to be further processed thermally by carbon-debinding and sintering to achieve the microstructure and properties characteristic to polycrystalline zirconia.
3D printing some of the materials is and has already been a logical next step in the development of digital workflow in dentistry. Digital workflow contains three elements: the use of various scanning technology, the manipulation of collected data by computer-aided design (CAD) software and finally the production of the structure by computer-aided manufacturing (CAM) [Citation4]. Compared to subtractive manufacturing or milling, additive manufacturing will gain more ground in the material manufacturing phase. Thus, the aim of this study was to evaluate the suitability of the LCM printing method when fabricating zirconia for dental use. Printed ceramic materials were mechanically, microscopically and thermally characterized.
Materials and methods
Printing and thermal treatment
Four set of zirconia bars (specimens (2.0 × 2.0 × 25.0 mm3)) were printed with an LCM 3 Dprinter (CeraFab 7500, Lithoz, Vienna, Austria). The zirconia was printed using commercial ceramic precursor slurry (LithaCon 3Y 610 Purple (zirconia, 3% yttria), Lithoz, Vienna, Austria), a photocurable ceramic suspension [Citation17]. The specimens were prepared with the 3D printer either in vertical or horizontal orientation. See for an illustrative drawing of printing orientations. Group Z-1 contained 9 zirconia specimens printed in vertical orientation, the group Z-2 contained 9 zirconia specimens printed in horizontal orientation, group Z-3 contained 9 specimens printed in horizontal orientation and group Z-4 contained 9 vertically printed specimens. The number of specimens, printing orientations and printing parameters of each group are stated in . Printing parameters in groups Z-1 and Z-2 are proposed by the printer manufacturer. The slurry was supplied by the same company. The printing parameters in groups Z-3 and Z-4 were defined by the research group.
Figure 1. Illustrative drawing of specimens which were 3D printed in vertical and horizontal orientation and their flexural strength testing set up. (a) Specimen printed in vertical orientation, (b) Specimen printed in horizontal orientation, (c) vertically printed specimen in flexural strength test, (d) horizontally printed specimen in flexural strength test.
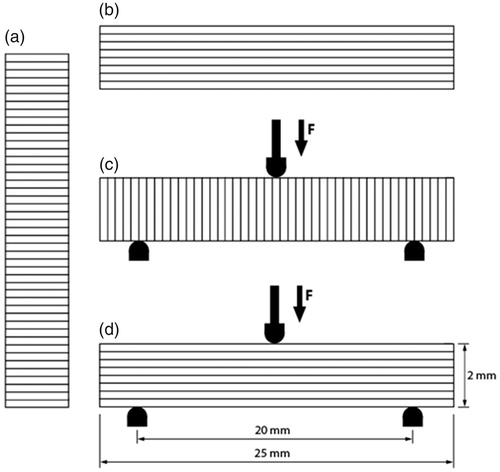
Table 1. The most substantial printing parameters of the groups Z-1, Z-2, Z-3 and Z-4.
The support structures of the printed specimens were cut off in green stage with a sharp blade by hand. After that the specimens were carbon-debinded and sintered (debinding time 81.9 h with maximum temperature 500 °C, sintering time 48.9 h with maximum temperature 1450 °C).
To compensate the firing shrinkage of zirconia, a compensation factor of 1.354 was used in the X and Y-directions and for the Z-direction the used shrinkage compensation factor was 1.365. None of the specimens in any group were surface treated after printing, after carbon-debinding nor after sintering.
Flexural strength
The flexural strength was determined in accordance to ISO 10477 by conducting 3-point bending test for the bar shaped specimens described above [Citation18] with a universal testing machine (model LRX, Lloyd Instrument Ltd, Fareham, England). In the test, the specimens were positioned on the metal supports with 20 mm distance and a cylindrical piston applied force from above in the middle of the supports until the breakage. The test was carried out in air at room temperature. The diameter of the piston is 2 mm, the speed of the cross-head is 2 mm/min. The results were recorded with PC computer software (Nexygen 4.0, Lloyd Instruments Ltd, Fareham, England). All the specimens were tested for flexural strength and modulus of elasticity. The data for flexural strength of the control group (Control Group 1, (ZrO2, yttria-stabilized tetragonal zirconia polycrystal [Y-TZP])) was obtained from a previous data set of the research laboratory (Hjerppe et al. [Citation19]).
Surface microhardness
The surface microhardness of materials was tested with Vickers hardness method (VH) of 5 specimens of each group Z-1, Z-2, Z-3, Z-4 and milled control (Control Group 2). The specimens were tested using a load of 2.94 mN for 5 s. The specimen material in Control Group 2 was milled and sintered zirconium oxide (zirconia, ZrO2, yttria-stabilized tetragonal zirconia polycrystal [Y-TZP]).
Scanning electron microscope (SEM, FESEM)
A number of specimens from all the groups were coated with gold (SCD 050, Sputter coater, Bal-Tec AG, Liechtenstein), and after that they were examined with a scanning electron microscope (SEM) (JSM 5500, Jeol Ltd, Tokyo, Japan) for surface roughness, printing layer thicknesses and possible integration deficiencies between the layers.
Three specimens were thermally etched to study the microstructure. One specimen was thermally etched in 1300 °C, one in 1400 °C and one in 1500 °C [Citation20]. These specimens were examined with field emission scanning electron microscope (FESEM) (Zeiss ULTRA plus FESEM, Germany).
Microstructure and grain size
The microstructure and grain size of zirconia specimens from group Z-4 was measured from a FESEM picture using image processing program ImageJ (Version 1.44 National Institute of Health, USA).
Optical microscopy
Optical Microscopy (Wild M3Z, kombistereo, Heerbrugg Switzerland) was used to study layer delamination in the specimens from groups Z-1, Z-2. Z-3 and Z-4. The microscope was equipped with a digital camera (Toupcam U3CMOS18000KPA, ToupTek Photonics Co., LTD, Zhejiang, P.R.China) which used a computer software (ToupTek ToupView, version: ×64, 3.7.7158, ToupTek Photonics Co., LTD, Zhejiang, P.R.China) to view and photograph the specimens.
Density measurement
A balance (Mettler Toledo X) was used to weigh 6 specimens from groups Z-3, Z-4 and Control Group 3 (milled and sintered zirconia (ZrO2, yttria-stabilized tetragonal zirconia polycrystal [Y-TZP])). The specimens were weighed in air and SDS (1% of sodium dodecyl sulfate dissolved in water), and the density was calculated using the Archimedes method.
Dilatometry and differential scanning calorimetry
Dilatometry (Adamel Lhomargy DI-24, Ivry, France) measurement on the as-printed zirconia specimens was performed to examine the origin of delamination. The dilatometry measurements were used to find the critical temperatures in which shrinkage or expansion of the specimens occurs. The heating rate was 0.2–0.5 C°/min. The specimens were printed with the same 3D printer as groups Z1 to Z4 with the same parameters as groups Z3 and Z4.
In addition, differential scanning calorimetry (DSC) was performed (Netzsch 204 F1 Phoenix) on the zirconia precursor slurry (LithaCon 3Y 610 Purple (zirconia, 3% yttria), Lithoz, Vienna, Austria). The DSC measurements allow observation of monomer and polymer related reactions as a function of temperature which can lead to expansion or shrinkage in the specimens. The combination of dilatometry and DSC measurements is used to identify the temperatures in which the decomposition of the polymer network could lead to unwanted delamination of the printing layers.
DSC measurement was performed on a pure monomer solution which was dissolved from the slurry using acetone. The acetone was fully evaporated before DSC measurement. The heating rate was 10 °C/min.
Statistical analysis
To determine the differences between the groups, the mean values of flexural strength and surface microhardness were statistically analyzed with analysis of variance (ANOVA, Tukey HSD) at the p < .05 significance level. The program used was IBM SPSS Statistics 21 (IBM, USA).
Results
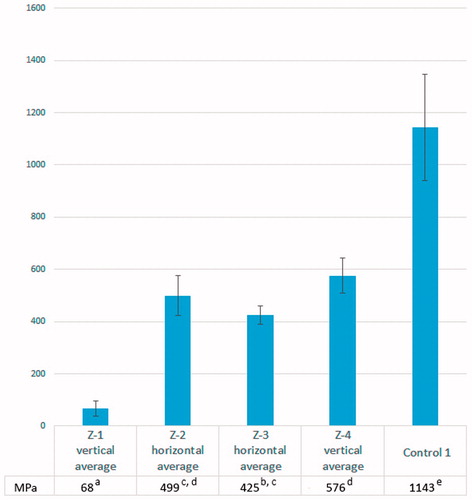
The flexural strength results of all the groups are summarized in . The average 3-point flexural strengths for horizontal orientation printed zirconia were 499 MPa in group Z-2 and 425 MPa in group Z-3. The corresponding values for vertical orientation printed zirconia were 68 MPa in group Z-1 and 576 MPa in Z-4.
Figure 2. The 3-point flexural strength values of the groups Z-1, Z-2, Z-3, Z-4 and control 1 group. Different superscript letters (a, b, c, d, e) indicate statistical difference (ANOVA, Tukey HSD, p < .05).
Surface microhardness test results for printed zirconia specimens in group Z-1 is 1303 VH, in group Z-2 1301 VH, in group Z-3 1363 VH and in group Z-4 1398 VH. Surface microhardness for Control Group 2 is 1402 VH. ANOVA revealed that there is no significant difference between control group and groups Z-3 and Z-4, however there is significant difference between the Control Group 2 and groups Z-1 and Z-2.
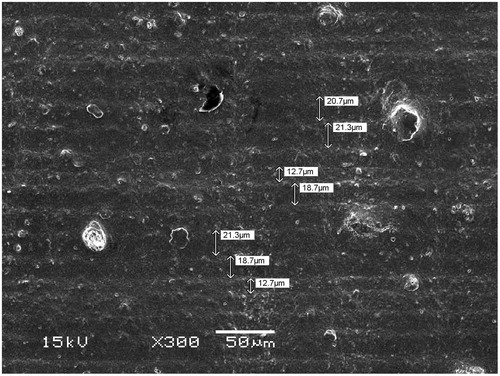
Optical microscopy and SEM revealed that the material in groups Z-1 and Z-2 was randomly delaminated between the printing layers. shows that in group Z-2 the printing layer thickness varied from 13 μm to over 20 μm.
Figure 3. SEM micrograph of layer structure. Layer thickness varies from under 13 µm to over 20 µm. The specimen in the picture is from group Z-2. Magnification 300×.
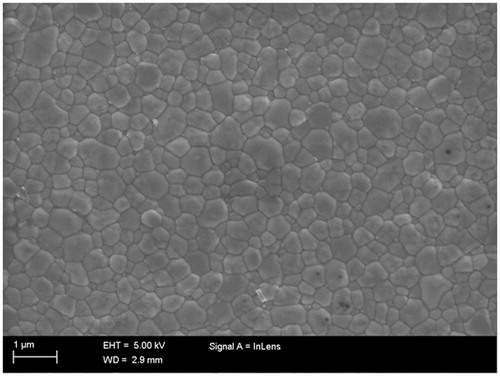
SEM also indicated that there are pores in the specimens as seen in . Microstructure examinations with FESEM indicated that the average microstructure grain size is 392 nm (standard deviation 154 nm) in the specimen which was thermally etched in 1500 °C. The examined specimen was from group Z-4. Microstructure of the specimen can be seen in . The grain size result is average result from altogether three FESEM pictures.
Figure 4. SEM micrograph revealed pores in specimens of group Z-3. Magnification 1000×.
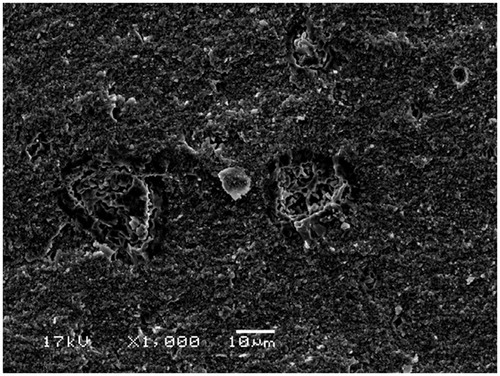
Figure 5. The FESEM micrograph of the specimen which was thermally treated in 1500 °C reveals that the grain size is 392 nm (standard deviation 154 nm).
The average densities for the tested groups were: Z-4: 6.0344 g/mL (standard deviation 0.0049 g/mL), Z-3: 6.0223 (standard deviation 0.0067 g/mL) and Control Group 3: 6.0853 (standard deviation 0.0044 g/mL). ANOVA revealed that there is significant difference between all three groups.
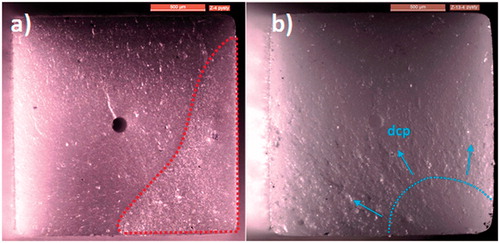
Fractographical analysis performed on the fracture surfaces of sintered flexural test samples indicates that the low measured strength is often accompanied by delamination of printed layers, but other types of critical defects were also detected, such as surface cracks and pores leading to lower strength. Using multi-focus imaging the delamination is detected roughly one printing step higher or lower than the actual fracture surface. illustrates fracture surfaces of samples with low flexural strength and high flexural strength.
Figure 6. Optical microscope images of fractured ZrO2 surfaces. (a) low strength (108 MPa) specimen with delamination covering more than half of the cross-sectional area true fractured surface area marked with dashed red line) (b) high strength (665 MPa) sample with a characteristic mirror area on the right bottom corner with blue arrows indicating the direction of crack propagation. The compression surface is facing upwards and tensile surface downwards.
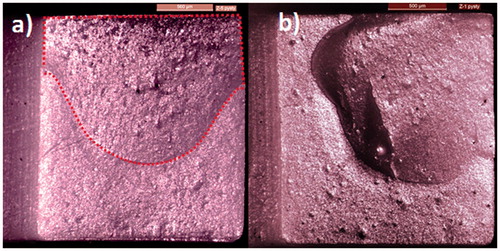
With samples exhibiting an order of magnitude lower strength, the fractured surfaces appear rough and granular while also exhibiting delamination. illustrates fracture surface when measured strength is lower than 100 MPa. Here the origin of fracture was obscured and it appears that printing parameters for these specimens cause poor integration and cohesion between layers which dominate the fracture strength.
Figure 7. Optical microscope images of fractured ZrO2 surfaces exhibiting lowest measured strength. (a) low strength (57 MPa) specimen with delamination covering roughly half of cross-sectional area true fractured surface area marked with dashed red line) and (b) low strength sample (35 MPa) with one of the lowest measured strength. The compression surface is facing upwards and tensile surface downwards.
Dilatometry analysis performed on as-printed ZrO2 showed that the samples exhibit thermal expansion that is disrupted by two distinct shrinkage periods. shows the first and second heating cycle up to 150 °C performed on as-printed specimen. On the first cycle, the sample shrinks 1–1.5% which indicated that the unpolymerized matrix is reacting to the heat. The second cycle to 150 °C shows linear thermal expansion of the polymer/ceramic composite without volume change. After cycling the printed sample to 150 °C, we measured dilatation of the sample up to 500 °C as shown in . Complementary DSC measurements revealed that the monomers in the zirconia precursor slurry start to polymerize via exothermic reaction beginning from 65 °C and continues until 160 °C also without light exposure.
Figure 8. Dilatometry measurements of an as-printed ZrO2 sample up to 150 °C. The first cycle (blue) indicates shrinkage of the sample by 1.0–1.5%. The second cycle (red) on the same sample shows a linear thermal expansion of the sample. Shrinkage in the first cycle is most likely due to polymerization reaction which is exhausted during the first heating cycle. Heating and cooling rate was 0.2 C°/min.
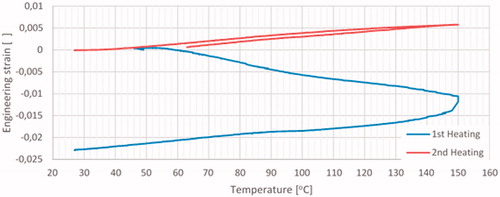
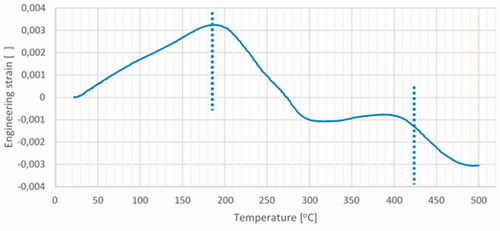
Figure 9. Dilatometry measurement of printed ZrO2 sample heat cycled to 150 °C prior to the test. Thermal expansion is accompanied by two linear shrinkage sequences starting at 170 °C and 390 °C (dashed lines). Heating rate was 0.5 C°/min.
Discussion
In this study the suitability of 3D printing process was evaluated for producing zirconia of adequate mechanical properties for dental restorations. This was carried out by determining the 3-point flexural strength, surface microhardness and surface qualities of 3D printed zirconia and by comparing these results with new and previous test results of zirconia milled from blocks.
The achieved average 3-point flexural strengths for printed zirconia (499 MPa in group Z-2 for specimens printed in horizontal orientation and 576 MPa in group Z-4 for specimens printed in vertical orientation) are low compared to previous test results of Control Group 1 (1143 MPa, milled zirconia) [Citation19]. The density of the printed zirconia is lower than that of milled zirconia, which is also in line with the flexural strength results. This applies also between groups Z-3 and Z-4. Better 3-point flexural strength can still be achieved with the same process by enhancing printing, carbon-debinding and sintering parameters, but the improvement will not be great enough to reach the flexural strength level of Control Group 1. The next step would be to study the possibilities of improving the ceramic precursor slurry.
SEM revealed that in group Z-2 the printing layer thickness varied from 13 μm to over 20 μm. The specimen thickness in group Z-2 varied from 2.04 mm to 2.13 mm. The reasons behind the layer thickness variation and the subsequent specimen thickness variation were not in the scope of this study, but that would be an interesting subject to study further since one might assume that the great variation in layer thickness would cause more variation in specimen thickness as well.
The grain size distribution of the zirconia microstructure can be controlled by sintering temperature. With milled zirconia, the highest flexural strengths have been reached with sintering temperatures from 1400 °C to 1550 °C [Citation21]. The grain size of typical dental zirconia is between 0.4 and 1.0 µm. Smaller particle size leads to lower mechanical strength and larger particle size may cause defects or porosity [Citation21–23]. In this study, the particle size was 0.39 µm which is very close to optimal grain size. Higher sintering temperatures with a range from 1300 °C to 1700 °C equal larger grain size which also means better translucency [Citation21]. In this study translucency was not studied.
Fractography revealed that specimens with low flexural strength exhibit delaminated fracture surfaces as in or rough and granular fracture surfaces as in . When using printing parameters that yielded the specimens with the highest flexural strength, no delamination was detected, as indicated in . Instead, the fracture originated from the surface under tension and the strength was dictated by preexisting surface defects. The fracture surfaces of high strength samples (300–600 MPa) are typical for dense bulk ceramics [Citation24,Citation25]. The effect of parameter change on the flexural strength is mainly controlled by exposure time, which is linked to the curing depth of each layer. It has been shown that longer exposure time leads to better integration between adjacent printing layers which again leads to less delamination [Citation26].
Delamination was found to happen mainly during the debinding phase (0–500 °C for ZrO2) in which the binding polymer matrix is removed by thermal decomposition and evaporation and a fully ceramic bulk is obtained. During heating, delamination can occur due to several parallel mechanisms, at lower temperature by continued polymerization leading to shrinkage () or a possible internal stress relaxation of the polymer while at higher temperature delamination is likely promoted by decomposition and evaporation of monomer and polymer species leading to shrinkage () and by the simultaneous build-up of gas pressure inside the printed specimen. The polymer, copolymer or polymer mixture used determines the rate and critical temperature of gas removal which vary by the composition of the polymer matrix [Citation26,Citation27]. Also the thermal expansion of ceramic particles can promote delamination in the whole debinding temperature range.
The LithaCon 3Y 610 Purple consist of a methacrylic ester and 2-hydroxyethyl methacrylate, yttrium oxide stabilized zirconia particles and other additives [Citation28]. DSC measurements show that if the monomers are not fully polymerized during light exposure and during debinding, monomers continue to polymerize up to 160 °C via exothermic reaction. Because the ceramic particles act as a rigid skeleton in the printed piece, the polymer shrinkage can also partially manifest as a build-up of internal stresses. During the polymerization reaction, acrylic polymers can shrink up to 15 Vol. % [Citation27]. Therefore, between 0 and 160 °C, the polymer shrinkage accompanied by thermal expansion of the ceramic particles can promote delamination during the thermal treatments required after printing. The shrinkage up to 150 °C was confirmed not to include mass loss (decomposition and evaporation) as our reference thermogravimetry measurement shows that mass loss begins after 155 °C. Between 160 and 500 °C the delamination is likely caused by the additional shrinkage steps associated with the onset of thermal degradation. The shrinkage is accompanied by increasing gas pressure due to decomposition and evaporation. This is combined with thermal expansion mismatch between the polymer matrix and the inert ceramic particles.
The study results suggest that the choice of printing parameters, especially a too low exposure time for each individual layer can cause poor interfacial binding between layers and lead to exaggerated delamination during the thermal debinding phase. For a given polymer/ceramic printing slurry, the key to inhibit delamination during the debinding phase would be to prevent the heat induced polymerization reaction leading to shrinkage and to enhance the strength of the interface between the printed layers. Otherwise the effects leading to delamination during debinding can be controlled only by slowing down the heating rate. Additionally, a mixture of polymers exhibiting different curing and thermal degradation properties can be used to reduce the detrimental heating effects leading to delamination [Citation26].
Fractography suggest that delamination typically affects only a portion of the interface between two adjacent layers, as in . After thermal treatments, the sintered sample can look visually unharmed, however the partial delamination acts as a geometrical flaw, considerably lowering the fracture strength as described by the Griffith criterion [Citation29]. It is also important to notice that delamination greatly reduces the load bearing capacity of the sample by reducing the load bearing cross sectional area. Therefore the true fracture stress can be higher than indicated as the calculations assume that the fractured surface area is the full cross-sectional area of the sample.
Finally, we conclude that the overall quality of the printed pieces is highly influenced by the expertise of the user and therefore two batches of samples printed with identical printing parameters can still yield substantially different statistical flexural strength. We found that most of the random changes in the quality of the printed samples occur due to human errors during the printing procedure and during the subsequent cleaning process e.g. because of the cleaning method and the cleaning solvent used. For example, using small molecular weight solvents such as ethanol is detrimental to the quality of the printed parts as the polymer swells by absorbing the solvent, leading to delamination in a similar manner as in thermal debinding. There is also a possibility that some variation in statistical flexural strength is caused by unknown factors such as differences between current commercial feedstocks. In addition, to maintain a consistent printing quality, the stability of the particle dispersion should be well known as aging will eventually cause particle segregation in the printing slurry. A way to control the slurry stability would be to ball mill the slurry before each printing procedure.
Conclusion
3D printed zirconia specimens revealed a lack of interfacial bonding between the printed layers, which resulted in a low average flexural strength compared to the reference milled dental zirconia. Changing the light exposure of each printed layer can improve interfacial bonding, which also enhances the flexural strength of printed zirconia. However, significant improvement is still needed in order for the printed zirconia to compete with the strength of the current state-of-the-art dental zirconia. Therefore future research should focus on creating optimized precursor slurries for the 3D printing of zirconia.
Acknowledgements
The authors thank Dr. Jasmina Bijelic-Donova, Dr. Sufyan Garoushi and Arnold Ismailov for their professional assistance and Genevieve Alfont and Hanna Mark for their assistance in laboratory. This study was a part of Biomaterials and Device Research program, Biocity Turku.
Disclosure statement
The authors report no conflict of interest.
References
- Ebert J, Özkol E, Zeichner A, et al. Direct inkjet printing of dental prostheses made of zirconia. J Dent Res. 2009;88:673–676.
- Wang H, Aboushelib MN, Feilzer AJ. Strength influencing variables on CAD/CAM zirconia frameworks. Dent Mater. 2008;24:633–638.
- Huang H. Machining characteristics and surface integrity of yttria stabilized tetragonal zirconia in high speed deep grinding. Mater Sci Eng A. 2003;345:155–163.
- Barazanchi A, Li KC, Al‐Amleh B, et al. Additive technology: update on current materials and applications in dentistry. J Prosthodont. 2017;26:156–163.
- Abduo J, Lyons K, Bennamoun M. Trends in computer-aided manufacturing in prosthodontics: a review of the available streams. Int J Dent. 2014;2014:783948.
- Silva N, Witek L, Coelho PG, et al. Additive CAD/CAM process for dental prostheses. J Prosthodont. 2011;20:93–96.
- Robert Kelly J. Dental ceramics: current thinking and trends. Dent Clin North Am. 2004;48:513–530.
- Al-Amleh B, Lyons K, Swain M. Clinical trials in zirconia: a systematic review. J Oral Rehabil. 2010;37:641.
- Le M, Papia E, Larsson C. The clinical success of tooth‐ and implant‐supported zirconia‐based fixed dental prostheses. A systematic review. J Oral Rehabil. 2015;42:467–480.
- Abdulmajeed AA, Donovan TE, Cooper LF, et al. Fracture of layered zirconia restorations at 5 years: a dental laboratory survey. J Prosthet Dent. 2017;118:353–356.
- Zocca A, Colombo P, Gomes CM, et al. Additive manufacturing of ceramics: Issues, potentialities, and opportunities. J Am Ceram Soc. 2015;98:1983–2001.
- Zhao X, Evans JRG, Edirisinghe MJ, et al. Direct ink‐jet printing of vertical walls. J Am Ceramic Soc. 2002;85:2113–2115.
- Derby B. Additive manufacture of ceramics components by inkjet printing. Engineering 2015;1:113–123.
- Bourell DL, Marcus HL, Barlow JW, et al. Selective laser sintering of metals and ceramics. Int J Powder Metal. 1992;28:369–381.
- Gonzalez JA, Mireles J, Lin Y, et al. Characterization of ceramic components fabricated using binder jetting additive manufacturing technology. Ceramics Int. 2016;42:10559–10564.
- Díaz Lantada AD, Blas Romero A, Schwentenwein M, et al. Lithography-based ceramic manufacture (LCM) of auxetic structures: present capabilities and challenges. Smart Mater Struct. 2016;25:054015.
- Schwentenwein M, Homa J. Additive manufacturing of dense alumina ceramics. Int J Appl Ceram Technol. 2015;12:1–7.
- International Organization for Standardization. ISO 10477: 2004(E): dentistry – polymer-based crown and bridge materials. 2nd ed. Switzerland; 2004.
- Hjerppe J, Närhi TO, Vallittu PK, et al. Surface roughness and the flexural and bend strength of zirconia after different surface treatments. J Prosthet Dent. 2016;116:577–583.
- Kim M, Ahn J, Kim J, et al. Effects of the sintering conditions of dental zirconia ceramics on the grain size and translucency. J Adv Prosthodont. 2013;5:161–166.
- Stawarczyk B, Özcan M, Hallmann L, et al. The effect of zirconia sintering temperature on flexural strength, grain size, and contrast ratio. Clin Oral Invest. 2013;17:269–274.
- Hjerppe J, Vallittu PK, Fröberg K, et al. Effect of sintering time on biaxial strength of zirconium dioxide. Dent Mater. 2009;25:166–171.
- Hallmann L, Mehl A, Ulmer P, et al. The influence of grain size on low‐temperature degradation of dental zirconia. J Biomed Mater Res. 2012;100B:447–456.
- Quinn GD. Fractography of ceramics and glasses. Gaithersburg, MD: National Institute of Standards and Technology; 2016. DOI: 10.6028/NIST.SP.960-16e2
- Scherrer SS, Lohbauer U, Della Bona A, et al. ADM guidance—ceramics: guidance to the use of fractography in failure analysis of brittle materials. Dent Mater. 2017;33:599–620.
- Johansson E, Lidström O, Johansson J, et al. Influence of resin composition on the defect formation in alumina manufactured by stereolithography. Materials. 2017;10:138.
- Pilichowski K, Njuguna J. Thermal degradation of polymeric materials. Shawbury (UK): Smithers Rapra Technlogy; 2005.
- Material Safety Data Sheet, LithaCon 3Y 610 purple. Lithoz GmbH; 2013.
- Griffith AA. The phenomena of rupture and flow in solids. Trans R Soc A. 1921;221:163–198.