
Abstract
Background: The effects of metformin and fenretinide on insulin resistance and inflammatory mediators were investigated to treat type 2 diabetes mellitus.
Methods: Type 2 diabetes was induced in adult albino Wistar rats via the administration of streptozotocin and nicotinamide. Rats were divided as follows: Group I, control rats administered normal saline solution; Group II, diabetic rats; Group III, diabetic rats treated with metformin; Group IV, diabetic rats administered fenretinide; and Group V, diabetic rats administered both metformin and fenretinide.
Results: Fasting blood glucose (FBG) was increased in diabetic rats compared to control rats (p<0.05). However, both FBG and glycated hemoglobin levels were decreased (p<0.05) in diabetic rats treated with fenretinide and metformin compared to diabetic untreated rats. A positive relationship was identified between RBP4 level and insulin resistance. Further, diabetic rats treated with fenretinide and metformin had decreased RBP4 levels. Conversely, GLUT4 mRNA was markedly increased (p<0.05) in diabetic rats administered fenretinide and metformin, thereby improving insulin sensitivity. TNF-α level showed a direct relationship with the insulin resistance. Evidently, metformin and fenretinide decreased plasma IL-6 level and increased IL-10 levels.
Conclusion: Metformin and fenretinide exhibit individual and synergistic effects when administered to treat diabetes in a rat model.
Abbreviations: RBP4: Retinol-binding protein 4; IL: Interleukin; TNF-α: tumor necrosis factor-alpha; STZ: Streptozotocin; NaF: sodium fluoride; cDNA: complementary DNA; ACTB: beta-actin; GLUT4: glucose transporter type 4; LDL: low-density lipoprotein; VLDL: very-low-density lipoprotein; TAG: triacylglycerol; HDL: high-density lipoprotein; FBG: fasting blood glucose; DIO: diet-induced obese; IR: insulin receptor; TG: triglyceride
Background
Type 2 diabetes mellitus, previously called non-insulin-dependent diabetes mellitus, is the most common form of diabetes (International Diabetes Federation (IDF) Citation2019). Type 2 diabetes mellitus is characterized by high blood glucose, which is related to insulin resistance and insulin deficiency (American Diabetes Association (ADA) Citation2018), and results from insulin resistance enhanced by impaired insulin sensitivity. Impaired insulin secretion occurs due to glucose intolerance (Zaccardi et al. Citation2015).
Retinol-binding protein 4 (RBP4) is known to be a part of the lipocalin family and its synthesis occurs in the liver. RBP4 assembles retinol from different tissues for transportation to the liver (Tarnumihardjo et al. Citation2016). Holo-RBP is discharged in blood which has the thyroxin transporter (TTR). The bond between RBP and TTR may exist to avoid any reduction in the low molecular weight RBP, owing to glomerular filtration in the kidneys. Currently, studies have demonstrated that RBP expression in adipose tissue and its corresponding serum protein level are considerably increased in obese mice and humans. Additionally, the elevation in serum RBP levels was demonstrated to be a precursor of insulin resistance (Kwanbunjan et al. Citation2018). The main capacity of RBP is thought to permit the flow of the hydrophobic nutrient, vitamin A, in blood. Retinol participates in the regulation of energy homeostasis and insulin responsiveness exclusively by acting as a precursor of retinoic acid.
Adipose tissues, including adipocytes or adipose tissue-infiltrated macrophages, secrete numerous biochemicals called ‘adipokines’, such as resistin, adiponectin, visfatin, and leptin, and produce inflammatory chemokines and cytokines, including interleukin-6 (IL6), monocyte chemoattractant protein-1, and tumor necrosis factor-alpha (TNF-α). Long-term secretion of adipokines results in a chronic subinflammatory state and insulin resistance, and may lead to type 2 diabetes. By acting together, insulin resistance and type 2 diabetes lead to risks of cardiovascular diseases in susceptible individuals, which could also result from weight gain (Stojsavljević et al. Citation2014).
Fenretinide is a synthetic retinoid that is being tested in clinical trials for the treatment of breast cancer and insulin resistance, but its mechanism of action has been elusive. Data indicated that fenretinide inhibits dihydroceramide desaturase, an enzyme involved in the biosynthesis of lipotoxicceramides that antagonize insulin action (Shearer et al. Citation2015). Because of this finding, we assessed whether fenretinide could improve insulin sensitivity and glucose homeostasis in vitro and in vivo by controlling ceramide. In addition, metformin is an oral anti-diabetic drug that belongs to the biguanide class and one of the most preferred and prescribed drugs for the treatment of type 2 diabetes. Metformin can be administered to suppress diabetes in individuals with obesity and those with normal kidney function (Jia et al. Citation2019). Metformin lowers blood glucose without increasing insulin secretion, metformin has been considered an insulin sensitizer and can be prescribed for use in insulin-resistant states even before the development of hyperglycemia (Jia et al. Citation2019).
Therefore, the current study was carried out to examine the interrelation between RBP4 and type 2 diabetes, and to explore the impact of metformin and fenretinide on the inflammatory mediators and insulin resistance in type 2 diabetes induced by streptozotocin and nicotinamide.
Methods
Aim, design, and setting
A rat model of diabetes was employed in the present study to explore the effects of metformin and fenretinide on insulin resistance when administered to treat type 2 diabetes mellitus, and reveal their impacts on inflammatory mediators in the suppression of this disorder.
Experimental animals
Adult male Wistar albino rats (weight, 180–200 g) were acquired from Animal House, Faculty of Veterinary Medicine, Zagazig University. A strict environmental condition of 23 ± 4 ˚C was maintained; relative humidity was kept constant at 55 ± 10%; and a 12-h light/dark cycle was adopted. Rats were fed a rationed pellet diet and housed at the above laboratory conditions for 15 days.
Chemicals
Streptozotocin (STZ), nicotinamide, metformin hydrochloride, and N-(4-hydroxyphenyl) retinamide (fenretinide) were obtained from Sigma Aldrich (USA). EDTA, citric acid, sodium citrate, and sodium fluoride were acquired from S.D. Fine Chemicals, India. STZ was freshly prepared by dissolving the required dosage in cold sodium citrate buffer at pH 4.5. Nicotinamide and metformin were dissolved in normal saline solution. Fenretinide was dissolved in dimethyl sulfoxide (DMSO) and resuspended in warmed PBS.
Induction of experimental type 2 diabetes mellitus
Diabetes was induced by a single intraperitoneal injection of 60 mg/kg STZ. STZ was administered 15 min after the intraperitoneal administration of nicotinamide (110 mg/kg). After 7 days of STZ administration, the experimental rats were examined for hyperglycemia. Eighty rats with more than 11.1 mmol/L of fasting blood glucose (hyperglycemia) were used for the study (Szkudelski Citation2012) and divided into the designed experimental group. Increased hepatic glycogenolysis and gluconeogenesis, and decreased utilization of glucose by the tissues, or glucotoxicity are the major factors that cause hyperglycemic effects in diabetes mellitus (Ottosson-Laakso et al. Citation2017).
Experimental design
One hundred rats were divided into 5 groups, each containing 20 rats. Treatment was initiated one week after the STZ administration and continued for 8 weeks. The treatment schedule for each group is listed below.
Group I (control group): Group I comprised 20 non-diabetic control rats who were administered 1 ml/day normal saline for 8 weeks. Body weights were 195.1 ± 2.7 g.
Group II (diabetic-control group): Group II comprised 20 STZ-nicotinamide diabetic rats who were administered 1 ml of saline daily for 8 weeks. Body weights were 194.1 ± 2.6 g.
Group III (diabetic-metformin treated group): Group III comprised 20 STZ-nicotinamide diabetic rats who were intraperitoneally administered 200 mg/kg of metformin once daily for 8 weeks (Kravchuk et al. Citation2011). Body weights were 194.8 ± 3.1 g.
Group IV (diabetic-fenretinide treated group): Group IV comprised 20 STZ-nicotinamide diabetic rats who were intraperitoneally administered 20 mg/kg of fenretinide twice weekly for 8 weeks (Yasuo et al. Citation2013). Body weights were 193.2 ± 3.4 g.
Group V (diabetic rats administered both fenretinide and metformin): Group V comprised 20 STZ- nicotinamide rats. These diabetic rats were administered 20 mg/kg fenretinide (twice weekly) and 200 mg/kg metformin (once daily) for 8 weeks. Body weights were 195.2 ± 2.4 g.
Body weight and blood sample collection
At the end of the experiment, rats were weighed, were kept in fasting for 12 h, and then two blood samples were simultaneously withdrawn at the orbital venous plexus of rats using micropipettes according to Kumar et al. (Citation2017). Sample one was collected in an EDTA tube for measuring glycated hemoglobin. Sample two was retrieved in centrifuge tubes and no anticoagulants were used and thenwere placed in a slant position and centrifuged (600 × g) continuously for 10 min at room temperature. Thereafter, the serum obtained from centrifuged blood was used for measuring glucose and the other biochemical parameters. Afterward, animals were decapitated, and adipose tissues were sampled and kept in liquid nitrogen until analyzed.
Biochemical analysis
We measured the following parameters: blood glucose (Trinder Citation1969), insulin in serum, homeostatic model assessment of insulin resistance (HOMA-IR) and the quantitative insulin sensitivity check index (QUIKI) values (Mather Citation2009), glycated hemoglobin or glycohemoglobin (HbA1c) (Nayak and Pattabiraman Citation1981), lipid profile (commercial kit of Cell BioLabs Inc. San Diego, CA), retinol-binding protein (RBP4) (Casillas-Ramírez et al. Citation2011), and cytokines – TNF-α, IL-6, and IL-10 (commercial kits of ThermoFisher Sci. Waltham, MA, Cat No. # BMS622, BMS625, and BMS629, respectively).
Reverse transcription polymerase chain reaction (RT–PCR)
The semi-quantitative RT–PCR method was used to determine mRNA transcripts expression. Briefly, total RNA was extracted from the retroperitoneal adipose tissue samples according to the manufacturer’s protocol (IQeasyTM Plus CTB RNA Extraction Mini kit, iNtRON Biotechnology, Korea). RNA quality was checked through agarose gel (1.5%) electrophoresis. RNA concentration and purity was measured through NanoDrop 2000 spectrophotometer (Thermofisher, CA, USA). Samples of an A250/A280 ratio of 1.8–2.0 were used for single-stranded complementary DNA (cDNA) synthesis. cDNA synthesis was performed with the Maxime RT Premix Kit (iNtRON Biotechnology, Korea) according to the manufacturer’s instructions. In brief, template RNA (0.1 µg), and distilled water were added into the Maxime RT PreMix tubes (Oligodt) to a total volume of 20 µl. RT reaction was performed at 45°C for 60 min and final inactivation at 85 °C for 5 min. PCR was carried out with the 2X PCR Master mix solution kit (iNtRON Biotech.) based on the manufacturer’s instructions. A 50-µl reaction volume was prepared by dispensing 25 µl of 2X Master mix solution into PCR tubes. Thereafter, 0.1 µg template DNA, gene-specific primers (1 µl forward and 1 µl reverse), and distilled water were added to the PCR tubes to obtain the required volume. The primers used in the RT–PCR assay are presented in Table . The gene expression levels based on the gel bands were analyzed using ImageJ software (version 1.24o) to measure the band intensity in pixels. The fold increase intensity among different bands according to beta-actin (ACTB) expression in the same group was also determined. At least three biological samples (livers) from each group and three technical replicates were used for the analysis.
Table 1. Oligonucleotide sequences used for semi-quantitative PCR.
Statistical analysis
Data were computed and analyzed using the Statistical Package for Social Sciences (SPSS v13.0 software, 2009) to obtain the mean and standard error. The statistical significance of the differences among groups was determined by ANOVA according to Mertler and Reinhart (Citation2017). To determine the inter-group homogeneity, Duncan’s test was performed to serve as the basis for conducting multiple comparisons among groups. Pearson’s correlation was employed to test the different parameters. P-values less than 0.05 (p < 0.05) were considered to indicate significance.
Results
Effect of metformin and fenretinide on body weight and the diabetes parameters (Glucose level, HbA1c, insulin level, and GLUT4 expression)
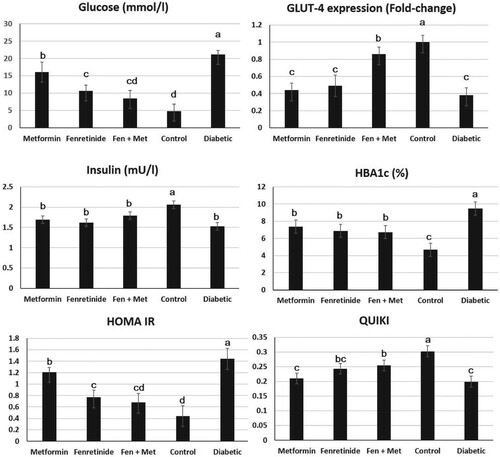
Diabetic rats, and rats administered fenretinide, or metformin showed significant reduction in body weight when compared with control group (196.2 ± 4.1, 195.3 ± 3.8, 196 ± 4.2 vs. 238.6 ± 5.2 g respectively, P < 0.05). However, the body weight of combined fenretinide, and metformin administration showed a significant increase when compared with the other three diabetic groups (221.6 ± 7.2 g, P < 0.05), but lower than the control group (P < 0.05). Blood glucose level showed significant elevation (p < 0.05) in diabetes-induced rats compared to normal rats. However, rats administered fenretinide, metformin, or both, exhibited a lower glucose level than the untreated rats (Figure ). Collectively, the glucose level in these groups was significantly lower than that in the group of diabetic untreated rats (p < 0.05). Similarly, diabetic rats had a marked increase (p < 0.05) in HbA1c levels compared to normal rats. Additionally, HbA1c concentration in rats administered both fenretinide and metformin was decreased (p < 0.05) relative to that of the diabetic untreated rats (Figure ). Conversely, compared to normal rats, insulin levels were depleted in diabetic rats (p < 0.05) and rats administered both fenretinide and metformin had an evident increase (p < 0.05) in insulin concentration compared to diabetic rats (Figure ). Moreover, the expression level of GLUT4 was considerably (p < 0.05) increased in diabetic rats relative to that in the other groups. Additionally, diabetic rats administered either fenretinide, metformin, or both, had a considerable increase (p < 0.05) in GLUT4 gene expression compared to diabetic rats (Figure ).
Figure 1. Effect of metformin and fenretinide on the diabetes parameters in STZ-induced diabetic rats. Fen + Met: combined fenretinide and metformin administration. GLUT4 fold-change was calculated through imageJ pixel analysis in comparison to the corresponding GAPDH expression. HBA1c: glycated hemoglobin. HOMA IR: homeostatic model assessment of insulin resistance. QUIKI: the quantitative insulin sensitivity check index. Data are expressed as mean ± S.E. Values with different letters (a, b, c, and d) are statistically different (p < 0.05).
Effect of metformin and fenretinide on lipid profile
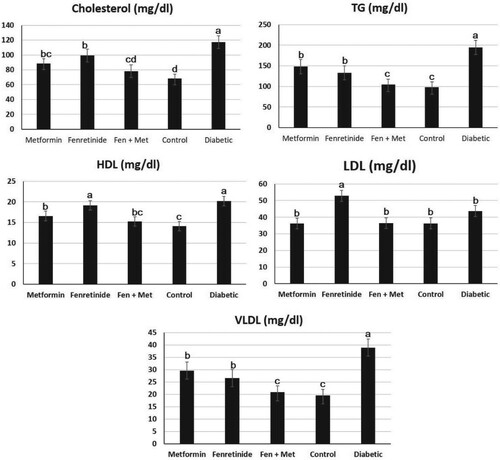
By examining the lipid profile, we found that low-density lipoprotein (LDL), very low-density lipoprotein level (VLDL), triacylglycerol (TAG), and cholesterol, (p < 0.05) were considerably increased in diabetic rats compared to normal rats (Figure ). Conversely, rats administered fenretinide or metformin had an evident decrease (p < 0.05) in LDL, VDL, TAG, and cholesterol compared to diabetic rats. However, diabetic rats had an evident increase in high-density lipoprotein (HDL) compared to normal rats (Figure ). Additionally, Figure demonstrates that rats administered either fenretinide, metformin, or both, had an evident increase (p < 0.05) in HDL levels compared to diabetic rats.
Figure 2. Effect of metformin and fenretinide on the lipid profile of STZ-induced diabetic rats. Fen, Fenretinide; Met, Metformin. TG: total glycerides. HDL: high-density lipoproteins. LDL: low-density lipoproteins. VLDL: very low-density lipoproteins. Data are expressed as mean ± S.E. Values with different letters (a, b, and c) are statistically different (p < 0.05).
Effect on retinol-binding protein (RBP4) level
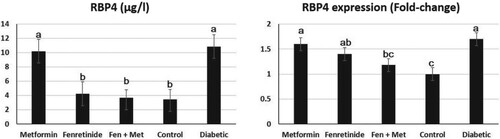
The level of RBP4 in rats administered fenretinide was significantly decreased (p < 0.05) relative to that of rats in the other groups (Figure ). A similar result pattern was observed in rats administered both fenretinide and metformin. Conversely, an evident increase (p < 0.05) in RBP4 concentration was identified in diabetic rats as shown in Figure . Compared to rats in other groups, the expression level of the RBP4 gene in the adipose tissue was notably improved (p < 0.05) in diabetic rats. Similarly, diabetic rats administered either fenretinide, metformin, or both had an evident reduction (p < 0.05) in adipose tissue RBP4 gene expression compared to diabetic rats (Figure ).
Figure 3. Effect of metformin and fenretinide on retinol-binding protein 4 (RBP4) in STZ-induced diabetic rats. RBP4: retinol-binding protein. The fold-change was calculated through imageJ pixel analysis in comparison to the corresponding GAPDH expression. Fen, Fenretinide; Met, Metformin. Data are expressed as mean ± S.E. Values with different letters (a, b, and c) are statistically different (p < 0.05).
Effect of fenretinide and metformin on inflammatory mediators (TNF-α, IL-6, and IL-10)
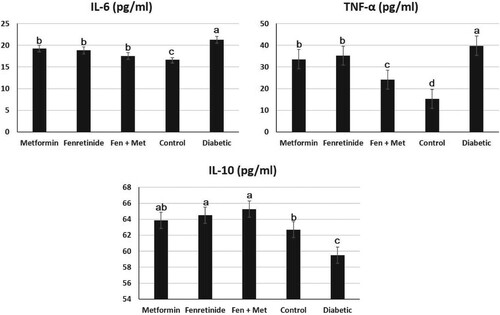
Figure presents the levels of TNF-α in diabetic and treated rats. In rats administered either metformin, fenretinide, or both drugs, the levels of TNF-α were notably reduced relative to those of diabetic rats. Additionally, TNF-α was evidently increased in diabetic rats compared to that in diabetic untreated rats (p < 0.05). Additionally, the levels of IL-6 were considerably increased in diabetic rats compared to normal rats. However, after rats were treated with either fenretinide, metformin, or both drugs, the levels of IL-6 were notably reduced (p < 0.05) compared to those of diabetic untreated rats (Figure ). Furthermore, the levels of IL-10 were notably reduced in diabetic rats compared to normal rats. However, IL-10 level was notably increased (p < 0.05) in diabetic rats administered either fenretinide, metformin, or both drugs compared to diabetic untreated rats (Figure ).
Figure 4. Effect of metformin and fenretinide on the inflammatory mediators in STZ-induced diabetic rats. IL: interleukin. TNF-α: tumor necrosis factor. Data are expressed as mean ± S.E. Values with different letters (a, b, and c) are statistically different (p < 0.05). Fen, Fenretinide; Met, Metformin.
Correlation among different parameters in the study
The correlation among different parameters in the present study was calculated. Table presents a comprehensive result of the correlation coefficient (R) among the parameters of the study and reveals a strong negative correlation between the diabetic markers, insulin and glucose (R = −0.847). A strong positive correlation was found between TNF-α and RBP4 (R = 0.723). Similarly, a positive correlation was found between GLUT4 mRNA and RBP4 (R = −0.789). When tested with other parameters, a positive correlation was also identified for TNF-α and IL-6: TNF-α-glucose (R = 0.886); TNF-α-RBP4 mRNA (R = 0.939); and TNF-α-HbA1c (R = 0.904). TNF-α and IL-6 displayed a strong negative correlation with the remaining parameters: TNF-α-insulin (−0.984) and TNF-α-GLUT4 mRNA (−0.974). However, this positive correlation was not observed with IL-10. For IL-10, a moderate correlation was recorded when tested with the parameters, IL-10-glucose (−0.627) and IL-10-HbA1c (−0.546). Moreover, Table shows the strong positive correlation (R = 0.962) between RBP4 and HOMA-IR values. This positive correlation indicates that insulin resistance increases as RBP4 level increases. As shown in Table , QUIKI level and RBP4 have a strong negative correlation (R = −0.870), thereby corresponding with the above finding that insulin sensitivity decreases as RBP4 level increases.
Table 2. Correlation among the different parameters in the study.
Table 3. Correlation among insulin resistance, insulin sensitivity, and RBP4.
Discussion
To determine the hypoglycemic effects of fenretinide in the present study, diabetes was induced in animals using STZ and nicotinamide. The STZ-nicotinamide injection causes type 2 diabetes mellitus by degenerating β-cells of the islets of Langerhans, whereas, nicotinamide is administered to partially protect insulin-secreting cells against depletion of intracellular NAD(+) and ATP caused by STZ (Szkudelski Citation2012).
Expectedly, the body weight of diabetic rats showed significant reduction in body weight gain but this reduction was not improved by single administration of either fenretinide or metformin, however, it was improved by the combined administration of both of them. This result coincides with previous reports (American Diabetes Association (ADA) Citation2018; Zaccardi et al. Citation2015; Stojsavljević et al. Citation2014), in terms of negative impact of diabetes on body weight. Furthermore, we found a strong negative correlation (R = −0.847) between the diabetic markers, insulin and glucose. This finding indicates that biomarkers of insulin sensitivity might be independently associated with glucose intolerance (De Leon et al. Citation2018). Furthermore, a positive correlation was found between GLUT4 mRNA and RBP4 (R = −0.788), thereby aligning with the results of Grosjean et al. (Citation2017). However, this finding does not indicate an association with insulin levels.
Previous studies revealed that RBP4 increases the risk of insulin resistance in lean mice while RBP4-deficient mice do not experience insulin resistance induced by a high-fat diet (Noy Citation2016; Codoner-Franch et al. Citation2016). In accordance with the finding of Moraes-Vieira et al. (Citation2016), suppression of type 2 diabetes in mice with RBP4 was found to degrade insulin signaling in muscles, adipocytes, and liver (Grosjean et al. Citation2017). Codoner-Franch et al. (Citation2016) found a strong correlation between the increase in serum RBP4 and obesity; this includes the obesity-related pathologies, inflammation, fatty liver disease, and insulin resistance. Reduced serum RBP4 level is one of the novel therapeutic methods for reducing insulin resistance. Particularly, hepatic RBP4 modulates glucose metabolism (Ma et al. Citation2016). The binding of fenretinide to RBP4 prevents its association with TTR. As a result, small proteins are rapidly lost through renal glomerular filtration. In particular, fenretinide restrains excess weight gain, improves glucose homeostasis in mice, and exhibits pleiotropic effects on cellular pathways (Morrice et al. Citation2017).
Treatment with metformin in diabetic rats led to an evident reduction in FBG (Duca et al. Citation2015) and this effect was potentially noticed by combined dosage of fenretinide and metformin which suggests the synergistic effect of fenretinide as an antihyperglycemic agent. Altogether, Mcilroy et al. (Citation2013) concluded that fenretinide completely normalizes hyperglycemia and improves high blood glucose level. Furthermore, regarding GLUT4 expression, Hu et al. (Citation2015) and Yonamine et al. (Citation2017) revealed a negative correlation between RBP4 and GLUT4 in type 2 diabetic rats and human patients, respectively. Nonetheless, GLUT4 can be restored when type 2 diabetes treated as a negative feedback mechanism to regulate adipose tissue glucose uptake (Yonamine et al. Citation2017).
Additionally, Mcilroy et al. (Citation2013) reported that four weeks of fenretinide administration yielded significant results in tissue lipid profiles. Fenretinide also enhances insulin sensitivity in diet-induced obese (DIO) mice. Specifically, ceramide levels were downregulated while dihydroceramides levels were upregulated in DIO mice administered fenretinide. The increase and decrease in ceramide and dihydroceramides are associated with the reduced HOMA-IR value (Mcilroy et al. Citation2013). Enhanced glucose and insulin tolerance and enhanced GLUT4 gene expression were also observed.
Conversely, results showed that insulin level was notably increased in rats administered fenretinide and metformin which aligns with the findings of Catalano et al. (Citation2014) who revealed that the insulin receptor (IR) is downregulated in obesity and insulin resistance, which is indirectly correlated with insulin levels. Mcilroy et al. (Citation2013) concluded that adipose insulin receptor proteins are considerably lower in high-fat diet mice, thereby demonstrating the negative relationship with obesity and serum insulin levels. Nonetheless, this reduction could be attenuated by fenretinide treatment.
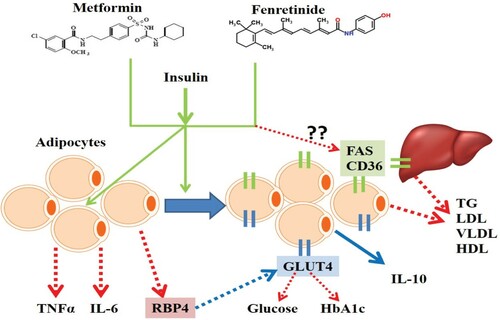
HbA1c was significantly reduced by fenretinide, metformin, or both, was due to the standardization of insulin secretion. This standardization was due to the remaining pancreatic β-cells in treated rats, which subsequently resulted in the control of the glycemic properties (Krhac and Lovrencic Citation2019; Vasques et al. Citation2016). Moreover, co-treatment fenretinide and metformin improved the lipid profile (TG, HDL LDL, and VLDL) in diabetic rats. These results coincide with those of Mcilroy et al. (Citation2013) who observed that fenretinide administration improved the lipid content in diabetic rats. This effect might be due to the reduction in fatty acid synthase (FAS) and fatty acid translocase (CD36) in adipose tissue or the liver, however, further investigations are required in this regard (Figure ).
Figure 5. The proposed synergistic action of metformin and fenretinide to treat insulin resistance. In the presence of insulin, both metformin and fenretinide act on adipocytes to reduce inflammatory cytokines (IL-6 and TNFα) and RBP4. They also increase the expression of GLUT4 and IL-10. RBP4 downregulates GLUT4 in diabetes and this action diminished by the presence of metformin and fenretinide. They also might reduce the expression of fatty acid synthase (FAS) and fatty acid translocase (CD36) either in adipocytes or in the liver and by which they reduce the lipid parameters such as TG, LDL, VLDL, and HDL, however, this part requires further experimental confirmation.
The elevated plasma RBP4 levels were positively associated with insulin resistance; it can also cause type 2 diabetes (Kwanbunjan et al. Citation2018). These results correspond with those of Mody and Mcilroy (Citation2014) who reported that fenretinide reduces the serum retinol–binding protein found in the bodies of humans and rodents. Further, fenretinide annihilates the ternary complex of retinol-RBP4, thereby encouraging renal clearance of RBP4. Additionally, Mody and Mcilroy (Citation2014) reported that decreasing serum RBP4 is one of the new therapeutic methods for controlling insulin resistance, which is a function of fenretinide.
Results showed that fenretinide, metformin, or both, decreased serum TNF-α concentration. Adipocytes secrete TNF-α in rodents and humans and it doubles as a precursor of insulin (Zhao et al. Citation2015), thereby agreeing with the findings of Zhao et al. (Citation2015) who reported that increased TNF-α levels are associated with insulin resistance, which leads to type 2 diabetes. Cytokines play an imperative role in the development of insulin resistance. Norseen et al. (Citation2012) reported that RBP4 reduces insulin signaling in adipocytes. Additionally, it acts independently to indirectly induce proinflammatory cytokine (including TNF-α) secretion in microphages, thereby explaining the high levels of TNF-α in diabetic rats who already possess high RBP4 levels that coincides with our findings in Table and illustrated in Figure . This finding aligns with that of Liu et al. (Citation2014) who revealed a correlation between the diabetic marker, RBP4, and the pro-inflammatory cytokine, TNF-α. TNF-α, however, downregulates RBP4 production (Kotnik et al. Citation2013).
Our findings align with those of Donia et al. (Citation2016) and Mauer al. (2015) who reported that plasma IL-6 levels play a significant pathogenic role in subduing type 2 diabetes. Zabetian-Targhi et al. (Citation2015) reported that holo-RBP4 or apo-RBP4 causes the expression of cardiovascular and inflammatory risk markers, such as TNF-α, IL-6, MCP-1, IFN-γ, IL-1β, IL-2, IL-12, IL-8, and IL-10 in macrophages. Additionally, Hong et al. (Citation2014) demonstrated that fenretinide suppressed the synthesis of ceramide, lowered JAK-STAT, PI3K-Akt, PKC, and NF-Κb signaling, and reduced the pro-inflammatory cytokines, IL-6, IL-1β, and prostaglandin E2, which are expressed because of infections. The levels of IL-1β, IL-6, and prostaglandin E2 were also found to be reduced by fenretinide. On the other hand, IL-10 exhibits beneficial metabolic effects (Donia et al. Citation2016; Ip et al. Citation2017). Our findings are similar to those of Alizadeh et al. (Citation2018) who revealed a lower mRNA expression of IL-10 in type 2 diabetic patients compared to non-diabetic subjects. Thus, reduced levels of serum IL-10 might lead to type 2 diabetes. IL-6 and IL-10 are known to exhibit contrasting properties as cytokines. Correspondingly, this study only recorded a mild correlation between these cytokines (R= −0.656). Similarly, other studies have reported their contrasting properties regarding insulin resistance (Daniele et al. Citation2014; Rodrigues et al. Citation2017).
Conclusion
Metformin is one of the preferred drugs for attenuating type 2 diabetes mellitus. As a result, numerous studies have been performed to improve its efficacy. Fenretinide has also become increasingly popular as a treatment option for obesity. Herein, both metformin and fenretinide were found to exhibit individual and combined effects on insulin resistance and improve the inflammatory mediators, which serve as precursors of type 2 diabetes mellitus. We summarized the findings and the proposed mechanism of action of metformin and fenretinide in adjusting GLUT4 expression, inflammatory mediators, and RBP4 for treating induced type 2 diabetes mellitus (Figure ). Such findings demonstrate the plethoric effects of metformin and fenretinide on the suppression of type 2 diabetes mellitus, however, further investigations are required to examine their effects on glucose and fatty acid metabolic pathways.
Ethics approval and consent to participate
The study was approved by the Zagazig University Research Center, Institutional Animal Care and Use Committee (IACUC) under number ZU-IACUC/2/F/32/2018.
Acknowledgements
We extend our thanks to the DSR and RSSU (Researchers Support and Services Unit) of King Saud University for their technical support. M.A.H., H.E., and M.A.M. conceived and designed the research. M.A.H. and M.A.M. conducted the experiments. M.H.H., I.M.S., and G.M.A. analyzed the data. M.H.H., M.A-D., A.A.S. and I.M.S. wrote the manuscript. G.M.A. acquired the funding. All authors read and approved the manuscript.
Disclosure statement
No potential conflict of interest was reported by the author(s).
Additional information
Funding
References
- Alizadeh S, Mazloom H, Sadeghi A, Emamgholipour S, Golestani A, Noorbakhsh F, Khoshniatnikoo M, Meshkani R. 2018. Evidence for the link between defective autophagy and inflammation in peripheral blood mononuclear cells of type 2 diabetic patients. J Physiol Biochem. 74(3):369–379. doi:https://doi.org/10.1007/s13105-018-0624-2.
- American Diabetes Association (ADA). 2018. Classification and diagnosis of diabetes: standards of medical care in diabetes. Diabetes Care. 41:S13–S27. doi:https://doi.org/10.2337/dc18-S002.
- Casillas-Ramírez A, Alfany-Fernández I, Massip-Salcedo M, Juan ME, Planas JM, Serafín A, Pallàs M, Rimola A, Rodés J, Peralta C. 2011. Retinol-bindingprotein 4 and peroxisome proliferator-activated receptor-cin steatotic liver transplantation. J Pharmacol Exp Ther. 338:143–153. doi: https://doi.org/10.1124/jpet.110.177691
- Catalano KJ, Maddux BA, Szary J, Youngren JF, Goldfine ID, Schaufele F. 2014. Insulin resistance induced by hyperinsulinemia coincides with a persistent alteration at the insulin receptor tyrosine kinase domain. PLoS One. 9(9):e108693. doi:https://doi.org/10.1371/journal.pone.0108693.
- Codoner-Franch P, Carrasco-Luna J, Allepuz P, Codoner-Alejos A, Guillem V. 2016. Association of RBP4 genetic variants with childhood obesity and cardiovascular risk factors. Pediatr Diabetes. 17(8):576–583. doi:https://doi.org/10.1111/pedi.12339.
- Daniele G, Guardado Mendoza R, Winnier D, Fiorentino TV, Pengou Z, Cornell J, Andreozzi F, Jenkinson C, Cersosimo E, Federici M, et al. 2014. The inflammatory status score including IL-6, TNF-α, osteopontin, fractalkine, MCP-1 and adiponectin underlies whole-body insulin resistance and hyperglycemia in type 2 diabetes mellitus. Acta Diabetol. 51(1):123–131. doi:https://doi.org/10.1007/s00592-013-0543-1.
- De Leon ER, Brinkman JA, Fenske RJ, Gregg T, Schmidt BA, Sherman DS, Cummings NE, Peter DC, Kimple ME, Lamming DW, et al. 2018. Age-dependent protection of insulin secretion in diet-induced obese mice. Sci Rep. 8:17814. doi: https://doi.org/10.1038/s41598-018-36289-0
- Donia SS, Abd El Gayed EM, El-Hefnawy SM, Ragheb A. 2016. The association between interleukin-10 gene promoter polymorphism and insulin resistance in type 2 diabetes mellitus. Am J Clin Exp Med. 4(3):81–87. doi: https://doi.org/10.11648/j.ajcem.20160403.18
- Duca FA, Clemence DC, Rasmussen BA, Zadeh-Tahmasebi M, Rutter GA, Filippi BM, Lam TK. 2015. Metformin activates a duodenal Ampk-dependant pathway to lower hepatic glucose production in rats. Nat Med. 21:506–511. doi: https://doi.org/10.1038/nm.3787
- Grosjean F, Esposito P, Maccarrone R, Libetta C, Dal Canton A, Rampino T. 2017. RBP4: a culprit for insulin resistance in the end-stage renal disease that can be cleared by hemodiafiltration. BioMed Res Int. 7270595. doi:https://doi.org/10.1155/2017/7270595.
- Hong Y, Michael V, Jacek B. 2014. Fenretinide inhibited de novo ceramide synthesis and pro-inflammatory cytokines induced by A. actinomycetemcomitans. J Lipid Res. 54(1):189–201.
- Hu H, Xu M, Qi R, Wang Y, Wang C, Liu J, Luo L, Xia L, Fang Z. 2015. Sitagliptin downregulates retinol-binding protein4 and upregulates glucose transporter type 4 expression in type 2 diabetes mellitus rat models. Int J Clin Exp Med. 8(10):17902–17911.
- International Diabetes Federation (IDF). 2019. Diabetes atlas. 7th ed. [accessed 2019 Dec 16]http://www.diabetesatlas.org.
- Ip WKE, Hoshi N, Shouval DS, Snapper S, Medzhitov R. 2017. Anti-inflammatory effect of IL-10 mediated by metabolic reprogramming of macrophages. Science. 356(6337):513–519. doi:https://doi.org/10.1126/science.aal3535.
- Jia Y, Lao Y, Zhu H, Li N, Leung SW. 2019. Is metformin still the most efficacious first-line oral hypoglycaemic drug in treating type 2 diabetes? A network meta-analysis of randomized controlled trials. Obes Rev. 20(1):1–12. doi:https://doi.org/10.1111/obr.12753.
- Kotnik P, Keuper M, Wabitsch M, Fisher-Posovszky P. 2013. Interleukin-1b downregulates RBP4 secretion in human adipocytes. PLoS One. 8(2):e57796. doi: https://doi.org/10.1371/journal.pone.0057796
- Kravchuk E, Grineva E, Bairamov A, Galagudza M, Vlasov T. 2011. The effect of metformin on the myocardial tolerance to ischemia-reperfusion injury in the rat model of diabetes mellitus type II. Exp Diabetes Res. 2011:1–5. doi:https://doi.org/10.1155/2011/907496.
- Krhac M, Lovrencic MV. 2019. Update on biomarkers of glycemic control. World J Diabetes. 10(1):1–15. doi:https://doi.org/10.4239/wjd.v10.i1.1.
- Kumar M, Sukumar D, Manoranjan PS, Kumar A, Raipat BS. 2017. Different blood collection methods from rats: A review. Balneo Res. J. 8(1):46–50. doi: https://doi.org/10.12680/balneo.2017.141
- Kwanbunjan K, Panprathip P, Phosat C, Chumpathat N, Wechjakwen N, Puduang S, Auyyuenyong R, Henkel I, Schweigert FJ. 2018. Association of retinol binding protein 4 and transthyretin with triglyceride levels and insulin resistance in rural Thais with high type 2 diabetes risk. BMC Endocr Dis. 18(1). doi:https://doi.org/10.1186/s12902-018-0254-2.
- Liu Y, Wang D, Li D, Sun R, Xia M. 2014. Associations of retinol-binding protein 4 with oxidative stress, inflammatory markers, and metabolic syndrome in a middle-aged and elderly Chinese population. Diabetol Metab Syndr. 6:25. doi: https://doi.org/10.1186/1758-5996-6-25
- Ma X, Zhou Z, Chen Y, Wu Y, Liu Y. 2016. RBP4 function as a hepatokine in the regulation of glucose metabolism by the circadian clock in mice. Diabetologia. 59(2):354–362. doi: https://doi.org/10.1007/s00125-015-3807-1
- Mather K. 2009. Surrogate measures of insulin resistance: of rats, mice, and men. Am J Physiol Endocrinol Metab. 296:E398–E399. doi: https://doi.org/10.1152/ajpendo.90889.2008
- Mauer J, Denson JL, Bruning JC. 2015. Versatile function of IL-6 in metabolism and cancer. Trends Immunol. 36(2):92–101. doi: https://doi.org/10.1016/j.it.2014.12.008
- Mcilroy GD, Delibegovic M, Owen C, Stoney PN, Shearer KD, McCaffery PJ, Mody N. 2013. Fenretinide treatment prevents diet-induced obesity in association with major alterations in retinoid homeostatic gene expression in adipose liver and hypothalamus. Diabetes. 62:825–836. doi: https://doi.org/10.2337/db12-0458
- Mertler CA, Reinhart RV. 2017. Advanced and multivariate statistical methods – practical application and interpretation. 6th ed. New York: Routledge. p. 71–96.
- Mody N, Mcilroy GD. 2014. The mechanism of fenretinide-mediated anti-cancer activity and prevention of obesity and type-2 diabetes. Biochem Pharmacol. 91:277–286. doi: https://doi.org/10.1016/j.bcp.2014.07.012
- Moraes-Vieira PM, Saghatelian A, Kahn BB. 2016. GLUT4 expression in adipocytes regulates de novo lipogenesis and levels of a novel class o lipids with antidiabetic and anti-inflammatory effects. Diabetes. 65(7):1808–1815. doi:https://doi.org/10.2337/db16-0221.
- Morrice N, Mcilroy GD, Tammireddy SR, Reekie J, Shearer KD, Doherty MK. 2017. Elevated fibroblast growth factor 21 (FGF21) in obese, insulin resistance states is normalized by the synthetic retinoid, Fenretinide in mice. Sci Rep. 7(7):43782. doi:https://doi.org/10.1038/srep43782.
- Nayak SS, Pattabiraman TN. 1981. A new colorimetric method for the estimation of glycosylated hemoglobin. Clin Chim Acta. 109:267–274. doi: https://doi.org/10.1016/0009-8981(81)90312-0
- Norseen J, Hosooka T, Hammarstedt A, Yore MM, Kant S, Aryal P, Kiernan UA, Phillips DA, Maruyama H, Kraus BJ, et al. 2012. Retinol-binding protein 4 inhibits insulin signaling in adipocytes by inducing proinflammatory cytokines in macrophages through a c-Jun N-terminal kinase- and toll-like receptor 4-dependent and retinol-independent mechanism. Mol Cell Biol. 32(10):2010–2019. doi:https://doi.org/10.1128/MCB.06193-11.
- Noy N. 2016. Vitamin A in regulation of insulin responsiveness: mini review. Proc Nutr Soc. 75(2):212–215. doi: https://doi.org/10.1017/S0029665115004322
- Ottosson-Laakso E, Krus U, Storm P, Prasad RB, Oskolkov N, Ahlqvist E. 2017. Glucose-induced changes in gene expression in human pancreatic islets – causes or consequences of chronic hyperglycemia. Diabetes. 66(12):3013–3028. doi:https://doi.org/10.2337/db17-0311.
- Rodrigues KF, Pietrani NT, Bosco AA, Campos FMF, Sandrim VC, Gomes KB. 2017. IL-10, TNF-( and IL-10 levels/polymorphisms and their association with type 2 diabetes mellitus and obesity in Brazillian individuals. Arch Endocrinol Metab. 61(5). doi:https://doi.org/10.1590/2359-3997000000254.
- Shearer KD, Morrice N, Henderson C, Reekie J, Mcilroy GD, McCaffery PJ, Delibegovic M, Mody N. 2015. Fenretinide prevents obesity in aged female mice in association with increased retinoid and estrogen signaling. Obesity. 23(8):1655–1662. doi: https://doi.org/10.1002/oby.21164
- Stojsavljević S, Palčić GM, Jukić LV, Duvnjak LS, Duvnjak M. 2014. Adipokines and proinflammatory cytokines: The key mediators in the pathogenesis of nonalcoholic fatty liver disease. World J Gastroenterol. 20(48):18070–18091. doi:https://doi.org/10.3748/wjg.v20.i48.18070.
- Szkudelski T. 2012. Streptozotocin-nicotinamide-induced diabetes in the rat. Characteristics of the experimental model. Exp Biol Med. 237(5):481–490. doi:https://doi.org/10.1258/ebm.2012.011372.
- Tarnumihardjo SA, Russell RM, Stephensen CB, Gannon BM, Craft NE, Haskell MJ, Lietz G, Schulze K, Raiten DJ. 2016. Biomarkers of nutrition for development (BOND) – vitamin A review. J Nutr. 146(9):1816S–1848S. doi: https://doi.org/10.3945/jn.115.229708
- Trinder P. 1969. Determination of blood glucose using an oxidase-peroxidase system with a non-carcinogenic chromogen. J Clin Pathol. 22(2):158–161. doi: https://doi.org/10.1136/jcp.22.2.158
- Vasques AC, Pareja JC, da Saude de Oliveira M, Novaes FS, Lima MM, Chaim EA. 2016. Long-term Outcome of biliopancreatic diversion on glycemic control, insulin sensitivity and beta cell function. Obes Surg. 26(11):2572–2580. doi: https://doi.org/10.1007/s11695-016-2159-3
- Yasuo M, Mizuno S, Allegood J, Kraskauskas D, Bogaard HJ, Spiegel S, Voelkel NF. 2013. Fenretinide causes emphysema, which is prevented by sphingosine 1-phoshate. PLoS One. 8(1):e53927. doi:https://doi.org/10.1371/journal.pone.0053927.
- Yonamine CY, Machado EP, Michalani ML, Alves-Wagner AB, Esteves JV, Freitas HS. 2017. Resveratrol improves glycemic control in type 2 diabetic obese mice by regulating glucose transporter expression in skeletal muscle and liver. Molecule. 22:1180. doi:https://doi.org/10.3390/molecules22071180.
- Zabetian-Targhi F, Mahmoudi MJ, Rezaei N, Mahmoudi M. 2015. Retinol-binding protein 4 in relation to diet, inflammation, immunity and cardiovascular diseases. Adv Nutr. 6(6):748–762. doi:https://doi.org/10.3945/an.115.008292.
- Zaccardi F, Webb DR, Yates T, Davies MJ. 2015. Pathophysiology of type 1 and type 2 diabetes mellitus: a 90-year perspective. Postgrad Med J. 92(1084):63–69. doi:https://doi.org/10.1136/postgradmedj-2015-133281.
- Zhao H, Huang X, Jiao J, Zhang H, Liu J, Qin W. 2015. Protein phosphatase 4 (PP4) functions as a critical regulator in tumor necrosis factor (TNF)-α-induced hepatic insulin resistance. Sci Rep. 5(1). doi:https://doi.org/10.1038/srep18093.