
 ?Mathematical formulae have been encoded as MathML and are displayed in this HTML version using MathJax in order to improve their display. Uncheck the box to turn MathJax off. This feature requires Javascript. Click on a formula to zoom.
Abstract
Microbial fuel cell (MFC) has novel technological advances in simultaneous power generation and wastewater treatment applications. In this study, low-cost biosynthesized α-MnO2 nanoparticles integration with conducting polyaniline (PANI) matrix to form α-MnO2/PANI hybrid nanocomposite was fabricated by in situ polymerization method. The prepared material was characterized through UV-Vis spectroscopy, XRD, FTIR, TGA-DTA, DSC, SEM, cyclic voltammetry, and impedance spectroscopy. MFC performance study was done by using an external resistance in the range of 100 Ω–100 kΩ. The continuous test on bare pencil graphite electrode (PGE), α-MnO2/PGE, PANI/PGE, and α-MnO2/PANI/PGE were evaluated in glucose-fed-Escherichia coli-based MFC. It was found that α-MnO2/PANI/PGE produces a maximum power and current densities of 426.26 ± 38.89 mW m−2 and 2485.51 ± 397.31 mA m−2, respectively. This was 6.5 and 5.7-fold higher in power and current densities than unmodified PGE. The maximum chemical oxygen demand produced by hybrid composite modified anode during closed circuit voltage or with external resistance and open circuit voltage (OCV) (circuit without connecting external resistance) measurements were found to be 88.19% and 92.27%, respectively. A maximum of 650.61 ± 10.11 mV OCV was obtained by α-MnO2/PANI/PGE while 222.36 ± 8.16 mV of OCV was generated by PGE.
Introduction
Environmental pollution along with energy crisis is causing a determinant effect on human health and lives on ecosystems. Producing alternative energy in the form of bioelectricity and wastewater treatment from organic liquid effluents is thus the key strategy to reduce energy crises and to keep the environment healthy (Dessie et al. Citation2020a). To address such problems, emphasis has been given to microbial fuel cell (MFC) device system due to its technological novelty (Malik et al. Citation2014 ). MFC therefore produces energy by transforming organic matter into electricity through the metabolic activities of inoculated bacteria (Li et al. Citation2018). As an advantage, MFC is better in application than other conventional energy conversion and pollutant removal methods due to the less activated sludge production, no need for additional energy investment for aeration, simple operation at mils condition, and environmental friendly (Yaqoob et al. Citation2020). Due to this reasons, various research advancements have been focused up on it to produce such clean energy with simultaneous waste treatments from various waste discharges (Li et al. Citation2018; Dessie et al. Citation2019). From all components of MFC, the anode electrode plays a primary role in energy conversion and pollutant removal. Conventional carbons, metal/metal oxides, and conducting polymers are the most common electrode materials to build anode in MFC operation. However, the poor chemical and mechanical stability, small surface area, large pore size, non-biocompatibility, corrosion, and high cost across such ranges of materials limits both power output and wastewater treatment efficiencies in MFC (Wu et al. Citation2018; Yaqoob et al. Citation2020). Therefore, to solve these challenges, modifying a conventional electrode with most conductive and high-quality materials is required. These materials are functional nanocomposites (Evelyn et al. Citation2019).
Anode materials selection in MFC device system is still a critical issue to achieve a successful electrochemical efficiency, electron transfer rate, andbacterial adhesion. This happening is due to low electrical conductivity which enables the flow of electron and increases speed followed by decreasing bulk electrolyte resistance, low surface area which increases resistance power, biocompatibility which directly defines bacterial contact and increasing their respiration process, low stability with low durability, and low availability and high cost (Yaqoob et al. Citation2020). To address those factors, building a functional metal organic framework strategies from novel Co-based N-doped carbon (Li et al. Citation2018), Co9S8 nanoparticles (NPs) coupled (Li et al. Citation2019) and Co3O4 NPs decorated (Tan et al. Citation2017) with nitrogen-doped hollow carbon sphere, porous Co3O4 decorated nitrogen-doped grapheme (Tan et al. Citation2018), and gallic acid-assisted Pd anchored on porous nitrogen-doped reduced graphene oxide (Wu et al. Citation2018) are the most advanced way to enhance MFC performance by increasing the stability and electrocatalytic activity. In addition, the surface degree of surface roughness of anode should be high to detach water molecule and to offer more active sites for bacterial attachments (Hindatu et al. Citation2017). Conventional carbon-based material are commonly utilized to fabricate anode electrodes due to the fulfillment of least requirements stated above make them very suitable anode in MFC performance. Apart from these, pencil graphite electrodes (PGEs) is one of the most suitable anode material in MFC due to its biocompatibility, availability, renewability, reproducibility, and disposability during its operation (Kariuki et al. Citation2015; David et al. Citation2017; Tsuji et al. Citation2019). However, PGE and other conventional carbon electrodes like graphite felt (Ringeisen et al. Citation2006), carbon fiber (Salman et al. Citation2019), graphene foil (Mink et al. Citation2014), and toray carbon paper (Abrevaya et al. Citation2010) still have insufficient biocompatibility, low conductivity and limited surface reaction sites. The presence of these factors would limit bacterial biofilm production, decreases electron transfer rate, and slow electro kinetic mechanism for electrochemical process in MFC operation (Wu et al. Citation2018).
To solve and improve such drawbacks, anode modification by surface treatment (either thermal or electrochemical), coating, and compositing from different material combinations are a very important strategy to enhance bacteria biofilm performance for good electrical contact between anode and bacterial species (Yaqoob et al. Citation2020). Currently, the low conductivity PGE anode can be addressed by modifying PGE surface with transition metal oxide nanomaterials (NMs) (Goswami et al. Citation2018) like manganese dioxide (MnO2) (Mahmudi et al. Citation2018) and conducting polymers like PAN (Singh and Shukla Citation2020) in form of composites. Therefore, MnO2-based composites, i.e. MnO2/polyaniline (PANI) is expected to improve the power and treatment efficiencies in MFC due to the bacterial adhesion ability and these criteria be able to increase electron transfer rate towards anode surface. The main objective of using conducting polymer in general and PANI in particular in anode modifications is to improve surface area and surface roughness for superior electron transfer rate. So, the chemical and mechanical instability in metal oxide is improved by better mechanical strengthening PANI by forming composites. But the inefficient conductivity of PANI in neutral aqueous solution often limits its activity in the MFC performance (Zhao et al. Citation2013). Because the optimum condition to operate MFC is a neutral or weak basic solution but PANI at this experimental condition doesn’t compete its work properly (i.e. which is unstable) (Jia et al. Citation2018).
As an advantage, the presence of positive charge on PANI and the negatively charge characteristics on bacteria could increase interactions between bacteria and PANI which helps to form an active biofilm surface (Geetanjali and Kumar Citation2019). Such criteria enhance the surface areas of the modified electrodes that enable to increase electron transfer process (Jia et al. Citation2018). To get high bioelectricity and treatment efficiency, PANI is combined with novel carbon nanotubes (Wu et al. Citation2018), carbon fibre-embedded bacterial cellulose (Trindade et al. Citation2020), and carbon felt (Rajesh et al. Citation2020). In addition to anode modification by different NMs combinations, Configuration of MFC has also an impact on its performance. Commonly, double and single-chambered MFC configurations have been operated at the laboratory scale (Heyang et al. Citation2016). Since double-chambered MFC has an advantage over single-chambered MFC configuration. For example, purging of oxygen in a single-chambered configuration might cause direct oxygen interference due to cathode insertion in a common electrolytic medium. The sluggish kinetics during oxygen reduction reactions causes slow electrocataytic activities of the catalyst, resulting in the poor performance of MFC (Huang et al. Citation2015). To solve this problem, a double-chambered MFC configuration has had preferred over it. As a result, choosing a flexible dual-chambered MFC setup has been given a broad emphasis (Wanget al. Citation2013).
Therefore, modification of MnO2 by PANI to form a hybrid composite and coated on PGE would make the best opportunity to addresses all problems which were mentioned above. The cost effectiveness, abundance, and environmental friendly nature of MnO2 (Haoran et al. Citation2016) have an advantage to modify PANI. Even though, the low-cost MnO2 lucks in electrical conductivity in protonic media (Dessie et al. Citation2020a). At these conditions, it may have a chance to change its phase and then could have the possibility to decrease its performance. The necessity, in the +4 oxidation states, an α-type chain-like tunnel structure (α-MnO2, 2 × 2 tunnel (Julien and Mauger Citation2017)) exhibits fast electro kinetics and could be considered as an excellent catalytic activity in the neutral state due to having a large surface area.
Based on those detailed justifications, we prepared the first biocompatible hybrid composite material from Vernonia amygdalina (V. amygdalina) assisted α-MnO2 NPs and PANI matrix by chemical polymerization method to increase the PGE anode catalytic activity by proposing double-chambered MFC bioreactor system. The test was done by Escherichia coli (E.coli) as a microbe and glucose as a carbon source for wastewater and bioelectricity production applications. Up-to-date, the biosynthesized α-MnO2 NPs integrated PANI composite modified PGE in glucose-based MFC is not studied elsewhere.
Materials and methods
Materials
KMnO4 (99%, Alpha Chemika, Mumbai, India), aniline (99.5%, Merck), ammonium per sulfate (APS; ((NH4)2S2O8) 98%, Sigma-Aldrich), ethanol (98%, Merck), and HCl (37%, Merck) were used as received. All chemicals, nutrients, and substrates used for MFC test were analytical grades and also used as received. Solutions for these experiments were prepared from distilled water.
Biosynthesis of MnO2 NPs
An optimized α-MnO2 NPs was synthesized based on our previous work using Vernonia amygdalina (V. amygdalina) leaf extract as a reducing agent (Dessie et al. Citation2020b). Briefly, 56.28% in volume of aqueous solution of 1.81 mM potassium permanganate (KMnO4) and 43.72% by volume of V. amygdalina leaf extract were mixed followed by constant stirring at room temperature for 103.42 min until black brown suspension was formed (Dessie et al. Citation2020b). The pH of the performed condition was proceeding at 6.02. The obtained solution was centrifuged at 4000 rpm for 15 min and the precipitate was collected and washed with both distilled water and ethanol several times to remove impurities. The formed precipitate was collected and dried overnight at 80°C. The sample was calcined in muffle furnace at 450°C for 3 h.
Synthesis of PANI
Synthesis of PANI was based on mixing aqueous solution of aniline hydrochloride and APS at room temperature, followed by the separation of PANI hydrochloride precipitate by filtration and drying adopted from the literature (Mohammad Shafiee et al. Citation2019). Briefly, 0.5 mL aniline monomer was dissolved in 1 M (100 mL) HCl aqueous solution in a round-bottom flask and stirred for 30 min. Next, 5.71 g of APS was dissolved in 50 mL of distilled water. Both solutions were kept each separately for 1 h at room temperature. Then, the two solutions were mixed in a beaker and stirred with a magnetic stirring bar until the color change from colorless to dark green, which was indicated PANI formation, and waited for 4 h to polymerize. The formed PANI precipitate was collected by filtration and washed with 0.2 M HCl solution until the filtrate becomes clear, then with ethanol several times to remove monomer, oligomer as well as with distilled water several times to remove the acid. Finally, PANI powder was dried in an oven at 60°C for 24 h.
Synthesis of α-MnO2/PANI nanocomposite
A typical in situ oxidative polymerization method was used to synthesis α-MnO2-based PANI nanocomposites by following previously reported methods with little modification (Inamdar et al. Citation2016). Firstly (protonation step), 0.5 mL aniline (0.1 M) monomer was dissolved in 1 M HCl (100 mL) aqueous solution in a round-bottom flask and stirred for 30 min to form aniline hydrochloride. Secondly (homogenization of oxidant), dissolving 0.5 g of green synthesized α-MnO2 NPs in 25 mL distilled water using ultrasonication for 5 min in order to keep the α-MnO2 homogeneously suspended in the solution. Finally, a homogeneously suspended α-MnO2 NPs was added drop wise to doped aniline hydrochloride solution with 2.86 g APS (co-dopant) at room temperature, and the mixture was stirred continuously at room temperature for 4 h to complete the polymerization process. The reaction mixture was turned into dark green precipitate, the obtained materials were then collected by filtration and washed with 0.2 M HCl solution until the filtrate become clear, then with ethanol several times to remove monomer, oligomer as well as with distilled water several times to remove the acid. Finally, the product was dried in the oven at 60°C for 24 h to give α-MnO2/PANI nanocomposite (Scheme 1). The composition of α-MnO2-based composite is given in Table .
Scheme 1. Synthesis protocol for α-MnO2/PANI nanocomposite preparation.
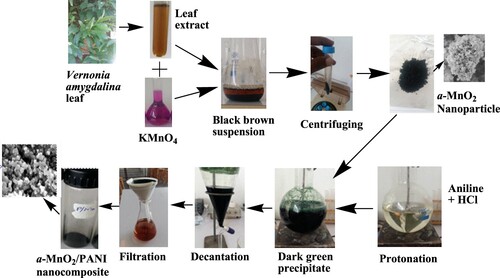
Table 1. Composition of α-MnO2 composite.
Anode catalyst fabrication
Nanocatalyst coatings were modified on PGE with HB pencil grade (Camlin, India). Before coating four equal HB PGE were handmade with pencil lead having a diameter of 0.2 cm with 1 cm in length. The lead was soaked in distilled water for 24 h and rinsed with 0.2 M phosphate buffer solution (PBS) at the time of setting up the fuel cell (Patade et al. Citation2016). Afterwards, synthesized α-MnO2, PANI, and α-MnO2/PANI nanocatalysts and polyvinyl alcohol (PVOH, M.W. = 44.05 g mol−1) polymer binder solution were prepared by drop-cast coating method. The purpose of the binder is to increase the bonding force between the prepared catalyst and bare PGE. A required amount of NPs was taken in the beaker and deionized water was added; then it was kept in an ultrasonic water bath for 15 min under ambient condition to form a uniform sol since the binder step was adopted from the literature (Harshiny et al. Citation2017). The PVOH was added in the ratio of 1:5 (PVOH to NPs wt/wt %) and dissolved in 10 mL deionized water, followed by mixing for 1 h by magnetic stirring at 70°C. Before coating on PGE surface, the mixture was kept for sonication to make uniform distribution of nanocatalyst throughout the solution. Then, a 100 µL of uniformly distributed nanocatalyst-based PVOH solution (suspension) was coated on PGE surface by drop-cast method with the help of microsyringe (Madhusudhana et al. Citation2020), and finally it was dried for 12 h at 60°C using oven drying to improve its interface stability and bonding forces of the modified layer.
Characterization of nanocatalysts
Formation of nanocatalysts was analyzed by double beam UV-Vis spectroscopy (Azzota SM-1600 SPECTROPHOTOMETER, USA) to elucidate and measure the optical properties in the range of 200–800 nm. Thermogravimetric-differential thermal analyses (TGA-DTA) were carried out on a DTG-60H detector (Shimadzu, Japan), with the sample flow rate at 50 mL min−1 under nitrogen (N2) atmosphere. Differential scanning calorimeter (PerkinElmer, DSC 4000, USA) was carried out under N2 atmosphere at a flow and heating rates of 20 mL min−1 and 10°C min−1, respectively. The crystalline structure of α-MnO2, PANI, and α-MnO2/PANI nanocatalysts were performed using Shimadzu diffractometer (XRD-7000, Tokyo, Japan) with a voltage of 40 kV and a current of 30 mA using at (Cu Kα = 1.5406 Å) radiation as an X-ray source in the 2θ range from 10° to 80°. Fourier transforms infrared (FTIR) spectra of all samples were recorded with a Perkin Elmer FT-IR BX spectrophotometer in the range 4000–400 cm−1 with samples prepared using KBr pellets. Scanning electron microscopy (SEM) was performed using a JEOL Ltd. instrument with a model of JCM-6000Plus. The surface roughness, pore structure, and pore size distributions of α-MnO2, PANI, and α-MnO2/PANI surfaces were studied by Gwyddion software (http://gwyddion.net).
Electrochemical measurements were performed in a one compartment three electrode system connected to an electrochemical workstation (Biologic SP-300, Canada) using EC-Lab for windows v10.36 (software), consisting of bare/modified PGE, Ag/AgCl and Pt wire as a working, reference, and counter electrodes, respectively. Cyclic voltammetry (CV) measurements were performed in the potential window between −0.8 and +0.8 V at a scan rate of 50 mV/s in 100 mM PBS (pH = 7.4) as the supporting electrolyte. Electrochemical impedance spectroscopy (EIS) measurements were recorded over the frequency range 200 kHz to 10 mHz with amplitude of 10 mV superimposed on working potential (Ewe = +0.252 V vs. Ag/AgCl electrode).
The Nyquist diagrams in EIS were employed to estimate quantities of important elements, such as solution resistance/or ohmic loss (Rs), charge transfer resistance/or polarization loss (Rct), double-layer capacitance (Cdl), and Warburg impedance/activation or concentration loss (W) of the equivalent circuit by using EC-Lab V10.40 Zsim demonstration software. For this study, a representation of Randles type circuit model shown in the Nyquist plots was fitted for all EIS experimental data. The model defined that semicircle region found at the high frequencies in the diagram provides information about electron transfer limited process while the linear region at the low frequencies region associated with Warburg diffusion process (Tahtaisleyen et al. Citation2020). The length of the diameter from the semicircle showed surface/or interface charge transfer resistance that defines the dielectric and insulating properties of the electrode/electrolyte solution interface (Çakir et al. Citation2015).
Microorganism and inoculum preparation
Effluents of wastewater sample were collected from Adama Science and Technology University wastewater treatment plant, Adama, Ethiopia (latitude 8°33′43.56″ North and longitude 39°17′23.28″ East), using sterile glass bottle tied up with light weight steel round stick. The sample was immediately transferred to the biology laboratory room and was kept overnight in a refrigerator at 4°C. Areas which was used for E.coli culturing were cleaned with 95% ethanol during sample container opening. Before culturing, all the necessary facilities were also sterilized in an autoclave at 120°C for 30 min. After room temperature was kept, 3 mL of settled waste sewage effluent sample was cultured in 400 mL autoclaved conical flask using Lactose broth as a culture media. After 15 min, 1 mL supernatant was taken from the conical flask with the help of a micropipette and added the supernatant into another sterile test tube in order to make dilution. The cultured sample was anaerobically incubated at 37°C for 24 h. After 24 h, the morpho-biochemical characterizations of the grown microbial colonies after isolation were done (Figure S1).
MFC setup and operation
Dual-chambered MFC was designed (Figure S2). Pencil graphite (1 cm length, 0.2 cm diameter) was used as both anode and cathode electrode. The artificial wastewater as the anolyte was prepared in the anode reactor contained: 5840 mg L−1 of NaCl, 100 mg L−1 of KCl, 250 mg L−1 of NH4Cl, 12000 mg L−1 of Na2HPO4·12H2O, 2570 mg L−1 of NaH2PO4·2H2O, 840 mg L−1 of MgCl2.6H2O, 500 mg L−1 of FeCl3, 2 mg L−1 of MnSO4.H2O, 5 mg L−1 of CaCl2, and 340 mg L−1 of yeast extract to fulfill the micronutrient deficiency (Danish Khan et al. Citation2015). The anolyte with pH 7.40 could act as the microbial growth medium. The anode chamber was kept airtight and filled completely with 166 mg L−1 glucose substrate as a carbon source with the inoculum added to achieve anaerobic experimental conditions (Pandit et al. Citation2014). The cathode chamber was filled with 50 mM KMnO4 which was dissolved in a neutral medium (100 mM, pH 7.40) PBS. The volumes of both chambers were contained from 250 mL. The salt bridge was prepared from 3 g of agar and 12 g of KCl (see supplementary materials). Finally, the MFC operation was operated at room temperature (28 ± 2°C) for four days.
Electrochemical calculation
Open circuit voltage (OCV) was recorded by using digital multimeter (DT830D, Haoyue, China) for 3 h/day after 5 min stabilization for every 5 min continuous interval. The accuracy of the multimeter for voltage measurement was ±1.2% of indicated values ±5 least-significant digits. Then it was directly connected between an anode and a cathode of MFC to measure the generated voltage. The polarization curves were measured from closed circuit voltage (CCV) against external resistors for 15-min interval using Decade Resistance Box (ANSHUMAN, Model: DRB-7 T) by varying resistances from 100 kΩ to 100 Ω.
The flow of current (I) across each resistor was calculated via Ohm’s law: I = V/R, V as a cell voltage and R as the external resistance (Rext). Similarly, power (P) is the multiplication of voltage (V) and I. Current (j) and power densities (p) were calculated from the ratio of current and power to surface area of anode (PGE, area = 0.6914 cm2). The area of PGE is determined based on the right circular cylinder calculation formula (Figure S3).
For electrode biofilm topography observation using SEM (performed using a JEOL Ltd. instrument with a model of JCM-6000Plus to observe the structural morphology of the formed biofilm), four anodic samples including control were fixed in 2.5% glutaraldehyde for 2 h which is used as a disinfectant, rinsed three times using PBS (pH of 7.4, 100 mM), dehydrated by different alcoholic series (60%, 70%, 80%, 90%, 95% and 100%) and then air dried. Finally, samples were subjected to SEM observations.
COD and CE measurements
Chemical Oxygen Demand (COD) measurements were conducted using the acidic permanganate (CODMn) method under the protocol of Standard Methods (Goh and Lim Citation2008). Briefly, 10 mL of aqueous sample solution was transferred into a 250 mL ground-glass neck conical flask; the sample was added with 1 mL of 9 M H2SO4 followed by 10 mL of 0.01 M KMnO4 digestion solution. The sample was heated for 30 min in a water bath at 96°C–98°C. After digestion, the sample was cooled immediately in an icebox to quench the reaction. The remaining KMnO4 in the sample solution was determined by spectrophotometer in the range of 200–800 nm. A spectrophotometer is needed to make a standard calibration curve (Figure S4 and S5) by measuring concentration of the remaining permanganate and their absorbance which was adopted from dichromate method (Beer et al. Citation2017). If the sample's actual COD was higher than the range, the sample was diluted but the real results were multiplied by dilution multiple (Oljira et al. Citation2018). The degradation efficiency was evaluated by calculating the COD removal with the following formula:
(1)
(1) where CODin (mg L−1) is the influent COD and CODout (mg L−1) is the effluent COD.
The columbic efficiency (CE) was measured as the ratio between the electrons transferred to the anode from the microorganism to the theoretical one that can be achieved if all organic substrates were digested by the microorganisms to generate electrons. Therefore, the CE can be calculated for batch reactor conditions as follows:
(2)
(2) where M is the oxygen molecular weight (32), I is the current and t is the time at maximum power density. F is Faraday’s constant, b = 4 indicates the number of electrons exchanged per mole of oxygen, Van is the anodic solution volume, and ΔCOD is the chemical oxygen demand change over time.
Results and discussion
UV-Visible analysis
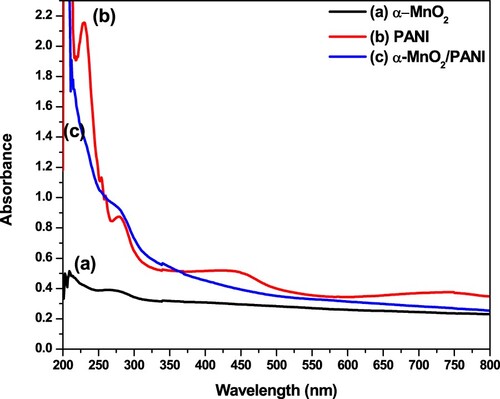
The incorporation through the insertion of α-MnO2 in PANI matrix to form α-MnO2/PANI composite were evidenced from UV-Visible absorptionspectroscopy and their spectra are given in Figure . The synthesized and optimized α-MnO2 exhibited an absorption band at about 285 nm due to electronic transitions from triply degenerate, t2g to doubly degenerate, eg in the d-orbital due to having the tetrahedral shape of α-MnO2 (Figure (a)) (Dessie et al. Citation2020b). The absorption spectrum of polymerized PANI is shown in Figure (b) indicated a change in position and intensity at about 225 nm (PANI doped with APS). Band at 267 nm indicating π → π* transition of C = C in the benzenoid (–(C6H4)–) rings while band near 405 nm formed in the range of 400–450 nm corresponds to the transition of π → polaron (Mohammad Shafiee et al. Citation2019). The electrical conductivity of PANI is improved due to the faster delocalization of charges by forming a radical cation (polaron) or dication (bipolaron) (Rajesh et al. Citation2020). So, it is evidenced that from the formed polaron, synthesized PANI is an emaraldine form (Mathew and Thomas Citation2020). Earlier studies also evidenced that an absorption band shifted from a higher wavelength to the lowest excitation peak closest to 227 nm might indicate the high oxidation state PANI existence with different degree of protonation of the imine nitrogen atoms in the polymer chain (Tanwar and Ho Citation2015). The absence of an absorption band in the range of 400–430 nm and blue shifted in the UV region with intense and broad peak than α-MnO2 and PANI shown in Figure (c), indicated the clear incorporation of α-MnO2 inPANI conducting matrix to form α-MnO2/PANI hybrid composite.
Figure 1. UV-Vis absorption spectra of α-MnO2 (a, black curve); PANI (b, red curve); and α-MnO2/PANI (c, blue curve).
XRD analysis
The crystalline structure of pure α-MnO2, PANI, and α-MnO2/PANI hybrid composite was performed by X-ray diffraction (XRD) test as shown in Figure . The XRD pattern of pure α-MnO2, which was indexed with standard Crystallography Open Database (COD, Entry # 96-151-4117) (Dessie et al. Citation2020b), showed three intense peaks found at 2θ of 12.479°, 25.228°, and 37.218° with lattice plane of (110), (220), and (211), respectively (Figure (a)). The XRD pattern of PANI exhibits two main broad peaks with 2θ of 20.494° and 25.413°, which are indexed to a diffraction planes at (100) and (110), respectively, due to the characteristic chain of PANI (Figure (b)) (Zhou et al. Citation2018). For the α-MnO2/PANI hybrid composite, its diffraction peaks are almost similar with pure PANI in all planes except diffraction angle at 21.151° (Figure (c)), this change in peak symmetry on α-MnO2/PANI than PANI alone showed that a distortion in crystal structure of α-MnO2 has occurred during the polymerization reaction, which shows the transformation of the crystalline α-MnO2 into the amorphous phase of PANI. This confirms a successful integration of α-MnO2 could form in PANI matrix. A similar literature work has been studied from β-MnO2/PANI hybrid composite (Zhou et al. Citation2018). Generally, PANI incorporated α-MnO2 showed broad peaks and this suggested that the particle size is so fine (Table ). The interplanar spacing in the lattice and their crystallite size of the prepared particles formed by each of the NMs sample is presented in Table .
Figure 2. XRD patterns of (a) α-MnO2 nanosphere flower, (b) PANI powders, and (c) α-MnO2/PANI/ nanocomposite.
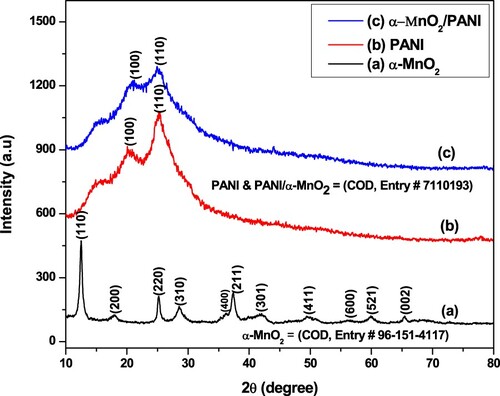
Table 2. XRD data used for calculation interlayer spacing, crystalline size of different sample.
The interlayer spacing (d) and crystallite size (D) were determined using Braggs law and Debye Scherer formula, respectively, from Equations (3) and (Equation4(4)
(4) ) given below (Ajeel and Kareem Citation2019):
(3)
(3) where n is an integer, λ is the XRD wavelength (0.15406 nm) and θ is the angle between the incident ray and the scattering planes.
(4)
(4) where D is the crystallite size (nm), k is shape factor for an average crystallite (0.89) depending on the miller index of the reflecting plane and the shape of the crystal, λ is the XRD wavelength (nm), β is the full width at half maximum (FWHM) of crystallite peak (measured in radians) and θ is Bragg’s angle (°) of the XRD peak.
FTIR analysis
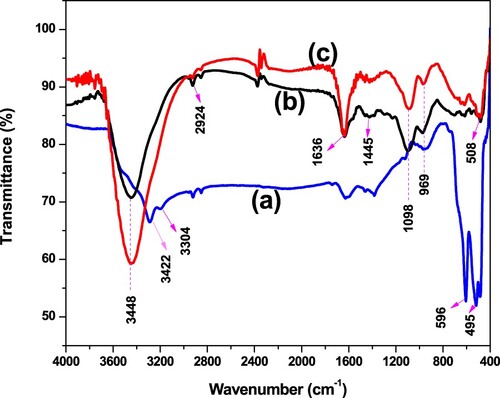
The characteristic peak observed at a wavenumber of 3422 and 3304 cm−1 might be assigned as –OH stretching and H–O–H bending vibrations of surface adsorbed water found on pure α-MnO2 NPs (Figure (a)). The peak observed in the band between 600 and 475 cm−1 at about 596 and 495 cm−1 corresponding to the stretching collision of O–Mn–O and Mn–O bond stretching vibration which justifies the formation of α-MnO2 NPs (Dessie et al. Citation2020b). In Figure (b), the typical FTIR spectra of pure PANI, the characteristic band at 3448 and 2924 cm−1 corresponding to N–H stretching and aromatic C–H stretching, respectively, which can also observed in α-MnO2/PANI composite (Figure (c)). The characteristic peak found at 1636 and 1445 cm−1 related to the stretching vibration of quinoid (–N = (C6H4) = N–) ring and benzenoid rings, respectively (Mahajan et al. Citation2015), while the peak appearing at 1098 and 969 cm−1 corresponding to the stretching of C–H in plane and C–H out of plane bending (Shah et al. Citation2018). The weaker band found in the finger print region shown in Figure (c), suggests that the doping degree of PANI is changed by α-MnO2 NPs. So, the characteristic peak appearing at about 508 cm−1 with better intense peak than pure PANI indicated the incorporation of α-MnO2 on PANI conducting matrix.
Figure 3. FTIR spectra of (a) α-MnO2 (blue line), (b) PANI (black line), and (c) α-MnO2/PANI (red line) in the range from 4000 to 400 cm−1 with KBr pellet sampling.
Thermal analysis
TGA-DTA
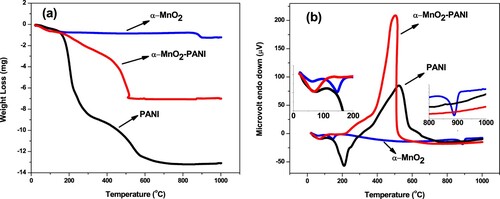
The thermal stability of α-MnO2, PANI, andα-MnO2/PANI composite were investigated by TGA (Figure (a)) and DTA (Figure (b)). As shown in Figure (a), the α-MnO2 has a weight loss of −0.660 mg (−5.024%) due to existing water removal from the surface and lattice of the nanostructure before 250°C at about 146.13°C. The weight loss of −1.101 mg (−8.381%) at 888.16°C is due to the transformation of α-MnO2 to Mn2O3 (Hu et al. Citation2015). The four major stages of weight loss have been observed on PANI thermal behavior. The first loss observed at about 37.67°C is due to the loss of volatile impurities while the second loss obtained at about 205.62°C was attributed to the loss of the dopant, the surfactant and deprotonation of the PANI backbone. At 319.78°C temperature was due to exothermic decomposition of PANI whereas the residual product weight formed after 600°C at about 692.81°C may different oxidation products after decomposition (Ansari et al. Citation2016). In contrast, the α-MnO2/PANI hybrid composite showed a better smoother curve with four minimum weight loss levels, it shows its better stability. The high residual weight loss of α-MnO2/PANI obtained after 509.59°C was −6.917 mg (−82.502%) which suggests that PANI and α-MnO2 do not undergo complete oxidation and their composite is highly stable. Figure (b) attributed that the DTA curve for α-MnO2 shows two endothermic curves at about 146.13 and 888.16°C might be the loss of physically adsorbed water molecules and phase change from α-MnO2 to Mn2O3 NPs, respectively. The DTA curve for PANI at 210.46°C endothermic peak may either dehydration or dopant loss of PANI and exothermic peak at about 524.31°C is due to and PANI chain decomposition followed by heat loss (Bhanvase et al. Citation2015). The domination of exothermic peak at about 503.44°C, is due to the high cooling rate capacity of the α-MnO2/PANI composite with smooth weight loss after 600°C. The decreasing of endothermic peak on the composite than PANI and absence of any other band above 600°C indicated that hybrid composite is more stable. As a support, a similar fashion has been done between PANI and Mesoporous MnO2 by using H2SO4 as a dopant (Hu et al. Citation2015). Finally, the whole summaries of weight loss from TGA and their peak analysis from DTA are given in Tables S1 and S2.
Figure 4. Thermogravimetric analysis (TGA, curve (a)) and differential thermal analysis (DTA, curve (b)) of α-MnO2 (blue line), PANI (black line), and α-MnO2/PANI (red line) NMs with flow rate 50 mL min−1 under N2 atmosphere.
DSC analysis
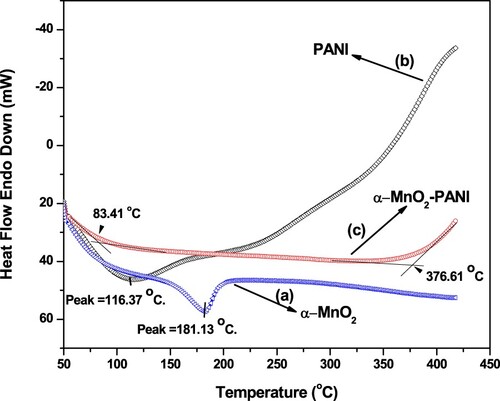
The thermal effect on phase behavior was done by DSC analysis shown in Figure . Occurrence of endothermic peak at a temperature of 181.13°C indicated the glass transition (Tg) temperature and its phase change in to Mn2O3 under N2 atmosphere (Figure (a)) (Dessie et al. Citation2020b). The thermographs of PANI show a broad endothermic peak at 116.37°C, which attributed to the Tg (Figure (b)). It is reported that, depending up on the terms of synthesis conditions PANI might be extended and occurred near 100°C (Tikish et al. Citation2018). The falling of broad endothermic peaks on each pure component composed from α-MnO2 and PANI showed the clear integration of α-MnO2 in PANI matrix to form a new and stable nanocomposite formation with loss of surface absorbed water occurrence at about 83.41°C while an exothermic temperature after 376.61°C shows the beginning of decomposition of PANI Chain degradation (Figure (c)).
Figure 5. DSC thermogram of α-MnO2 (a), PANI (b), and α-MnO2/PANI (c) in N2 atmosphere (heating rate: 10°C min−1, flow rate: 20 mL min−1).
Morphology analysis
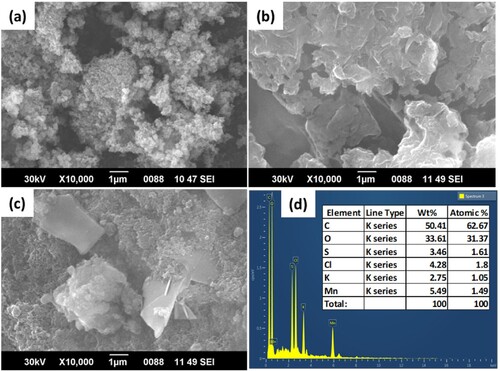
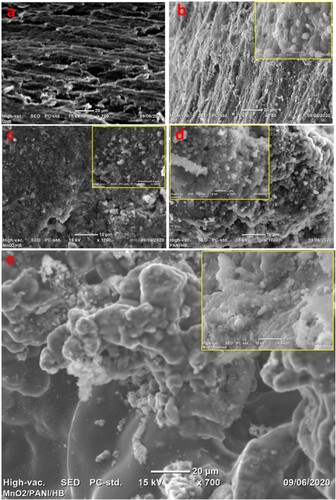
The surface topography of α-MnO2/PANI composite as well as synthesized PANI and optimized α-MnO2 NPs were examined by SEM analysis. Figure (a) shows the SEM micrograph of low aggregated with ball-shaped flower-like architecture for biosynthesized α-MnO2 NPs using V. amygdalina leaf extract (Dessie et al. Citation2020b). Figure (b) illustrates agglomerated, non-uniform, rough, and closely packed micrographs for pure PANI with an average crystallite particle size of 2.18 nm. Careful examination attributed that the type and shape of PANI SEM micrograph highly depends on oxidant type and aniline monomer concentration. So, when PANI is synthesized using strong oxidant and high aniline concentrations under strongly acidic conditions (pH < 2.5), globular (granular) type of PANI morphology is synthesized (Mazzeu et al. Citation2017). The clear distribution of α-MnO2 NPs over PANI granular is shown in Figure (c). This surface modification and binary composite formations (α-MnO2/PANI) is proved from the elemental compositions shown in Figure (d) and confirms the presence of main elements, 89.51% (Mn, C, O); dopant elements, 7.74% (S and Cl); and trace, 2.75% (K). Such composites modified with PANI due to its electronic (100–101 S cm−1) and proton conductivities (10−9–101 S cm−1) nature (Sapurina and Stejskal Citation2009), and uniformly distribution of α-MnO2 in PANI matrix can be considered as a best electrode material in fuelcells.
Figure 6. SEM images of (a) α-MnO2 NPs, (b) PANI, (c) α-MnO2/PANI composite, and (d) EDX spectrum of α-MnO2/PANI composite.
Surface roughness analysis
The surface topographic properties of MnO2, PANI and their nanocomposite were analyzed using Gwyddion software from SEM input image shown in Figure . The height of all catalyst surfaces was represented using 2-D map found in Figure (a1–c1) while the 3-D map visualize the degree of porous and pore occurrences that might show the highest vertical compact surface height followed by visualizing the active surface sites for each catalyst (Figure (a2–c2)) (Sun et al. Citation2013). The degree of porosity and pore occurrence from 2-D and 3D maps directly showed the degree of surface roughness information. These roughness quantifications were explained in terms of mean roughness (Ra), mean square roughness (Rq), surface skewness (Rsk), and kurtosis coefficient (Rku) (Zhao et al. Citation2019).
Figure 7. 2-D and 3-D SEM images of (a1) and (a2) from catalyst α-MnO2; (b1) and (b2) from catalyst PANI; (c1) and (c2) from catalyst α-MnO2/PANI.
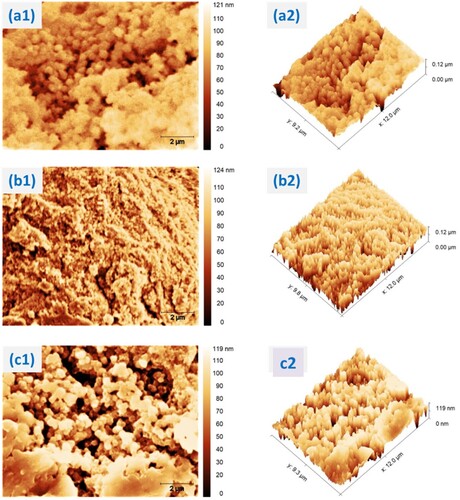
The quantitative roughness parameters were determined using row statistical quantity analysis approach and given in Table . The Ra value of α-MnO2/PANI catalyst was 22.92 ± 3.648 nm. It has a higher value than α-MnO2 and PANI, showing that the surfaces of α-MnO2/PANI hybrid composite being rougher than other catalysts. Rq values of α-MnO2/PANI hybrid composite was 28.15 ± 3.645 nm, its value was higher than values determined for α-MnO2 and PANI, indicating that the degree of surface roughness variation in the hybrid composite are higher. The Rsk values of α-MnO2/PANI shows more positive value than α-MnO2, meaning that composite has more regions of positive curvature than peaks in the surface but lower in positive value than PANI, while values of α-MnO2 catalyst has less positive (more negative curvature), indicating that there are fewer troughs as shown in Table . Finally, The Rku values of α-MnO2/PANI catalyst was −0.2429 ± 0.709 and the Rku values of PANI was −0.5079 ± 0.342. The results show that the shape of pore size distribution of MnO2/PANI nanocomposite is scattered while the pore size distribution of α-MnO2 catalyst is more concentrated with a value of 0.9627 ± 1.798. So, Rku values supports that the pore size distribution and surface area to volume ratio of PANI surface resulted from Watershed pore statistics analysis method is intermediated between MnO2 and MnO2/PANI as shown in Figure and (Table S3).
Figure 8. Dependence of mean pore size and surface area to volume ratio vs. number of pores for α-MnO2, PANI, and α-MnO2/PANI catalysts by the Watershed method.
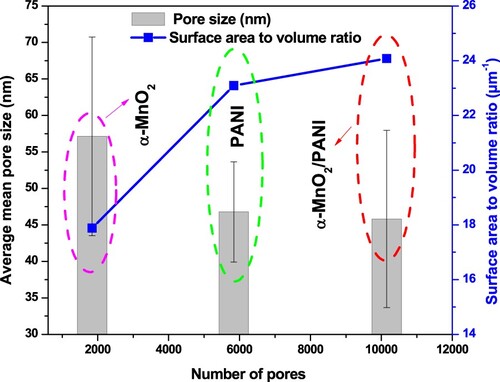
Table 3. Surface roughness statistical quantity results for different samples acquired from SEM entire image analysis.
Pore structure and size distribution analysis
Watershed method is more realistic techniques for pore and their distribution determination in the range between 1 and 200 nm while the rest method has a large range of size with more complicated structural determination including pore with bigger in size (Zhao et al. Citation2019). So that is based on the principle of water flows to a region with a local minimum which represents a plane pore. The method has two specific processes, such as water drops to each point on the surface of the catalyst and water flows to the region of the local minimum. Then the pores are identified with the pore size, pore surface area, and pore volumes were determined by the volume of water converging to the local minimum region. Based on these prospective, all pores associated with all catalysts are marked in blue color (Figure S6(a1–c1)) and their detailed pore parameters are shown in Table S3. The distributions of pore structure and pore numbers as a function of pore sizes are shown in Figure S6(a2–c2). The maximum numbers of pores are formed in α-MnO2/PANI nanocomposite with average maximum pore size of 104.3 ± 6.548 nm while lowest average maximum pore size of 91.19 ± 8.996 nm was for α-MnO2 nanocatalyst. By comparison, MnO2/PANI nanocomposite catalyst has more surface area to volume ratio than MnO2 and PANI catalysts with a value of 24.08, 23.09, and 17.88 µm−1, respectively. Summarizing of pore size distribution with other literature work is given in Table .
Table 4. Pore size distribution comparison between this work and other literature.
Electrochemical characterization
Cyclic voltammetry (CV)
The electrocatalytic activities of the prepared materials were evaluated using CV under phosphate buffer electrolyte solution are given in Figure (a). The peak current observed using bare PGE was lower than the other electrodes, due to its limited electrical conductivity. The lower conductivity found on bare PGE stores lower charge capacity (Figure (b)). This electrode was improved by α-MnO2, PANI, and α-MnO2/PANI; their peak currents were increased shown in Figure (a). Pair of redox peak current for PANI/PGE and α-MnO2/PANI/PGE was increased due to the better electrocatalytic activity of PANI. This activity increases the total charge storing performance of α-MnO2/PANI/PGE shown in Figure (b). Therefore, among the electrodes, α-MnO2/PANI/PGE exhibited maximum peak currents and this improves its electrical conductivity and conduction channels. The peak to peak potential separation (ΔEp) of α-MnO2/PANI/PGE has a minimum value (0.224 V) when compared with other electrodes, this directly indicated the best in electron transfer rate. For more understanding regarding peak current, peak potential, and charge comparison see (Table S4). Hence, α-MnO2/PANI composite modified PGE promotes fast electron transfer movement between electroactive species and exposed surface area of electrode interfaces. This statement was supported by surface roughness and pore structure analysis. Besides, the shift in anodic peaks potential towards more negative scan showed that oxidation activity of analyte on α-MnO2/PANI surface takes place at a faster rate than bare PGE. So, the degree of oxidizing ability increases from bare PGE to α-MnO2/PANI (Table S4). Finally, the possible oxidation responses (oxidation reaction) at −0.570 V vs. Ag/AgCl and its reversible reduction responses at −0.794 V vs. Ag/AgCl might be given from the following Equations. This reaction was adopted from other literature under PBS as an electrolyte (He et al. Citation2017):
(5)
(5)
(6)
(6)
(7)
(7)
Figure 9. Cyclic voltammogram (a) and the total charge exchanged from the beginning of the experiment, Q–Qo (b) of different catalyst modified electrodes. (i) bare PGE; (ii) α-MnO2/PGE; (iii) PANI/PGE; (iv) α-MnO2/PANI/PGE in 100 mM PBS (pH = 7.4) at a scan rate of50 mV s−1.
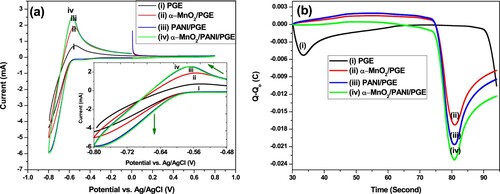
Where M stands for catalysts such as PGE, α-MnO2, PANI, and α-MnO2/PANI and the CV techniques was conducted in dissolved oxygen conditions.
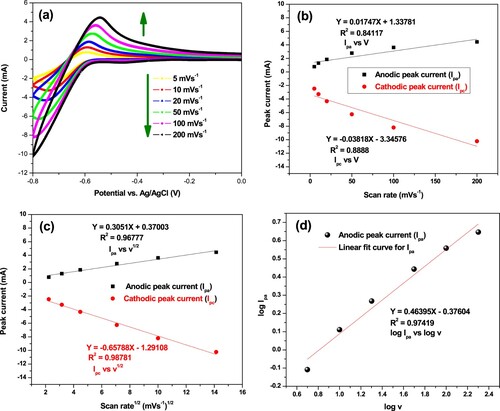
The effect of scan rate on the produced peak current by α-MnO2/PANI hybrid composite modified PGE was studied using CV in 100 mM PBS (Figure (a)). It was performed at scan rates of 5, 10, 20, 50, 100, and 200 mV s−1. The obtained voltammograms show that the produced peak current was enhanced with increasing scan rate. The dependence of plot of anodic and cathodic peak currents over the scan rates (Figure (b)), provides a nonlinear relationship with R2 equal to 0.84117. This result shows that both oxidation and reduction reactions on α-MnO2/PANI/PGE surface are not under surface adsorption controlled process (Dessie and Admassie Citation2013). On the other hand, the plots of the anodic and cathodic peak currents were linearly dependent on the square root of the scan rate (Figure (c)). This indicates that the redox process occurring on the electrode surface is nearly reversible (Mishra and Jain Citation2016) and clearly diffusion controlled (Tahtaisleyen et al. Citation2020). The result demonstrated that a linear relationship with the oxidation of buffer solutions by producing H+ ion to the solution on MnO2/PANI/PGE has controlled by the diffusion process (Tahtaisleyen et al. Citation2020). It is concluded that, if the redox reaction is diffusion controlled, the peak current should be linearly proportional to square root of scan rate (Ates et al. Citation2009), and negative intercept = −0.37604 with R2 = 0.97419 from logarithm of the scan rates vs. logarithms of anodic peak current are shown in Figure (d) which suggests there might be some adsorption intermediate in the process (Mphuthi et al. Citation2017).
Figure 10. Cyclic voltammograms of α-MnO2/PANI/PGE electrode recorded at scan rates of 5–200 mVs−1 (inner to outer) (a), plot of peak currents vs. scan rates (b), variation of peak currents vs. square root of scan rate (c), and variation of log v vs. log Ipa (d) in 100 mM PBS (pH = 7.4).
Impedance spectroscopy
The obtained parameters from EIS experiment results were presented in Table . The Nyquist plots of bare PGE, α-MnO2/PGE, PANI/PGE, and α-MnO2/PANI/PGE electrodes are shown in Figure (a). The simulation equivalent circuit analysis of R2 or Rct values for PGE, α-MnO2/PGE, PANI/PGE, and α-MnO2/PANI/PGE were found to be 1519, 1119, 1071, 958 Ω, respectively (Table ). The decrease in charge transfer resistance is due to the effective modification of bare PGE evidenced from a successful integration between α-MnO2 and PANI, and played a fast ET rate. Thus, the low Rct value of α-MnO2/PANI composites demonstrates a high reaction rate due to having high reactive surface site. The electrolytic ohmic resistance (Rs) obtained by α-MnO2/PANI/PGE has a lower values (8.86 Ω) than other electrodes due to its effective surface roughness modification results for lower intrinsic resistance between composites and bare PGE interfaces. This provides a fast diffusion of the electrolyte from its bulk region to the surfaces of electroactive materials that leads Rs become small. The statement is clearly supported from Warburg impedance (ZW) results as shown in Table . The highest double-layer capacitance obtained by hybrid composite modified PGE increases due to the faster electron transfer rate properties resulting from having lower polarization and ohmic resistances.
Figure 11. EIS plots Nyquist (a) and the inset displayed the equivalent circuit (Randles model with R.E is reference electrode and W.E is working electrode), Bode-magnitude (b), Bode-phase (c), and Admittance (d) plots of bare PGE, α-MnO2/PGE, PANI/PGE, and α-MnO2/PANI/PGE electrodes performed in 100 mM PBS (pH = 7.4).
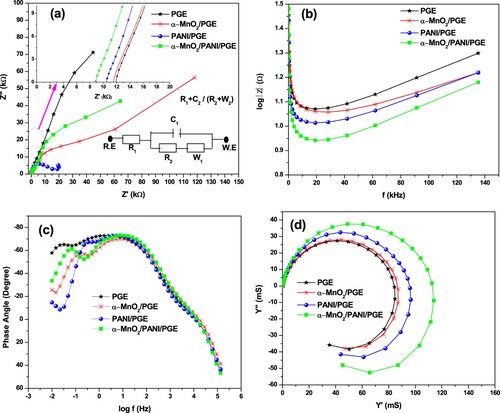
Table 5. Electrochemical parameters of the bare PGE, α-MnO2/PGE, PANI/PGE, and α-MnO2/PANI/PGE electrodes in 100 mM PBS (pH = 7.4) supporting electrolyte.
The impedance magnitude (|Z|) and phase angle (Φ) dependence on frequencies are shown in Figure (b,c). From the frequency dependence of log |Z| versus frequency, it can be seen that α-MnO2/PANI composite coated PGE exhibited with lowest log |Z| value of 0.94 Ω at 19.15 kHz, indicating that its electron transfer process is best (Table ). A typical capacitive and resistive behaviors can also obtained from Φ dependence versus frequency plot as shown in Figure (c). The capacitive behavior of the material have been found in the phase angle between 90° and 45° while the resistive behavior were governed between 45° and 0°, and finally −90° phase angle conforms the ideal supercapacitor properties of the prepared material (Sankar et al. Citation2018). All modified electrodes including bare PGE showing a capacitive behavior. Their optimum phase angles are found in the range between −45° and −90°, while the capacitive behavior of composite modified PGE exhibited with highest value of −73.182°. This result revealed that α-MnO2/PANI/PGE has a pseudo-capacitive behavior. Therefore, the hybrid composite could have a benefit for energy conversion and storage performance applications due to its pseudo-capacitive behavior contribution of α-MnO2 on PANI (Relekar et al. Citation2019).
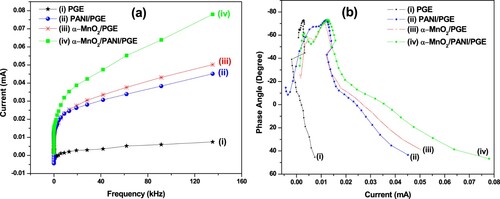
The admittance plots of bare PGE, α-MnO2/PGE, PANI/PGE, and α-MnO2/PANI/PGE nanocomposites were done to understand the conductivity of materials. The highest conductivity obtained by α-MnO2/PANI modified PGE exhibited the highest magnitude of conductance (|Y|) (126 mS) (Figure (d)). Bode-phase plots from the frequency dependence current and the current dependence of Phase angle are shown in Figure (b,a)). From these figures, the highest current generation on α-MnO2/PANI/PGE throughout the frequency is shown in Figure (b), indicating that the lower ohmic resistance, charge transfer, and diffusion resistance associated with the modified electrode surface. General performances done by impedances for all materials are comparative and consistent with results obtained by cyclic voltammetric results. So, for more data summary, impedemetric parameters are given in Table .
Figure 12. Plots of current vs. frequency (a) and Phase angle vs. current (b) for PGE (i), PANI/PGE (ii), α-MnO2/PGE (iii), and α-MnO2/PANI/PGE (iv).
MFC activity test
Electricity generation
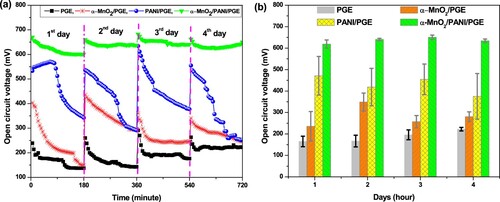
An OCV is one of the most important criteria to investigate the catalytic activity of the prepared materials for better MFC performance. The OCV responses obtained by α-MnO2, PANI, α-MnO2/PANI modified PGE and bare PGE were operated for four continuous days each with a total of 16 days (Figure (a)). On each day a continuous 3 h measurement per day was operated. Throughout the time of operations, maximum OCV of 471.17 ± 89.82 mV (day 1), 348.58 ± 42.04 mV (day 2), 650.61 ± 10.11 mV (day 3), 222.36 ± 8.16 mV (day 4) were produced by PANI/PGE, α-MnO2/PGE, α-MnO2/PANI/PGE, and PGE, respectively. The selected time is considered as the best time to operate MFC at steady state. From the investigation, higher OCV using PANI/PGE and α-MnO2/PANI/PGE anode catalyst during the first and third day operating time was due to the effective electrogenic E.coli adhesion with modified anode to form a conductive biofilm as shown in Figure (b). The maintained OCV after 3 days of operation was found to be higher with α-MnO2/PANI hybrid composite modified PGE that leads to improving fast electron transfer rate on anode surface in MFC. From Figure (b), throughout the days of operations, the hybrid composite enhances MFC performance due to an increase in active surface area formation. (Table S5) compares the OCV produced by four anodic electrodes under relatively identical conditions. The unusually high OCV may be attributed to the high charge density developed on the modified electrode forms a bioanode. Thus, the fabricated nanocomposite could be suggested as a good and effective anode material to increase performance in MFC operation system.
Figure 13. Variation of open circuit voltage (a) and variation of average open circuit voltage (b) with time.
Polarization curve and power density
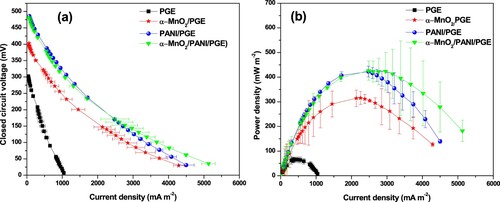
One of the most important parameter to characterize MFC performance is polarization curve which represents voltage as a function of current (Agarry Citation2017). The electrocatalytic activity of α-MnO2, PANI, and α-MnO2/PANI hybrid composite modified PGE towards MFC performances were shown in Figure (a,b)). Bare PGE exhibited the power and current densities of 65.74 ± 0.96 mW m−2 and 436.52 ± 79.83 mA m−2, respectively, which has the lowest values due to the inefficient electrical conductivity. The α-MnO2/PGE exhibited an improved MFC performance due to its ability to motivate a fast electron transfer rate between bacterial colonies and the electrode surface. The α-MnO2 NPs have a significant achievement to increase the specific capacitance and cycling stability on PGC anodic surface by forming composites under near and neutral solutions. It is very helpful to avoid the swelling and shrinkage behavior of PANI in the neutral medium of conditions. Thus, to solve these problems, α-MnO2 provided a number of active surface sites for the polymerization growth of PANI. The presence of a number of active sites which was proved by surface roughness and pore size distribution analysis would help to increase the surface areas of anode; hence integrating α-MnO2 in PANI matrix improves electrode activity by minimizing charge transfer resistance due to the effective interactions between E.coli outer membrane cell with the modified electrode. Such interactions promoted to produce a higher power output and current densities to 426.26 ± 38.89 mW m−2 and 2485.51 ± 397.31 mA m−2, respectively, using α-MnO2/PANI composite modified PGE. Since the power density formed by PANI/PGE is also much higher in magnitude than bare PGE but is closer in power density with α-MnO2/PANI/PGE composite at higher load resistance region. This is might happen when a peptide bond formation between E.coli and PGE surface which serve as a road to transfer electron rate effectively (Yaqoob et al. Citation2020). It is reported that an electrogenic bacteria can transfer electrons produced intracellularly by their central metabolism to an extracellular anode which serves as electron acceptor via either self-secreted electron mediators, direct cell membrane-anode coupling, or electrically conducting pili (Qian et al. Citation2009). Once these electrons arrive at the α-MnO2/PANI modified PGE is elevated to the higher potential cathode through an external circuit, forming a current is the general basic principle for the current generation in an MFC. So, the possible electrochemical reactions occurred at the interface between anode/anolyte and cathode/catholyte can be described by the following chemical reactions:
(8)
(8)
(9)
(9)
(10)
(10)
Figure 14. Polarization (a) and power density (b) curves.
The generated proton from the metabolism of glucose to carbon dioxide is passed through salt bridge which acts as a proton exchange membrane, to balance the produced charge in the cathode compartment.
It is clear that the transfer of electrons between π orbitals of PANI and d orbitals of Mn4+ stimulated the better electrical conductivity in the α-MnO2/PANI composite, which enable to increase glucose substrate oxidation during MFC operation. So, during glucose decomposition the produced power density was higher in α-MnO2/PANI/PGE than other catalysts including bare electrode (Figure (a)). Again, the higher electrical conductivity and presence of rich surface active site helps to reduce using higher external load shown in Figure (b). A strong bond creation between the PGE layer and PANI backbone via π-π stacking, electrostatic interactions or hydrogen bonding forms an excellent conduction channels.
Figure 15. Dependence of power density with time (a) and external resistance (b), and profile of current discharge with time at different external resistance (c).
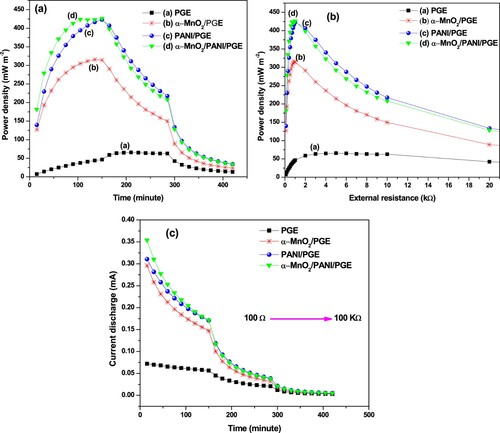
The current discharge is shown in Figure (c) represents the charge storage capacity by the modified anode during MFC operation. So, the charge storage capacity produced by α-MnO2/PANI composite modified PGE becomes higher. The free flow of charge in the MFC is always hindered as a result of the presence of a different kind of anodic resistance (Mahadevan et al. Citation2014). Increasing the conductivity of anode materials could be able to minimize contact resistance, ohmic losses, and slow electron transfer rate. As time goes on at higher external resistance, the area under current vs. time slows down due to the charge loss from glucose concentration reduction. It is clear that the smaller α-MnO2 NPs integration in PANI conductive matrix created a good synergetic effect than pure PANI and α-MnO2 NPs results for stabilized nanocomposite catalyst formation in the MFC. Thus, the maximum current discharge observed using α-MnO2/PANI/PGE was 0.1715 mA at 1000 Ω while the current discharge observed with bare PGE (0.0301 mA) at 5000 Ω. Finally, the optimum power density, operating voltage, stabilized time, and resistances are summarized in Table . Table also summarizes the comparison of our experimental result with other previous literature work.
Table 6. Summary of optimum power density, operating voltage, stabilized time and resistance.
Table 7. Comparison of unmodified PGE, α-MnO2, PANI, and α-MnO2/PANI/PGE anode-based MFC with other literatures
Organic matter removal and coulombic efficiencies
Organic matter removal concentration and removal efficiency in terms of COD during OCV measurements were shown in Figure (a,b). After 4 days with 3 h per day measurement, an average concentration removal of 59.05 ± 1.11 mg L−1, 34.69 ± 0.60 mg L−1, 33.23 ± 0.27 mg L−1, and 12.84 ± 0.29 mg L−1 was noted using PGE, α-MnO2/PGE, PANI/PGE, and α-MnO2/PANI/PGE, respectively (Table S6). The lower concentration removal with best COD removal efficiency of 92.27% was obtained by α-MnO2/PANI/PGE was due to the better integration between α-MnO2 and PANI, results for active biofilm formation that enhances the fast anaerobic respiration for E.coli. The image obtained from the anodic surface topography clearly showed the adhesion of the E.coli microorganism on the composites is much effective than the individual catalysts. This indicated that the fast electron transfer across the composite facilitates glucose decomposition which insured its excellent removal efficiencies. Similar results from PANI modified chitosan/titanium carbide composites anode electrode were reported with COD removal efficiency of 87–93% (Karthikeyan et al. Citation2016). A slight higher in both glucose concentration and its removal efficiency under OCV and CCV obtained in α-MnO2/PANI modified PGE compared with other anode catalysts (Figure (a,b)) might be better due to the enhanced glucose decomposition caused by the enriched electroactive E.coli on its surface because of its improved electrochemical properties.
Figure 16. Concentration removal (a) and their efficiency removal (b) for different anodic electrodes under open and closed circuit conditions.
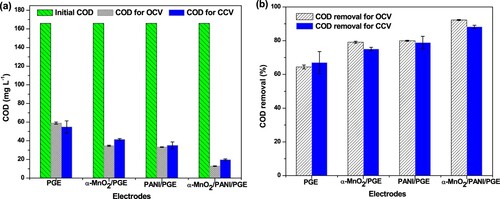
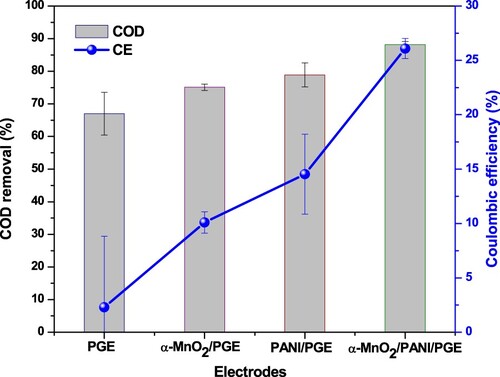
Closed circuit measurement (non-steady state conditions for 420 min measurement), an average concentration removal of 54.84 ± 6.54 mg L−1, 41.42 ± 0.98 mg L−1, 35.08 ± 3.67 mg L−1, and 19.62 ± 0.92 mg L−1 were recorded using PGE, α-MnO2/PGE, PANI/PGE, and α-MnO2/PANI/PGE, respectively (Table S7). Maximum COD and CE efficiencies of 88.19% and 26.09%, respectively, were obtained from α-MnO2/PANI modified PGE anode electrode, whereas PANI modified PGE anode delivered a CE of 14.54% (Figure ). The PGE electrode without any catalyst modification but under inoculum pretreatment noted a maximum CE of 2.29% only. The highest CE obtained in α-MnO2/PANI/PGE followed by PANI/PGE anode electrodes showed that pretreatment of PGE with E.coli in the presence of α-MnO2/PANI and PANI catalysts reduces the charge transfer resistance and enhanced the electron recovery from glucose substrate. A 14.54% increase in CE was observed in PANI modified PGE electrode compared with α-MnO2 modified PGE and bare PGE, due to enhanced biocompatibility of the PANI modification which increases the charge recovery from glucose and resulted in an improvement in CE. On the other hand, the Mn4+ in the nanocomposite may enhance the ET between the microorganisms and the anode material which facilitates electron conduction (Kalathil et al. Citation2013). To support this study, modification of carbon felt anode with PANI was effective by increasing a CE from 17% to 42.45% efficiency under dual chamber MFC Construction and operation (Rajeshet al. Citation2020).
Figure 17. COD removal and coulombic efficiency for all anodic electrodes under glucose substrate during closed circuitconditions.
Anode electrode surface property tests
After MFC operation test, a piece of α-MnO2, PANI, and α-MnO2/PANI modified PGE with E.coli attachment to verify biofilm on anode were studied using SEM imaging. The surface of bare PGE before E.coli attachment shows porous topographic view, as shown in Figure (a). After inserting in an anodic chamber containing colonies of E.coli, it is easily observed that portions of E.coli cells are adhered to PGE (Figure (b)) due to its hydrophilicity nature and better surface active area. As shown in Figure (c,d), the PANI/PGE anode exhibits a higher bacterial colony loading than α-MnO2/PGE, which can be attributed to the positively charged PANI backbone and its electrostatic interaction with the negatively charged E.coli outer cell membrane. It is interesting that after insertion and integration of α-MnO2 in PANI, it is noted that E.coli adhere effectively to the α-MnO2/PANI/PGE anode surface to form a thick biofilm (Figure (e)), it demonstrates that the E.coli loading is effectively improved and the synergistic effect between α-MnO2 and PANI are remarkably active. The magnified images shown on the inset SEM topography of composites investigated that E.coli cells attached very tightly to the anode surface to form an effective bioanode electrode. All these modifications have a positive result in the direct electron transfer improvement between microbe outer membrane c-type cytochromes of E.coli and α-MnO2/PANI/PGE anode electrode. Because the involvements of PANI in α-MnO2 possess high electron mobility, stability, biocompatibility, anticorrosion nature, excellent electrokinetics which improves the anode performance via enhanced microbial adhesion. General observations from the SEM images clearly indicate that coating of PGE with PANI integrated α-MnO2 resulted in surface area improvement of the anodes which provided more area of the biofilm growth and adhesion of the EAB than the unmodified bare anode electrode (Sonawane et al. Citation2018). So, from such architecture, the α-MnO2/PANI/PGE anode surface provide a large surface area for enhanced electron collection from the fast glucose decomposition during E.coli respiration, indicated the best anode than other three electrodes. Therefore, α-MnO2/PANI/PGE anode is a favorable electrode for biofilm growth results for improved MFC performance towards better power production and wastewater treatment efficiency.
Figure 18. SEM images of (a) bare PGE and the attachment of E. coli cells on (b) PGE, (c) α-MnO2/ PGE, (d) PANI/PGE, and (e) α-MnO2/PANI/PGE anodes.
Conclusions
Biosynthesized α-MnO2 integrated PANI composite was proposed as an alternative bioanode electrocatalyst in double-chambered MFCs. The α-MnO2 supported PANI nanocomposite was synthesized through simple in situ polymerization in which that α-MnO2 NPs act as an oxidant and its composite formation was identified from the structural characterizations. The interfacial properties proved by EIS between the composite-based electrode surface and PBS supporting electrolyte were promoted by the increased EC of α-MnO2/PANI/PGE composite. The lower charge transfer resistance, high electrical conductivity, and number of pore size which shows the catalytic active sites observed by α-MnO2/PANI/PGE composite harvest excess number of electrons that helps to validate maximum MFC performance. All the characteristics physicochemical and electrical properties were enough to perform the required test. So, using these composite, an effective power output, current generation, wastewater treatment and coulombic efficiencies were demonstrated under moderate temperature (28 ± 2°C). The PGE support α-MnO2 prevents PANI from its swelling at or near neutral aqueous solutions (PBS, pH of 7.4) that improved more than 6-fold power density efficiency than PGE alone throughout the cell operation. From the surface roughness and pore size distribution analysis, the structure of MnO2/PANI nanocomposite has a better surface roughness, surface area, and pore size distribution than other pure NMs. This improvement is attributed to the better biocompatibility (facilitate bacterial adhesion) and stronger interaction of α-MnO2/PANI nanocomposite with E.coli, improved electrochemical activity and lowered over potential than bare PGE. Therefore, in this study, we recommend that the constructed setup provides easy, efficient, and economical design for the future MFC upgrade.
Supplemental Material
Download MS Word (2.3 MB)Acknowledgements
The authors gratefully acknowledge Adama Science and Technology University for financial support to this research work. The authors also acknowledge Dr. Tadele Hunde Wondimu from Materials Science and Engineering department, Adama Science and Technology University for his valuable help during three electrode-based electrochemical measurements.
Disclosure statement
No potential conflict of interest was reported by the author(s).
Data availability statement
The data that support the findings of this study are available in https://doi.org/10.6084/m9.figshare.13295507.v1
References
- Abrevaya XC, Mauas PJD, Cortón E. 2010. Microbial fuel cells applied to the metabolically based detection of extraterrestrial life. Astrobiology. 10(10):965–971.
- Agarry SE. 2017. Bioelectricity generation and treatment of petroleum refinery effluent by Bacillus cereus and clostridium butyricum using microbial fuel cell technology. Niger J Technol. 36(2):543. https://www.ajol.info/index.php/njt/article/view/155152.
- Ajeel KI, Kareem QS. 2019. Synthesis and characteristics of polyaniline (PANI) filled by graphene (PANI/GR) nano-films. J Phys Conf Ser [Internet]. 1234(1):012020. https://iopscience.iop.org/article/10.1088/1742-6596/1234/1/012020.
- Ansari SA, Parveen N, Han TH, Ansari MO, Cho MH. 2016. Fibrous polyaniline@manganese oxide nanocomposites as supercapacitor electrode materials and cathode catalysts for improved power production in microbial fuel cells. Phys Chem Chem Phys. 18(13):9053–9060. https://doi.org/10.1039/C6CP00159A.
- Ates M, Sarac AS, Turhan CM, Ayaz NE. 2009. Polycarbazole modified carbon fiber microelectrode: surface characterization and dopamine sensor. Fibers Polym. 10(1):46–52. http://link.springer.com/10.1007/s12221-009-0046-4.
- Beer U, Violet C, Green B, Orange Y, Complementary R, Purple YY, When BGB, Asa-fe T. 2017. EXPERIMENT 11 UV / VIS spectroscopy and spectrophotometry: spectrophotometric analysis of Potassium permanganate. Int J Biol Chem Sci. 11(4):1893. https://www.ajol.info/index.php/ijbcs/article/view/164112.
- Bhanvase BA, Darda NS, Veerkar NC, Shende AS, Satpute SR, Sonawane SH. 2015. Ultrasound assisted synthesis of PANI/ZnMoO4 nanocomposite for simultaneous improvement in anticorrosion, physico-chemical properties and its application in gas sensing. Ultrason Sonochem. 24(November):87–97. https://linkinghub.elsevier.com/retrieve/pii/S1350417714003435.
- Çakir S, Biçer E, Arslan EY. 2015. A newly developed electrocatalytic oxidation and voltammetric determination of curcumin at the surface of PdNp-graphite electrode by an aqueous solution process with Al3 + . Croat Chem Acta. 88(2):105–112.
- Danish Khan M, Abdulateif H, Ismail IM, Sabir S, Zain Khan M. 2015. Bioelectricity generation and bioremediation of an azo-dye in a microbial fuel cell coupled activated sludge process. PLoS One. 10:10.
- Das S, Chakraborty I, Rajesh PP, Ghangrekar MM. 2020. Performance evaluation of microbial fuel cell operated with Pd or MnO 2 as cathode catalyst and chaetoceros pretreated anodic inoculum. J hazardous, toxic. Radioact Waste. 24(3):04020009.
- David IG, Popa DE, Buleandra M. 2017. Pencil graphite electrodes: A versatile tool in electroanalysis. J Anal Methods Chem. 2017(Cv):1–22. https://www.hindawi.com/journals/jamc/2017/1905968/.
- Dessie Y, Admassie S. 2013. Electrochemical study of conducting polymer/lignin composites. Orient J Chem. 29(4):1359–1369. http://www.orientjchem.org/vol29no4/electrochemical-study-of-conducting-polymerlignin-composites/.
- Dessie Y, Tadesse S, Eswaramoorthy R. 2020a. Review on manganese oxide based biocatalyst in microbial fuel cell: nanocomposite approach. Mater Sci Energy Technol. 3:136–149. https://doi.org/10.1016/j.mset.2019.11.001%0A https://linkinghub.elsevier.com/retrieve/pii/S2589299119301387.
- Dessie Y, Tadesse S, Eswaramoorthy R. 2020b. Physicochemical parameter influences and their optimization on the biosynthesis of MnO2 nanoparticles using Vernonia amygdalina leaf extract. Arab J Chem. 13(8):6472–6492. https://doi.org/10.1016/j.arabjc.2020.06.006.
- Dessie Y, Tadesse S, Eswaramoorthy R, Abdisa E. 2021. Bimetallic Mn–Ni oxide nanoparticles: Green synthesis, optimization and its low-cost anode modifier catalyst in microbial fuel cell. Nano-Structures & Nano-Objects. 25:100663.
- Dessie Y, Tadesse S, Eswaramoorthy R, Abebe B. 2019. Recent developments in manganese oxide based nanomaterials with oxygen reduction reaction functionalities for energy conversion and storage applications: A review. J Sci Adv Mater Devices. 4(3):353–369. https://linkinghub.elsevier.com/retrieve/pii/S2468217919302023.
- Divya Priya A, Deva S, Shalini P, Pydi Setty Y. 2020. Antimony-tin based intermetallics supported on reduced graphene oxide as anode and MnO2@rGO as cathode electrode for the study of microbial fuel cell performance. Renew Energy. 150:156–166. https://doi.org/10.1016/j.renene.2019.12.109.
- Dong X, Shen W, Gu J, Xiong L, Zhu Y, Li H, Shi J. 2006. MnO 2 -Embedded-in-Mesoporous-Carbon-Wall structure for Use as Electrochemical capacitors. J Phys Chem B. 110(12):6015–6019. https://pubs.acs.org/doi/10.1021/jp056754n.
- Elawwad A, Husein DZ, Ragab M, Hamdy A. 2020. Enhancing the performance of microbial desalination cells using δMnO2/graphene nanocomposite as a cathode catalyst. J Water Reuse Desalin. 10(3):214–226. https://iwaponline.com/jwrd/article/doi/10.2166/wrd.2020.011/75430/Enhancing-the-performance-of-microbial.
- Etana BB, Ramakrishnan S, Dhakshnamoorthy M, Saravanan S, Ramamurthy P C, Demissie TA. 2019. Functionalization of textile cotton fabric with reduced graphene oxide/MnO 2 /polyaniline based electrode for supercapacitor. Mater Res Express. 6(12):125708. https://iopscience.iop.org/article/10.1088/2053-1591/ab669d.
- Evelyn SE, Amri A, Marshall A, Gostomski P. 2019. Reaction kinetics for microbial-reduced mediator in an ethanol-fed microbial fuel cell. In: Olivia M, Marto A, Yamamoto K, Wishart D, Saputra E., Ketut Sudarsana ID, Agus Ariawan IM, Infantri Yekti M, Ridwan R, Wibisono G, editors. MATEC Web Conf [Internet]. 276. p. 06010; https://www.matec-conferences.org/10.1051/matecconf/201927606010.
- Geetanjali RR, Kumar S. 2019. High-capacity polyaniline-coated molybdenum oxide composite as an effective catalyst for enhancing the electrochemical performance of the microbial fuel cell. Int J Hydrogen Energy. 44(31):16933–16943. https://doi.org/10.1016/j.ijhydene.2019.04.201.
- Gnana kumar G, Awan Z, Suk Nahm K, Stanley Xavier J. 2014. Nanotubular MnO2/graphene oxide composites for the application of open air-breathing cathode microbial fuel cells. Biosens Bioelectron. 53:528–534. http://doi.org/10.1016/j.bios.2013.10.012.
- Goh C-P, Lim P-E. 2008. Potassium Permanganate as oxidant in the Cod test for saline water samples. ASEAN J Sci Technol Dev. 25(2):383–393.
- Gong J, Xu Z, Tang Z, Zhong J, Zhang L. 2019. Highly compressible 3-D hierarchical porous carbon nanotube/metal organic framework/polyaniline hybrid sponges supercapacitors. AIP Adv. 9(5):055032. http://doi.org/10.1063/1.5109042.
- Goswami C, Hazarika KK, Bharali P. 2018. Transition metal oxide nanocatalysts for oxygen reduction reaction. Mater Sci Energy Technol. 1(2):117–128. https://doi.org/10.1016/j.mset.2018.06.005.
- Haoran Y, Deng L, Chen Y, Yuan Y. 2016. Mno2/polypyrrole/MnO2 multi-walled-nanotube-modified anode for high-performance microbial fuel cells. Electrochim Acta. 196:280–285. https://linkinghub.elsevier.com/retrieve/pii/S0013468616304856.
- Harshiny M, Samsudeen N, Kameswara RJ, Matheswaran M. 2017. Biosynthesized FeO nanoparticles coated carbon anode for improving the performance of microbial fuel cell. Int J Hydrogen Energy. 42(42):26488–26495.
- He D, Rauwel E, Malpass-Evans R, Carta M, McKeown NB, Gorle DB, Anbu Kulandainathan M, Marken F. 2017. Redox reactivity at silver microparticle—glassy carbon contacts under a coating of polymer of intrinsic microporosity (PIM). J Solid State Electrochem. 21(7):2141–2146.
- He J, Wang M, Wang W, Miao R, Zhong W, Chen S-Y, Poges S, Jafari T, Song W, Liu J, Suib SL. 2017. Hierarchical Mesoporous NiO/MnO 2 @PANI core–shell microspheres, highly efficient and stable Bifunctional electrocatalysts for oxygen evolution and reduction reactions. ACS Appl Mater Interfaces. 9(49):42676–42687. https://pubs.acs.org/doi/10.1021/acsami.7b07383.
- Heyang Y, Hou Y, Abu-Reesh IM, Chen J, He Z. 2016. Oxygen reduction reaction catalysts used in microbial fuel cells for energy-efficient wastewater treatment: A review. Mater Horizons. 3(5):382–401. http://doi.org/10.1039/C6MH00093B.
- Hindatu Y, Annuar MSM, Gumel AM. 2017. Mini-review: anode modification for improved performance of microbial fuel cell. Renew Sustain Energy Rev. 73(November 2016):236–248.
- Hou J, Liu Z, Zhang P. 2013. A new method for fabrication of graphene/polyaniline nanocomplex modified microbial fuel cell anodes. J Power Sources. 224:139–144. http://doi.org/10.1016/j.jpowsour.2012.09.091.
- Hu Z, Zu L, Jiang Y, Lian H, Liu Y, Li Z, Chen F, Wang X, Cui X. 2015. High specific capacitance of polyaniline/mesoporous manganese dioxide composite using KI-H2SO4 electrolyte. Polymers (Basel). 7(10):1939–1953.
- Huang J, Zhu N, Yang T, Zhang T, Wu P, Dang Z. 2015. Nickel oxide and carbon nanotube composite (NiO/CNT) as a novel cathode non-precious metal catalyst in microbial fuel cells. Biosens Bioelectron. 72:332–339. http://doi.org/10.1016/j.bios.2015.05.035.
- Inamdar HK, Basavaraj RB, Nagabhushana H, Devendrappa M, Ambalgi S, Sannakki B, Mathad RD. 2016. DC conductivity study of polyaniline/NiO nanocomposites prepared through Green synthesis. Mater Today Proc. 3(10):3850–3854. http://doi.org/10.1016/j.matpr.2016.11.039.
- Jia Y, Qi Z, You H. 2018. Power production enhancement with polyaniline composite anode in benthic microbial fuel cells. J Cent South Univ. 25(3):499–505.
- Julien CM, Mauger A. 2017. Nanostructured mno2 as electrode materials for energy storage. Nanomaterials. 7(11):396.
- Kalathil S, Nguyen VH, Shim JJ, Khan MM, Lee J, Cho MH. 2013. Enhanced performance of a microbial fuel cell using CNT/MnO2 nanocomposite as a bioanode material. J Nanosci Nanotechnol. 13(11):7712–7716.
- Kariuki J, Ervin E, Olafson C. 2015. Development of a novel, low-cost, disposable wooden pencil graphite electrode for use in the determination of antioxidants and other biological compounds. Sensors (Switzerland). 15(8):18887–18900. http://www.mdpi.com/1424-8220/15/8/18887.
- Karthikeyan R, Krishnaraj N, Selvam A, Wong JWC, Lee PKH, Leung MKH, Berchmans S. 2016. Effect of composites based nickel foam anode in microbial fuel cell using acetobacter aceti and gluconobacter roseus as a biocatalysts. Bioresour Technol. 217:113–120. https://linkinghub.elsevier.com/retrieve/pii/S0960852416302607.
- Kim BC, Justin Raj C, Cho W-J, Lee W-G, Jeong HT, Yu KH. 2014. Enhanced electrochemical properties of cobalt doped manganese dioxide nanowires. J Alloys Compd. 617:491–497. https://linkinghub.elsevier.com/retrieve/pii/S0925838814018738.
- Le T, Yang Y, Yu L, Huang Z, Kang F. 2016. In-situ growth of MnO2 crystals under nanopore-constraint in carbon nanofibers and their electrochemical performance. Sci Rep. 6(1):37368. http://www.nature.com/articles/srep37368.
- Li S, Pan Q, Xiao K, Ouyang T, Li N, Liu Z. 2019. Metallic Co 9 S 8 coupled Hollow N-doped carbon sphere with synergistic interface structure for efficient electricity generation in microbial fuel cells. ChemCatChem. 11(24):6116–6123. https://onlinelibrary.wiley.com/doi/abs/10.1002/cctc.201901667.
- Li J-C, Wu X-T, Chen L-J, Li N, Liu Z-Q. 2018. Bifunctional MOF-derived Co-N-doped carbon electrocatalysts for high-performance zinc-air batteries and MFCs. Energy. 156:95–102. https://doi.org/10.1016/j.energy.2018.05.096.
- Li M, Zhou M, Tian X, Tan C, McDaniel CT, Hassett DJ, Gu T. 2018. Microbial fuel cell (MFC) power performance improvement through enhanced microbial electrogenicity. Biotechnol Adv. 36(4):1316–1327. https://doi.org/10.1016/j.biotechadv.2018.04.010.
- Liao ZH, Sun JZ, Sun DZ, Si RW, Yong YC. 2015. Enhancement of power production with tartaric acid doped polyaniline nanowire network modified anode in microbial fuel cells. Bioresour Technol. 192:831–834. http://doi.org/10.1016/j.biortech.2015.05.105.
- Madhusudhana MG, Bhakta AK, Mekhalif Z, Mascarenhas RJ. 2020. Bismuth-nanoparticles decorated multi-wall-carbon-nanotubes cast-coated on carbon paste electrode; an electrochemical sensor for sensitive determination of Gallic acid at neutral pH. Mater Sci Energy Technol. 3:174–182. https://doi.org/10.1016/j.mset.2019.10.001.
- Mahadevan A, Gunawardena DA, Fernando S. 2014. Biochemical and Electrochemical perspectives of the anode of a microbial fuel cell. Technol Appl Microb Fuel Cells. i:13. http://doi.org/10.5772/58755
- Mahajan AP, Kondawar SB, Mahore RP, Meshram BH, Virutkar PD. 2015. Polyaniline/MnO2 nanocomposites based stainless steel electrode modified enzymatic urease biosensor. Procedia Mater Sci. 10(Cnt 2014):699–705. http://doi.org/10.1016/j.mspro.2015.06.075.
- Mahmudi M, Widiyastuti W, Nurlilasari P, Affandi S, Setyawan H. 2018. Manganese dioxide nanoparticles synthesized by electrochemical method and its catalytic activity towards oxygen reduction reaction. J Ceram Soc Japan. 126(11):906–913.
- Malik D, Thakur J, Singh S, Sakaksnak RK. 2014. Nanocomposite electrode microbial fuel cell:A promising Technology for enhanced power generation from Yamuna water. Int J Sci Res. 3(7):641–646. https://www.ijsr.net/archive/v3i7/MDIwMTQxMDMy.pdf.
- Mathew S, Thomas PC. 2020. Fabrication of polyaniline nanocomposites as electrode material for power generation in microbial fuel cells. Mater Today Proc. 33:1415–1419. https://doi.org/10.1016/j.matpr.2020.06.502.
- Mazzeu MAC, Faria LK, Cardoso A, Gama AM, Baldan MR, Gonçalves ES. 2017. Structural and morphological characteristics of polyaniline synthesized in pilot scale. J Aerosp Technol Manag. 9(1):39–47. http://www.jatm.com.br/ojs/index.php/jatm/article/view/726.
- Mehdinia A, Dejaloud M, Jabbari A. 2013. Nanostructured polyaniline-coated anode for improving microbial fuel cell power output. Chem Pap. 67(8):1096–1102.
- Mink JE, Qaisi RM, Logan BE, Hussain MM. 2014. Energy harvesting from organic liquids in micro-sized microbial fuel cells. NPG Asia Mater. 6(3):1–5.
- Mishra P, Jain R. 2016. Electrochemical deposition of MWCNT-MnO2/PPy nano-composite application for microbial fuel cells. Int J Hydrogen Energy. 41(47):22394–22405. http://doi.org/10.1016/j.ijhydene.2016.09.020.
- Mohammad Shafiee MR, Sattari A, Kargar M, Ghashang M. 2019. Mno2/Cr2O3/PANI nanocomposites prepared by in situ oxidation polymerization method: optical and electrical behaviors. J Appl Polym Sci. 136(15):47219. http://doi.wiley.com/10.1002/app.47219.
- Mphuthi NG, Adekunle AS, Fayemi OE, Olasunkanmi LO, Ebenso EE. 2017. Phthalocyanine doped metal oxide nanoparticles on multiwalled carbon nanotubes platform for the detection of dopamine. Sci Rep. 7(1):43181. http://www.nature.com/articles/srep43181.
- Mu B, Zhang W, Xu W, Wang A. 2015. Hollowed-out tubular carbon@MnO 2 hybrid composites with controlled morphology derived from kapok fibers for supercapacitor electrode materials. Electrochim Acta. 178:709–720. http://doi.org/10.1016/j.electacta.2015.08.091.
- Oljira T, Muleta D, Jida M. 2018. Potential applications of some indigenous bacteria isolated from polluted areas in the treatment of brewery effluents. Biotechnol Res Int. 2018:1–13. https://www.hindawi.com/archive/2018/9745198/.
- Pandit S, Khilari S, Roy S, Pradhan D, Das D. 2014. Improvement of power generation using Shewanella putrefaciens mediated bioanode in a single chambered microbial fuel cell: effect of different anodic operating conditions. Bioresour Technol. 166:451–457. https://linkinghub.elsevier.com/retrieve/pii/S096085241400741X.
- Patade S, Silveira K, Babu A, Mhatre Y, Saini V, Rajput R, Mathew J, Birmole R. 2016. Bioremediation of Dye effluent waste through an optimised microbial fuel cell. Int J Adv Res Biol Sci Int J Adv Res Biol Sci www.Ijarbs.com. 3(3):214–226. http://s-o-i.org/1.15/ijarbs-2016-3-5-31.
- Qian F, Baum M, Gu Q, Morse DE. 2009. A 1.5 µl microbial fuel cell for on-chip bioelectricity generation.Lab Chip. 9(21):3076–3081. http://xlink.rsc.org/?DOI=b910586g.
- Rajesh PP, Noori MT, Ghangrekar MM. 2020. Improving performance of microbial fuel cell by using polyaniline-coated carbon–felt anode. J Hazardous Toxic Radioact Waste. 24(3):04020024. http://ascelibrary.org/doi/10.1061/(28ASCE)HZ.2153-5515.0000512.
- Relekar BP, Fulari A V, Lohar GM, Fulari VJ. 2019. Development of porous manganese oxide/polyaniline composite using Electrochemical route for Electrochemical supercapacitor. J Electron Mater. 48(4):2449–2455.
- Ringeisen BR, Henderson E, Wu PK, Pietron J, Ray R, Little B, Biffinger JC, Jones-Meehan JM. 2006. High power density from a miniature microbial fuel cell using Shewanella oneidensis DSP10. Environ Sci Technol. 40(8):2629–2634.
- Salman RH, Abed KM, Hassan HA. 2019. Energy generation by membraneless microfluidic fuel cell using acidic wastewater as a fuel. Int J Ambient Energy. 0(0):1–17.
- Sankar S, Inamdar AI, Im H, Lee S, Kim DY. 2018. Template-free rapid sonochemical synthesis of spherical α-MnO2 nanoparticles for high-energy supercapacitor electrode. Ceram Int. 44(14):17514–17521. https://doi.org/10.1016/j.ceramint.2018.05.207.
- Sapurina I, Stejskal J. 2009. Ternary composites of multi-wall carbon nanotubes, polyaniline, and noble-metal nanoparticles for potential applications in electrocatalysis. Chem Pap. 63(5):579–585. http://www.degruyter.com/view/j/chempap.2009.63.issue-5/s11696-009-0061-3/s11696-009-0061-3.xml.
- Shah A-HA, Khan MO, Bilal S, Rahman G, Van HH.2018. Electrochemical co-deposition and characteriza-tion of polyaniline and manganese oxide nanofibrouscomposites for energy storage properties. Adv PolymTechnol. 37(6):2230–2237. http://doi.wiley.com/10.1002/adv.21881.
- Shimamura N, Kanda R, Matsukubo Y, Yutaro H, Abe H, Yuji H, Yoshida T, Yabu H, Masuhara A. 2019. Preparation of hierarchic porous films of α-MnO 2 nanoparticles by using the Breath Figure technique and application for hybrid capacitor electrodes. ACS Omega. 4(2):3827–3831. https://pubs.acs.org/doi/10.1021/acsomega.8b03381.
- Singh P, Shukla SK. 2020. Advances in polyaniline-based nanocomposites. J Mater Sci. 55(4):1331–1365. https://doi.org/10.1007/s10853-019-04141-z.
- Sonawane JM, Patil SA, Ghosh PC, Adeloju SB. 2018. Low-cost stainless-steel wool anodes modified with polyaniline and polypyrrole for high-performance microbial fuel cells. J Power Sources. 379(November 2017):103–114. https://doi.org/10.1016/j.jpowsour.2018.01.001.
- Sun X, Li Q, Lü Y, Mao Y. 2013. Three-dimensional ZnO@MnO2 core@shell nanostructures for electrochemical energy storage. Chem Commun. 49(40):4456–4458. http://xlink.rsc.org/?DOI=c3cc41048j.
- Tahtaisleyen S, Gorduk O, Sahin Y. 2020. Electrochemical determination of sunset yellow using an Electrochemically prepared graphene oxide modified–pencil graphite electrode (EGO-PGE). Anal Lett. 0(0):1–23.
- Tan L, Li SJ, Wu XT, Li N, Liu ZQ. 2018. Porous Co3O4 decorated nitrogen-doped graphene electrocatalysts for efficient bioelectricity generation in MFCs. Int J Hydrogen Energy. 43(22):10311–10321. https://doi.org/10.1016/j.ijhydene.2018.04.074.
- Tan L, Yang Y-D, Li N, Chen S, Liu Z-Q. 2017. Enhanced activity and stability of Co 3 O 4 -decorated nitrogen-doped carbon hollow sphere catalysts for microbial fuel cells. Catal Sci Technol. 7(6):1315–1323. http://xlink.rsc.org/?DOI=C6CY02450E.
- Tanwar S, Ho JAA. 2015. Green synthesis of novel polyaniline nanofibers: application in pH sensing. Molecules. 20(10):18585–18596.
- Tikish TA, Kumar A, Kim JY. 2018. Study on the miscibility of Polypyrrole and polyaniline polymer blends. Adv Mater Sci Eng. 2018:8–13.
- Trindade ECA, Antônio RV, Brandes R, de Souza L, Neto G, Vargas VMM, Carminatti CA, de Oliveira SRD. 2020. Carbon fiber-embedded bacterial cellulose/polyaniline nanocomposite with tailored for microbial fuel cells electrode. J Appl Polym Sci. 137(35):49036.
- Tsuji R, Masutani H, Haruyama Y, Niibe M, Suzuki S, Honda SI, Matsuo Y, Heya A, Matsuo N, Ito S. 2019. Water electrolysis using flame-annealed pencil-graphite rods. ACS Sustain Chem Eng. 7(6):5681–5689. https://pubs.acs.org/doi/10.1021/acssuschemeng.8b04688.
- Wang H, Wang G, Ling Y, Qian F, Song Y, Lu X, Chen S, Tong Y, Li Y. 2013. High power density microbial fuel cell with flexible 3D graphene-nickel foam as anode. Nanoscale. 5(21):10283–10290. http://xlink.rsc.org/?DOI=c3nr03487a.
- Wang Y, Wen Q, Chen Y, Qi L. 2017. A novel polyaniline interlayer manganese dioxide composite anode for high-performance microbial fuel cell. J Taiwan Inst Chem Eng. 75:112–118.
- Wu G, Bao H, Xia Z, Yang B, Lei L, Li Z, Liu C. 2018. Polypyrrole/sargassum activated carbon modified stainless-steel sponge as high-performance and low-cost bioanode for microbial fuel cells. J Power Sources. 384(November 2017):86–92. https://doi.org/10.1016/j.jpowsour.2018.02.045.
- Wu X-T, Li J-C, Pan Q-R, Li N, Liu Z-Q. 2018. Gallic acid-assisted synthesis of Pd uniformly anchored on porous N-rGO as efficient electrocatalyst for microbial fuel cells. Dalt Trans. 47(5):1442–1450. http://xlink.rsc.org/?DOI=C7DT04063F.
- Wu W, Niu H, Yang D, Wang S, Jiang N, Wang J, Lin J, Hu C. 2018. Polyaniline/carbon nanotubes composite modified anode via graft polymerization and self-assembling for microbial fuel cells. Polymers (Basel). 10(7):759. http://www.mdpi.com/2073-4360/10/7/759.
- Wu Z-S, Ren W, Wang D-W, Li F, Liu B, Cheng H-M. 2010. High-Energy MnO 2 nanowire/graphene and graphene Asymmetric Electrochemical capacitors. ACS Nano. 4(10):5835–5842. https://pubs.acs.org/doi/10.1021/nn101754k.
- Wu X, Shi Z, Zou L, Li CM, Qiao Y. 2018. Pectin assisted one-pot synthesis of three dimensional porous NiO/graphene composite for enhanced bioelectrocatalysis in microbial fuel cells. J Power Sources. 378(November 2017):119–124. https://doi.org/10.1016/j.jpowsour.2017.12.023.
- Yaqoob AA, Ibrahim MNM, Rodríguez-Couto S. 2020. Development and modification of materials to build cost-effective anodes for microbial fuel cells (MFCs): An overview. Biochem Eng J. 164(June):107779.
- Yu P, Wang Q, Zheng L, Jiang Y. 2019. Construction of ultrathin nitrogen-doped porous carbon nanospheres coated With polyaniline nanorods for Asymmetric supercapacitors. Front Chem. 7(June):1–11. https://www.frontiersin.org/article/10.3389/fchem.2019.00455/full.
- Zhang C, Liang P, Yang X, Jiang Y, Bian Y, Chen C, Zhang X, Huang X. 2016. Binder-free graphene and manganese oxide coated carbon felt anode for high-performance microbial fuel cell. Biosens Bioelectron. 81:32–38. http://doi.org/10.1016/j.bios.2016.02.051.
- Zhao C, Gai P, Liu C, Wang X, Xu H, Zhang J, Zhu JJ. 2013. Polyaniline networks grown on graphene nanoribbons-coated carbon paper with a synergistic effect for high-performance microbial fuel cells. J Mater Chem A. 1(40):12587–12594.
- Zhao S, Li Y, Wang Y, Ma Z, Huang X. 2019. Quantitative study on coal and shale pore structure and surface roughness based on atomic force microscopy and image processing. Fuel. 244(January):78–90. https://doi.org/10.1016/j.fuel.2019.02.001.
- Zhao X, Tian T, Guo M, Xin L, Xiang L. 2020. Cauliflower-like polypyrrole@MnO2 modified carbon cloth as a capacitive anode for high-performance microbial fuel cells. J Chem Technol Biotechnol. 95(1):163–172. https://onlinelibrary.wiley.com/doi/abs/10.1002/jctb.6218.
- Zhong D, Liu Y, Liao X, Zhong N, Xu Y. 2018. Facile preparation of binder-free NiO/MnO2-carbon felt anode to enhance electricity generation and dye wastewater degradation performances of microbial fuel cell. Int J Hydrogen Energy. 43(51):23014–23026. https://doi.org/10.1016/j.ijhydene.2018.10.144.
- Zhou X, Xu Y, Mei X, Du N, Jv R, Hu Z, Chen S. 2018. Polyaniline/Β-MnO2 nanocomposites as cathode electrocatalyst for oxygen reduction reaction in microbial fuel cells. Chemosphere. 198:482–491. https://doi.org/10.1016/j.chemosphere.2018.01.058.