
Abstract
Mazu, or oak gall (Quercus infectoria Oliv.), a member of the Fabaceae family, is an abundant tree species in Iraq. Because of ongoing habitat damage, this species is on the verge of extinction. However, the genetic diversity of wild oak populations has yet to be measured. Semi-arbitrary [Inter-simple sequence repeat (ISSR)] and gene-targeted [Conserved DNA derived polymorphism (CDDP)] markers were employed separately or in combination to investigate genetic diversity within and among 85 Iraqi Mazu (Q. infectoria) accessions based on geographic origin. A total of 88 polymorphic alleles were produced in this investigation utilizing nine CDDP primers, with an average of 9.78 alleles per primer. The mean values for the major allele frequency (MAF), polymorphism information content (PIC), and marker index were 0.23, 0.29, and 2.79, respectively. Twenty ISSR primers were used to amplify 195 alleles (9.75 bands per primer), with MAF, PIC, and MI values of 0.21, 0.28, and 2.72, respectively. All accessions were divided into two major groups with multiple sub-groups based on Ward clustering and structure analysis. Within-population variance was calculated to be 94.17% using CDDP markers and 92.97% using ISSR markers. As per the fixation index values derived from the STRUCTURE analysis, there was a significant difference within the population. Increased gene flow was found among populations. The correlation (r) between the CDDP-based genetic distance matrix and the ISSR-based genetic distance matrix was 0.54, with a p-value of 0.001. The genetic dissimilarity calculated by CDDP and ISSR data revealed a wide range of diversity, demonstrating substantial genetic variation across accessions originating from various populations. This investigation’s findings could aid in the conservation and further utilization of oak germplasm.
Introduction
Oaks are members of the genus Quercus, which is further subdivided into two subgenera: Cyclobalanopsis and Euquercus. Euquercus is subdivided into six sections. The section Lepidobalanus is extensively widespread, with species occurring in Europe, Asia, North Africa, and North America, and includes important cooperage species. It is a broad genus in the Fagaceae family with around 600 species that grow in a variety of environments and are found in temperate and subtropical regions of the northern hemisphere. Oaks are valued as cultural and patrimonial resources in many nations, in addition to their economic and ecological importance. It is also resistant to hard environments and regenerates quickly after fires. It also resprouts after being trimmed to the ground or grazed. Despite their importance, they have received limited and inconsistent attention in genetic studies when compared to other forest trees. The northern Iraqi highlands are a chain of mountains that stretch from Iran (east) to Turkey (north) (Khwarahm Citation2020). In this region, oak forests account for 90% of total forest cover, with the remaining 10% made up of plantations, pine forests, and some species of Pistacia and Crataegus genera (Guest and Townsend Citation1966; Zohary Citation1973; Khwarahm Citation2020). Q. infectoria is native to portions of southern Europe (Greece and the East Aegean Islands) and the Middle East (Turkey, Cyprus, Iran, Iraq, Lebanon, Syria, Jordan, and Israel) (Lim Citation2012). In Iraq, Q. aegilops is the major oak species, followed by Q. libani, Q. infectoria, and Q. macranthera. Except for Q. macranthera, the others are considered native to the area (Zohary Citation1973; Khwarahm Citation2020). Q. infectoria, often known as Mazu or oak galls, is an evergreen shrub that grows to a height of 1.8 m. It is a monoecious species. Mazu is suitable for medium loamy soils with acid, neutral, and basic soils. It may grow in semi-shade or full sunlight and has various social values in addition to its environmental benefits. For example, its wood is used to make many tools, its leaves are used as feed for cattle during the winter, and its branches have been used to build shelters during the summer. Furthermore, Mazu can be used to thicken stews or combined with cereal to make bread (Lim Citation2012; Tayel et al. Citation2018). It is also used in traditional medicine as a dental powder and to cure toothache and gingivitis (Bhattacharjee Citation2000). It is employed in the manufacture of gold sols used as markers in immunocytochemistry due to its high tannic acid content. Tannin, syringic acid, -sitosterol, amentoflavone, hexamethyl ether, isocryptomerin, methyl betulate, methyl oleanate, and hexagalloyl glucose are the maximum naturally present levels in Q. infectoria galls (Ikram and Nowshad Citation1977; Dar and Ikram Citation1979; Basri et al. Citation2011; Taib et al. Citation2020; Elham et al. Citation2021). The gallnut extracts of Q. infectoria are now widely utilized in pharmaceuticals, food and feed additives, dyes, inks, and metallurgy (Mayer Citation1988; Griffiths Citation1993).
The preservation of genetic variation is a critical conservation goal. The measurement of genetic diversity within and among populations is crucial to directing methods for plant conservation and sustainable use for genetic improvement (Cires et al. Citation2018). The assessment of the genetic diversity profile and genetic structure of a species’ populations aids in determining its current condition and risks, and so can serve as a foundation for developing acceptable scientific management policies and appropriate conservation initiatives. It is critical to conserve genetic diversity in order to boost population resilience to changing environments and to maintain a wide gene pool for future genetic improvement (Mahar et al. Citation2013; Liu et al. Citation2020).
Different marker systems, including morphological, biochemical, and molecular (DNA) markers, can be used to determine genetic diversity. Because DNA markers are unaffected by environmental circumstances, they can be used to help identify patterns of genetic diversity among plant populations. With recent developments in genomics research, DNA markers have taken on considerably greater importance (Kumar et al. Citation2009). Using various marker systems, genetic diversity in plants can be obtained at the species, population, germplasm accessions, and individual genotype levels, such as pure lines or clones. Molecular markers enable the discovery of differences or polymorphisms in specific regions of DNA that exist among individuals in a population. In gene mapping, molecular markers can be used in the direct identification of the gene of interest rather than the gene product, making it a useful tool for screening somatic cell hybrids and providing enough markers to build genetic maps utilizing linkage analysis (Gupta et al. Citation1999; Rakshit and Swapna Citation2015). CDDP molecular markers are a novel technique based on conserved DNA sequences. Single primers are created and coupled with conserved areas of functional genes in this method to amplify the whole plant genome and create informative bands (Collard and Mackill Citation2009; Talebi et al. Citation2018; Liu et al. Citation2020; Ahmed et al. Citation2021; Igwe et al. Citation2021). Assessments of genetic variation within and between populations have been revealed in Quercus species by simple sequence repeats (SSR) (Mohammad-Panah et al. Citation2017; Torres-Ruiz et al. Citation2019). Nevertheless, no studies have been conducted to examine population diversity in a diverse collection of Q. infectoria in the world and Iraq using CDDP and ISSR markers, either separately or jointly. The current study is the first attempt to measure genetic variability within and among Mazu populations, using individual and a combination of semi-arbitrary (ISSR) and gene-targeted (CDDP) markers. Our efforts were directed toward the following goals: (a) To assess the efficiency of CDDP and ISSR (either independently or in combination) in analyzing genetic diversity among and within Iraqi Mazu populations from diverse geographical regions. (b) to explore population differentiation using genetic diversity criteria for future use in population and conservation genetics. (c) to assess gene flow between populations.
Materials and methods
Plant materials and DNA extraction
In northern Iraq, 85 Q. infectoria accessions were gathered from eleven different locations across four provinces (Figure ). Table summarizes information concerning accessions passports. Fresh leaves from the accessions were collected and rinsed with sterile distilled water. The leaf was ground into a powdered tissue. The pulverized tissue was washed with a sorbitol solution (900 µL) [(100 mM Tris-HCl pH 8.0, 0.35 M sorbitol, 5 mM EDTA pH 8.0, 1% (w/v) polyvinylpyrrolidone (PVP), and (1% v/v) 2-mercaptoethanol] to remove the sugar content. The sample was manually agitated for 1 min before being centrifuged at 4200 rpm for 135 s at 25°C. Supernatants containing polysaccharides and polyphenols are carefully removed after centrifugation, and the process is repeated 5 times. To lyse washed leaf material, one milliliter of lysis buffer [0.50% (w/v) SDS, 8.00% (w/v) PVP, 0.25 M NaCl, 0.025 M EDTA, and 0.2 M Tris-base] and 12 µL RNase (10 mg/mL) were used. After that, tubes were incubated for 75 min at 63°C and inverted 12 times. The tube samples were cooled at room temperature for 10 min. After cooling, 310 µL of 5 M potassium acetate (pH 6.5) was poured, mixed, and refrigerated for at least 9 min. The mixture was centrifuged at 16100 rpm for 15 min. The supernatant was transferred to a 2 mL tube, and 850 µL of chloroform was mixed thoroughly. The mixture was rotated at a speed of 16,400 rotations per minute. The upper phase was gathered and transferred to a new Eppendorf tube (2 mL). To the upper phase, one milliliter of GE buffer (2M guanidine thiocyanate diluted in 75% ethanol) was added and carefully mixed. The mixture was placed on a spin column and incubated at room temperature for 1 min. The solution was centrifuged for 5 min at 8000 rpm, and the flow solution was discarded.
Figure 1. A map showing the collection sites of 85 Q. infectoria accessions.
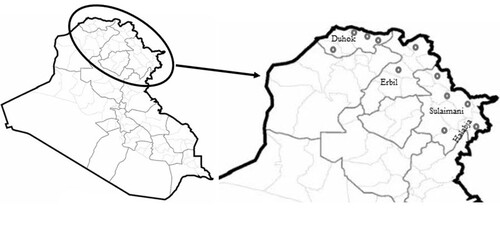
Table 1. Summarizes information of 85 Q. infectoria accessions used in this study.
The spin-column was filled with 510 µL of NTE washing buffer (10 mM NaCl, 10 mM Tris-base pH 6.5, and 80% ethanol). The flow solution was removed after the column was centrifuged for 5 min at 8100 rpm. A volume of 520 µL of NTE buffer was used to wash the spin column a second time. After centrifuging the spin column at 8100 rpm for 5 min, the flow solution was removed. The spin column was centrifuged for 6 min at 11,100 rpm to dry it. The spin column was placed in a new Eppendorf 1.5 mL tube, which was then loaded with 100 µL of elution buffer and incubated for 5 min at room temperature. The eluted DNA was collected by centrifugation at 9000 rpm for 5 min and kept at −20°C. The quantity and purity of purified DNA were measured using a NanoDrop spectrophotometer (NanoPLUS, MAALANLAB, Sweden).
CDDP and ISSR analysis
Nine of the fifteen CDDP primers (Collard and Mackill Citation2009) used in Mazu oak genotyping were amplified and polymorphic. In terms of the ISSR system, 33 ISSR primers (Debnath Citation2008; Alansi et al. Citation2016) were tested, with twenty displaying acceptable repeatability and reliability and being chosen for PCR amplification. Tables and summarize the CDDP and ISSR markers detected in oak accessions. The reaction mixture (25.0 µL) contained 10.0 µL master mix (AddBio, Korea), 4.0 µL (10 µM) primer, 5.0 µL (80.0 ng) DNA template, and 6.0 µL deionized water (Mei et al. Citation2015). Amplification was carried out in a Thermo-cycler (Applied Biosystem) for 38 cycles, each consisting of a denaturation step at 94°C for 1 min, an annealing step at 50°C for CDDP primers and 50–60°C for ISSR primers for 1 min, and an extension step at 72°C for 2 min. An initial denaturation step of 7 min at 94°C and a final extension step of 9 min at 72°C were also included. Amplified products were electrophoresed on a 1.7% agarose gel stained with Ethidium Bromide (0.6 g/mL) and then visualized using a gel documentation system.
Table 2. Sequence of the CDDP primers and their effectiveness and polymorphism utilized in Q. infectoria accessions.
Table 3. ISSR sequence primers used in Q. infectoria accessions, as well as their efficacy and polymorphism.
Scoring and data analysis
The scorable bands were manually classified as either present (1) or absent (0). The dissimilarity was calculated based on the Dice coefficient using the XLSTAT version 2020. The dendrogram was constructed using the Ward method using JMP 16 software. The PowerMarker version 3.25 program was used to calculate major allele frequency (MAF). The polymorphism information content (PIC) was calculated by using the PIC = 1–[f2 + (1–f)2] formula, where f is the marker frequency in the data set (Roldán-Ruiz et al. Citation2000; de Riek et al. Citation2001). The marker index was calculated by multiplying the average PIC with the number of polymorphic bands (Ahmed et al. Citation2021). The PhiPT distance and molecular variance (AMOVA) between and within populations were calculated using the GenAlEx version 6.5 software. A model evaluation for population structure was performed using the STRUCTURE version 2.3.4 software to determine genetic makeup and explain the number of populations (Pritchard et al. Citation2000; Evanno et al. Citation2005). The admixture model and correlated allele frequencies were utilized in this study as ancestry and allele frequency models, respectively. The number of putative populations (K) was set between 1 and 9, and the evaluation was conducted three times. The burn-in and MCMC issues were resolved at 52,000. To assign accessions to populations, the run with the highest probability was applied. The Mantel test was used to estimate the correlation between dissimilarity matrices using the XLSTAT software, version 2020.
Results
Efficiency and polymorphism of CDDP and ISSR markers
In this CDDP study, nine of the fifteen primers analyzed produced amplified fragments. Eighty-eight polymorphism bands were produced by nine primers. The efficacy of the ERF-1 primer on DNA amplification in Mazu accessions is displayed in Figure A. The total number of polymorphic bands detected ranged from 5 (KNOX-2) to 13 (WRKY-R3B), with a mean of 9.75 bands per primer (Table ). The major frequency allele varied between 0.08 (MYB-2) and 0.38 (ERF-1). KNOX-2 appeared to have the greatest PIC value of 0.41, while WRKYR-1 had a lower PIC value of 0.22, indicating that the CDDP primers utilized in the investigation were successful and polymorphic. The primer KNOX-2 had the lowest marker index (MI) (2.05), while WRKY-R3B had the highest (4.16), with a mean of 2.79 per primer.
Figure 2. Amplification profiles in Q. infectoria accessions using various primers. (A) ERF-1 and (B) ISSR-11.
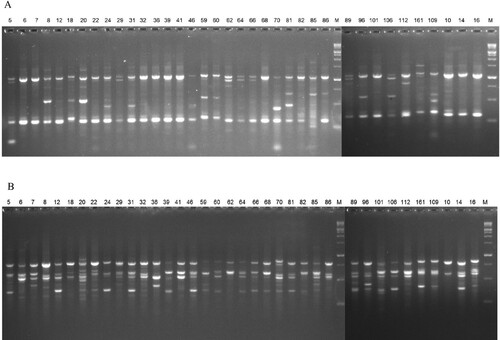
In this work, twenty of the thirty ISSR markers tested produced amplified polymorphic bands. The effectiveness of the ISSR-11 primer on DNA amplification in Mazu accessions is seen in Figure B. There was a total of 195 bands found, with each primer revealing an average of 9.75 polymorphic bands. The RA12, UBC-818, and UBC-841 primers (each with 13 bands) produced the maximum number of polymorphic fragments, whereas ISSR-6 produced the lowest (5 bands). The MAF ranged between 0.07 (for UBC-841) and 0.46 (for ISSR-6) with a mean value of 0.21 (Table ). The PIC value ranged from 0.19 to 0.34, with an average of 0.28, demonstrating that the ISSR primers employed in the study were efficient and polymorphic. MI values varied from 1.20 to 4.16, with a mean of 2.72. UBC-841 exhibited the highest MI value among the 20 ISSR markers tested.
Cluster analysis of Q. infectoria accessions
Based on the CDDP analysis, the phylogenetic grouping of the dissimilarity matrix produced a dendrogram with two major clusters (Figure A): the first cluster (Gr1) had 37 accessions, while the second cluster (Gr2) included 48 accessions. Two sub-clusters (SC1 and SC1) could be identified within the first group (Gr1). The first sub-cluster (SC1) had 32 accessions. The second sub-cluster (SC2) was made up of five accessions from Duhok province, including ACC6, ACC7, ACC8, ACC9, and ACC12. The second group (Gr2) was divided into two separate sub-clusters (SC1 and SC2). There were 43 accessions in the sub-cluster (SC1). The sub-cluster (SC2) was made up of five accessions: ACC37, ACC38, ACC40, ACC41, and ACC42. Based on the Dice coefficient, the genetic dissimilarity ranged from 0.04 to 0.76. Two accessions (ACC41 and ACC42) seemed to have the minimum dissimilarity coefficient, while ACC78 and ACC83 had the highest. The cophenetic correlation coefficient between the dissimilarity and cophenetic matrices was 0.71, indicating a good fit between the two and high reliability of the clustering result. The CDDP assay did not differentiate Mazu accessions according to their origin region, as seen in the dendrogram. The data also demonstrated that the CDDP clusters had no discernible link to the origin and source of the accessions.
Figure 3. Dendrogram relying on Ward's Hierarchical Clustering method illustrating genetic associations of 85 Q. infectoria accessions. (A) CDDP, (B) ISSR, and (C) CDDP + ISSR data. Red and green colors represent groups 1 (Gr1) and 2 (Gr2), respectively. The numbers SC11 and SC2 denoted the number of sub-clusters. The accessions used in this study were denoted by the letters ACC1-ACC85. More information on accessions can be found in Table .
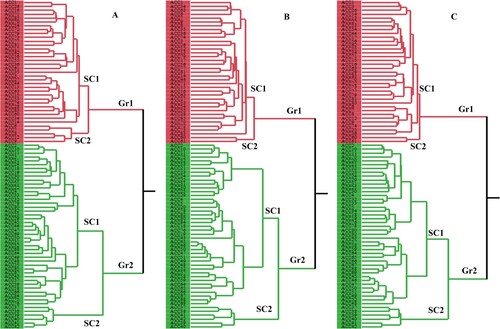
Our 64 accessions were divided into two groups for the Ward dendrogram that followed the ISSR data (Figure B). The first group (Gr1) had thirty different genetically similar accessions and was separated into two sub-groups (SC1 and SC2). The first sub-group included 35 accessions, while the second sub-group included ACC60 and ACC61. The second (Gr2) was made up of 48 other accessions and split into two sub-groups (SC1 and SC2). Based on ISSR molecular markers, the dice coefficients for the genetic dissimilarity of Q. infectoria accessions ranged from 0.03 to 0.73. The ACC25 and ACC81 accessions had the greatest distance (0.73), whereas the ACC45 and ACC46 accessions had the minimum. The clustering of accessions, based on ISSR data, was unrelated to the geographical origins and sources of accessions. The cophenetic correlation coefficient between the dissimilarity and cophenetic matrices was 0.70, indicating a good fit between the two and the high dependability of the clustering result.
The accessions were divided into two large clusters by the general dendrogram, which was created utilizing the combined data from all of the molecular markers utilized in this study (Figure C). Cluster I (Gr1) contained thirty seven accessions. Cluster II (Gr2) has 48 accessions. The CBDP data dendrogram was the most compatible with the general dendrogram. The cophenetic coefficient for combined data was 0.75, indicating a satisfactory fit for clustering. The Dice coefficients for genetic differentiation of Q. infectoria accessions varied from 0.06 to 0.66 based on pooled molecular marker data.
Assessment of population structure in Q. infectoria accessions
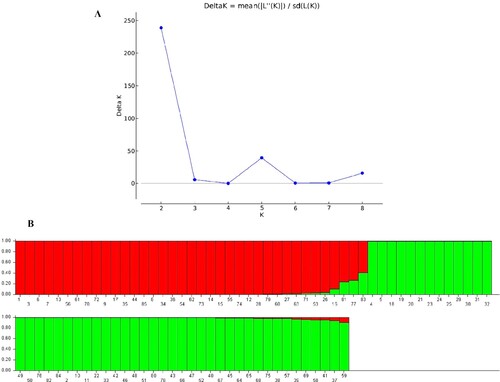
The STRUCTURE V2.3.4 software was used to determine the population structure of the 85 accessions using the Hardy-Weinberg Equilibrium. The results of evaluating 85 Q. infectoria accessions by 9 CDDP and 20 ISSR primers were subjected to admixture model-based simulations with K ranging from 1 to 9. The results showed that the largest delta K value obtained for both CDDP and ISSR marker analysis was K = 2, as represented by a sharp peak (Figures A and A). The admixture model and the Bayesian method were used to generate the Bayesian bar graphs. Furthermore, accessions with a likelihood of greater than 79% for a specific group were ascribed to that group, whilst accessions with a probability of less 79% for any population were classified as admixtures. The 85 Q. infectoria accessions were divided into two populations based on Bayesian bar plot analysis utilizing data recorded by nine CDDP primers: population 1 (red vertical bars) and population 2 (green vertical bars). Forty-eight (56%) of the 85 accessions were classified into the first population, 32 (38%) into the second population, and the remaining 5 (6%) accessions looked to have ancestry from more than one population (Q values of less than 80%) (Figure B).
Figure 4. STRUCTURE output of 85 accessions based on CDDP data. (A) Evanno’s ad hoc statistic of K scale. (B) Population structure of 85 Q. infectoria accessions at K = 2. Each color represents a specific population subset. The horizontal axis numbers (1–85) correspond to the individual codes of Q. infectoria accessions. Table contains information on accessions.
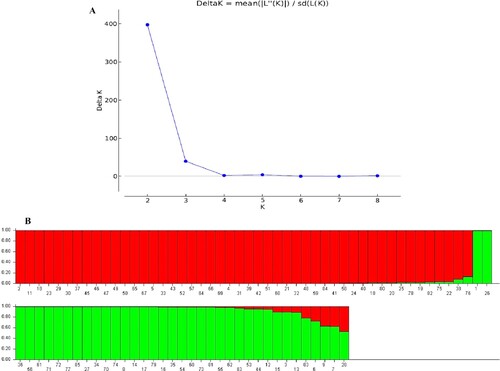
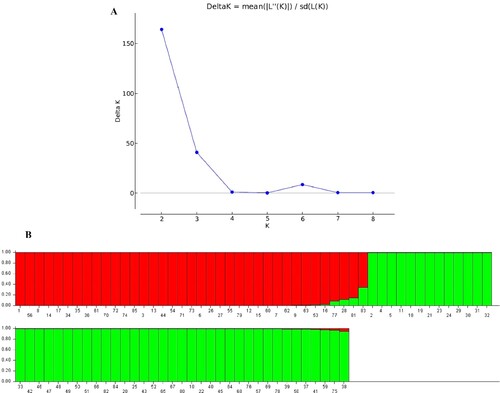
Figure 5. STRUCTURE analysis of 85 accessions based on ISSR data. (A) Evanno’s ad hoc statistic of K ranging from 1 to 9, with a peak at the ‘ideal’ number of population clusters. (B) Population structure of 85 Q. infectoria accessions at K = 2. Each color denotes a specific population category. The numbers (1–85) on the horizontal axis correspond to the individual codes of Q. infectoria accessions. Table contains information about accessions.
Based on Bayesian bar plot analysis of data collected by twenty ISSR primers, the 85 Q. infectoria accessions were split into two populations (Figure B): population 1 (red vertical bars) and population 2 (green vertical bars). Thirty-four (40%) of the 85 accessions were identified as belonging to the first population, 48 (56%) as belonging to the second population, and the remaining 3 (4%) as having ancestry from more than one population (Q values of less than 80%).
The Hardy-Weinberg Equilibrium was used to determine the population structure of the 85 accessions using the combined data of CDDP and ISSR markers. Regarding the greatest probability and delta K values, there were two ideal groups (Figure ). Thirty-six accessions were allocated to population 1; forty-eight accessions were assigned to population 2, and the remaining one accession was regarded as an admixed accession.
Figure 6. STRUCTURE results of 85 accessions based on CDDP and ISSR data. (A) Evanno’s ad hoc statistic of K. (B) Population structure of 85 Q. infectoria accessions at K = 2. Each color denotes a specific population subset. The horizontal axis numbers (1–85) refer to the individual codes of Q infectoria accessions. Table gives details on accessions.
CDDP data inferred cluster, predicted heterozygosity, and fixation index (Fst) ranged from 0.41 to 0.59, 0.21 to 0.25, and 0.25 to 0.45, respectively, whereas ISSR data inferred cluster, predicted heterozygosity, and fixation index (Fst) varied from 0.43 to 0.57, 0.21 to 0.26, and 0.23 to 0.40, respectively. The reporting structure of combined data from CDDP and ISSR markers was comparable to that obtained from ISSR data (Table ). The gene flow was estimated using the Phi-PT value generated from the AMOVA results, and the highest (4.06) and lowest (3.31) gene flow values were obtained from the CDDP and ISSR data, respectively (Figure ). The high observed gene flow value across populations in our study, together with considerable levels of genetic variation within geographical areas, points to a plausible migrant-pool migratory model.
Figure 7. Illustrating gene flow among populations based on CDDP, ISSR, and combined (CDDP + ISSR) data.
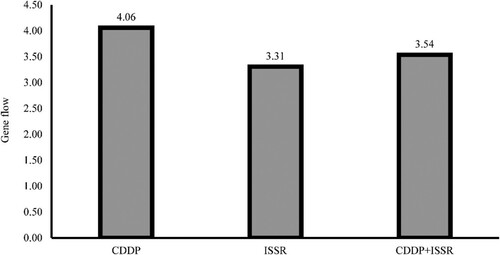
Table 4. STRUCTURE reporting of 85 Q. infectoria accessions for the inferred cluster, fixation index (Fst), and expected heterozygosity
Analysis of molecular variance in Q. infectoria accessions
AMOVA was performed on four populations (a collection of four provinces), utilizing 88 polymorphic CDDP bands to divide and evaluate total genetic variation within and within populations (Table ). Within populations, highly significant differences were found. The PhiPT value was 0.06 with a p-value of 0.001, indicating that there was only minor genetic diversity between sites of collection. The level of genetic variation within each population (94.17%) was larger than the level of variance across populations (5.83%). The significant variation within the population was greater than the diversity across populations as a consequence of ISSR-AMOVA (Table ). In the population sets, the significant and largest genetic variants appeared at a rate of 92.97%. The PhiPT value was 0.07, with a p-value of 0.001, showing that genetic variation between collecting locations was low. According to the AMOVA result of combined markers based on the PhiPT values, the differential within the groups was significant (p < 0.001) and explained 93.34% of the entire genetic variance, while the component contributed 6.66% of the variation across groups (Table ).
Table 5. AMOVA for the Q. infectoria accessions analyzed based on CDDP, ISSR, and combined data.
Correlation analysis of genetic distance matrices using two different types of marker datasets
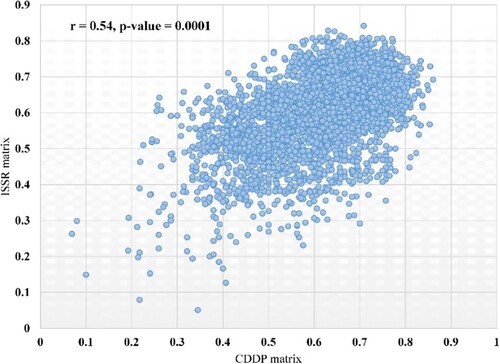
The correlation between the genetic distance matrices created by CDDP and ISSR molecular markers was measured using mantel testing. In the current investigation, the significant moderate coefficient of correlation (r) between the CDDP and ISSR genetic distance matrices was 0.54, with a p-value of 0.0001 (Figure ).
Figure 8. Mantel tests showing the correlation between the CDDP and ISSR distance matrices.
Discussion
Genetic variation has been explored for two reasons: first, it is a requirement for long-term sustainability, and second, it is an essential source of plant conservation and breeding programs. As a result, in order to establish strategies for effective conservation and sustainable use of oak genetic resources, it is necessary to gather sufficient knowledge about the levels of genetic variation patterns in oak trees. One of the most important goals in the conservation of endangered species is to maintain genetic diversity. The ability to understand the genetic variation between and within populations is critical for developing suitable management methods aimed at preserving them. It has been suggested that a lack of forest management, as well as population decline, could result in a considerable reduction in genetic diversity based on Q. infectoria molecular study, which includes high genetic diversity, high gene flow, and low population divergence.
The allelic richness of accessions is a measure of their genetic diversity enrichment, which is often exploited by informative molecular markers that identify populations for selection, breeding, and conservation. Different molecular markers and primers produced different amplification products, reflecting the polymorphism of the genomic areas, implying that different marker design approaches will yield different results. The reliability of the data should, theoretically, improve as the number of markers and genome coverage increases. As a result, two different types of molecular markers were used, yielding 283 bands. The high levels of polymorphism produced by different markers demonstrated their utility in studies of genetic variability in Iraqi Q. infectoria populations. The gene-targeted and ISSR markers produced a lot of variation, so they could be used to identify plant materials that have close relations in various populations. The largest mean number of polymorphisms in each marker shows the usefulness of each locus for genetic diversity estimation. Therefore, primers with more alleles are better for genetic variation testing since they cover more areas of the genome. The fact that the specificity and effectiveness of different primers are controlled by different nucleotide sequences may explain the variation in polymorphism in marker systems detected by various primers. Alikhani et al. (Citation2014) employed ISSR markers to explore genetic diversity in Q. brantii, resulting in 126 polymorphic bands with an average of 12.6 fragments per primer. Furthermore, Conte et al. (Citation2007) employed random amplified polymorphic DNA (RAPD) and ISSR to analyze the genetic diversity of samples taken from Q. cerris, Q. suber, and Q. crenata throughout Italy, reporting 42 amplified bands with an average of 14 bands per primer. PIC is a measure of genetic diversity among population accessions. This focuses on the evolutionary pressure on alleles as well as the mutation rate that a locus may have experienced over time. PIC values are a critical indicator of marker effectiveness for linkage analysis when assessing the inheritance between offspring and parental genotypes. In this study, we discovered that most CDDP and ISSR markers had an average PIC value greater than 0.25, showing that these marker types are more successful for genetic diversity analysis in Q. infectoria accessions and demonstrating the presence of significant genetic variation. A higher PIC value indicated a greater degree of CDDP and ISSR marker polymorphism, which aided in the selection of the optimal CDDP and ISSR markers in the genetic divergence analysis. In our investigation, the average ISSR-PIC value was higher than that obtained by Alikhani et al. (Citation2014).
A species’ genetic differentiation reflects the interactions of several evolutionary processes, involving shifts in dispersion, habitat alteration and population isolation, mutation, genetic drift, mating system, gene flow, and natural selection. Geographic isolation, community fragmentation, breeding systems, and genetic drift are all potential causes of substantial population differences. The fixation index of population differentiation (Fst) measures the extent of diversity on a scale of 0–1, with 0 indicating complete genetic material sharing and 1 indicating no sharing. An Fst value larger than 0.15 can be regarded as significant in discriminating populations (Frankham Citation1995). The mean Fst value of 0.35 suggested that CDDP markers revealed approximately 35% genetic diversity among the accessions, which was higher than the diversity shown by ISSR markers (Fst = 0.32).
Gene flow is another method for determining genetic diversity in a population, which can also alter the genetic structure. It permits individuals of one gene pool to mate with members of another gene pool, causing allele frequencies to shift and the degree of population divergence to decrease. As a result, the more obvious the gene flow, the lesser the degree of genetic differentiation. In population genetics, the estimate of gene flow has been classified as minimal (gene flow < 1), moderate (gene flow > 1), and extensive (gene flow > 4) (Slatkin Citation1987; Kumar et al. Citation2014). Due to high Fst and gene flow values in this study, geographic origin-based populations were not organized by the two marker systems, independently or in combination, in the clustering and structure analysis. The moderate to extensive gene flow among groups indicates a significant degree of gene exchange between different populations. When compared to arbitrary markers (ISSR), the gene flow estimate by gene-targeted markers (CDDP) was reported to be high (4.06).
This finding was further corroborated by the AMOVA analysis, which demonstrated that the majority (92–94%) of total genetic diversity by both marker systems was dispersed within populations, whereas a smaller fraction (6–8%) was ascribed to variations between populations. The total PhiPT values calculated from CDDP and ISSR indicated geographic distribution did not affect Q. infectoria accessions’ genetic diversity. This study demonstrated regular gene pool flow among groups, which could be mediated through rampant cross-pollination. The degrees of genetic diversity and variable allocation within and between plant populations have traditionally been understood as the outcome of a balanced mix of the reproductive system and the species’ history. In comparison to inbreeding or selfing annual species populations, perennial and allogamous species often exhibit higher levels of genetic diversity inside, rather than between, populations, emphasizing the presence of biological features that define these characteristics. Previous research has also shown that self-pollinating species have less genetic variation within their populations than outcrossing species (Loveless and Hamrick Citation1984; Schoen and Brown Citation1991). Factors such as extensive nature and insect pollination may have contributed to this dispersed pattern of genetic divergence, which resulted in minimal population differentiation, high gene flow, and frequent gene exchange. The findings of this research showed that sampling a higher number of plants from each population or geographic location could capture more genetic differences in Q. infectoria. Furthermore, gene mutation, gene flow, population size, and sampling approach have all been shown to influence genetic diversity in previous research (Jiajun et al. Citation2010). Our results showed that the maximum pairwise population PhiPT (distance) values between the Duhok and Halabja populations were 0.103 and 0.101 for CDDP and ISSR markers, respectively. Since these two populations are not neighbors, geographical proximity may have played a role in the clustering of the provenances. The latitude, longitude, and altitude of the locations may also be distinguishing factors contributing to the dissimilarity in genetic diversity between the Halabja and Duhok populations.
The clustering analysis produced a comparable grouping distribution for all two approaches. Discordance between dendrograms acquired by various marker types could be explained by the distinct nature of each marker, the different sections of the genome covered by different marker approaches, the extent of polymorphism perceived, and the number of loci. Data from CDDP and ISSR markers confirmed the reliability of the inferred associations, with cophenetic correlation values of more than 0.75 for CDDP and ISSR marker systems, indicating a good fit.
The STRUCTURE results of our analysis, like the dendrogram plot, suggested that the accessions can be separated into two populations. Moreover, the dendrogram plot's accessions distribution pattern is the most similar to the distribution pattern produced by STRUCTURE analysis. Population stratification analysis aids in both understanding genetic variation and aiding genome-wide association study (GWAS) research. As a result, careful consideration is given to a detailed search of the underlying population structure of each population to be employed for marker-trait associations. As a result, population structure analysis is the first step in conducting GWAS for the true marker-trait relationship. The geographical origins of the accessions had little effect on accession clustering. The existence of admixed accessions, implying that the majority of diversity is contained within the accessions of the clusters. Two populations may be acceptable for our panel based on population size and volatility in the number of accessions reflecting the eleven regions from where they were obtained.
The current study compared the use of combinational markers, such as arbitrarily dominant (ISSR) and gene-targeted (CDDP) types, for examining the combined ability of the markers for genetic diversity evaluation among oak populations. It has been observed that cumulative multi-marker studies are more accurate than individual ones. As a result, it is recommended to use combined markers when performing analytical assessments of genetic diversity because CDDP and ISSR markers target diverse genomic regions, giving reliable and convincing results (Ferrão et al. Citation2013). The current study, which uses multiple DNA marker-based diagnostic profiles of oak, enables rapid characterization of local accessions within populations, allowing for the identification of suitable accessions for conservation, sustainability, and commercial exploration.
Conclusion
In essence, the current work demonstrated the effectiveness of DNA marker systems in elucidating genetic variation within and among Iraqi oak populations depending on the geographical origin. The increased level of polymorphism achieved with all of the marker systems utilized in this work for population diversity analysis clearly illustrated their use in evaluating genetic variability among Iraqi oak accessions. The marker index value for each primer in both marker systems was considerable, indicating that there were more polymorphic bands and evidence from the genome. Accessions cluster analysis demonstrated that the CDDP and ISSR markers discriminated against a wide range of accessions. Based on cluster and structure analysis data, two populations of Q. infectoria were identified in northern Iraq. The current study's molecular markers demonstrated significant genetic diversity within Q. infectoria populations but little genetic diversity between populations, suggesting a high level of gene exchange between populations. In diversity analysis, the combined marker technique proved more illuminating than the use of individual markers. Geographic origin-based populations were not ordered by the two marker systems, independently or in combination, in the clustering and structure analyses due to high Fst and gene flow values. The current study generated data that producers and academics can utilize to better the preservation and sensible use of this important wild oak. Recognizing the genetic variation among and within Iraqi oak populations will be a valuable resource for prospective germplasm conservation, maintenance, and exploitation.
Acknowledgments
The authors would like to express their gratitude to the Department of Horticulture at the College of Agricultural Engineering Sciences for their assistance and support.
Data availability statement
The data supporting the findings of this research is accessible via the 4TU. Research Data repository [https://data.4tu.nl/portal] at https://doi.org/10.4121/16783090.v2.
Disclosure statement
No potential conflict of interest was reported by the authors.
References
- Ahmed DA, Tahir NAr, Salih SH, Talebi R. 2021. Genome diversity and population structure analysis of Iranian landrace and improved barley (Hordeum vulgare L.) genotypes using arbitrary functional gene-based molecular markers. Genet Resour Crop Evol. 68:1045–1060.
- Alansi S, Tarroum M, Al-Qurainy F, Khan S, Nadeem M. 2016. Use of ISSR markers to assess the genetic diversity in wild medicinal Ziziphus spina-christi (L.) Willd. collected from different regions of Saudi Arabia. Biotechnol Biotechnol Equip. 30:942–947.
- Alikhani L, Rahmani M-S, Shabanian N, Badakhshan H, Khadivi-Khub A. 2014. Genetic variability and structure of Quercus brantii assessed by ISSR, IRAP and SCoT markers. Gene. 552:176–183.
- Basri DF, Tan LS, Shafiei Z, Zin NM. 2011. In vitro antibacterial activity of galls of Quercus infectoria Olivier against oral pathogens. Evid Based Complement Alternat Med. 2012:632796.
- Bhattacharjee SK. 2000. Handbook of medicinal plants.
- Cires E, Sanna M, Vázquez V, Fernández Prieto JA. 2018. Genetics and conservation of rare and endemic plants: the case of “Genista sanabrensis” (Fabaceae) in the Iberian Peninsula. Mediterr Bot. 39:77–87.
- Collard BCY, Mackill DJ. 2009. Conserved DNA-derived polymorphism (CDDP): a simple and novel method for generating DNA markers in plants. Plant Mol Biol Rep. 27:558.
- Conte L, Cotti C, Cristofolini G. 2007. Molecular evidence for hybrid origin of Quercus crenata Lam. (Fagaceae) from Q. cerris L. and Q. suber L. Plant Biosyst. 141:181–193.
- Dar M, Ikram M. 1979. Studies on Quercus infectoria; isolation of syringic acid and determination of its central depressive activity. Planta Med. 35:156–161.
- Debnath SC. 2008. Inter simple sequence repeat (ISSR) markers and pedigree information to assess genetic diversity and relatedness within Raspberry genotypes. Int J Fruit Sci. 7:1–17.
- de Riek J, Calsyn E, Gil Everaert I, Van Bockstaele E, de Loose M. 2001. Aflp based alternatives for the assessment of distinctness, uniformity and stability of sugar beet varieties. Theor Appl Genet. 103:1254–1265.
- Elham A, Arken M, Kalimanjan G, Arkin A, Iminjan M. 2021. A review of the phytochemical, pharmacological, pharmacokinetic, and toxicological evaluation of Quercus Infectoria galls. J Ethnopharmacol. 12:113592.
- Evanno G, Regnaut S, Goudet J. 2005. Detecting the number of clusters of individuals using the software STRUCTURE: A simulation study. Mol Ecol. 14:2611–2620.
- Ferrão LFV, Caixeta ET, Souza FdF, Zambolim EM, Cruz CD, Zambolim L, Sakiyama NS. 2013. Comparative study of different molecular markers for classifying and establishing genetic relationships in Coffea canephora. Plant Syst Evol. 299:225–238.
- Frankham R. 1995. Conservation genetics. Annu Rev Genet. 29:305–327.
- Griffiths G. 1993. Fine structure immunocytochemistry. Berlin: Springer Berlin Heidelberg. ISBN: 978-3-642-77097-5.
- Guest E, Townsend CC. 1966. Flora of Iraq. Baghdad, Ministry of Agriculture of the Republic of Iraq, Richmond, Surrey: Royal Botanic Gardens, KEW.
- Gupta PK, Varshney RK, Sharma PC, Ramesh B. 1999. Reviewmolecular markers and their applications in wheat breeding. Plant Breed. 118:369–390.
- Igwe DO, Ihearahu OC, Osano AA, Acquaah G, Ude GN. 2021. Genetic diversity and population assessment of Musa L. (Musaceae) employing CDDP markers. Plant Mol Biol Rep. 39:801–820.
- Ikram M, Nowshad F. 1977. Constituents of Quercus infectoria. Planta Med. 31:286–287.
- Jiajun Y, Shi-qie B, Xinquan Z, Dan C, Minghong Y, Changbing Z, Daxu L. 2010. Genetic diversity of native Elymus sibiricus populations in the Southeastern Margin of Qinghai-Tibetan Plateau as detected by SRAP and SSR markers. Acta Prataculturae Sci. 19:122–134.
- Khwarahm NR. 2020. Mapping current and potential future distributions of the oak tree (Quercus aegilops) in the Kurdistan Region, Iraq. Ecol Process. 9:56.
- Kumar A, Mishra P, Singh SC, Sundaresan V. 2014. Efficiency of ISSR and RAPD markers in genetic divergence analysis and conservation management of Justicia adhatoda L., a medicinal plant. Plant Syst Evol. 300:1409–1420.
- Kumar P, Gupta VK, Misra AK, Modi PB. 2009. Potential of molecular markers in plant biotechnology. Plant Omics. 2:141–162.
- Lim TK. 2012. Quercus infectoria. In: Lim TK, editor. Edible medicinal and non-medicinal plants. Dordrecht: Springer; p. 16–26.
- Liu H, Zang F, Wu Q, Ma Y, Zheng Y, Zang D. 2020. Genetic diversity and population structure of the endangered plant Salix taishanensis based on CDDP markers. Glob Ecol Conserv. 24:e01242.
- Loveless MD, Hamrick JL. 1984. Ecological determinants of genetic structure in plant populations. Annu Rev Ecol Syst. 15:65–95.
- Mahar KS, Rana TS, Ranade SA, Pande V, Palni LMS. 2013. Estimation of genetic variability and population structure in Sapindus trifoliatus L., using DNA fingerprinting methods. Trees. 27:85–96.
- Mayer F, editor. 1988. Electron microscopy in microbiology: volume 20. 1. Aufl. s.l.: Elsevier Textbooks. 431 p. (Methods in microbiology; v.20). ISBN: 0125215207.
- Mei Z, Zhang C, Khan MA, Zhu Y, Tania M, Luo P, Fu J. 2015. Efficiency of improved RAPD and ISSR markers in assessing genetic diversity and relationships in Angelica sinensis (Oliv.) Diels varieties of China. Electron J Biotechnol. 18:96–102.
- Mohammad-Panah N, Shabanian N, Khadivi A, Rahmani M-S, Emami A. 2017. Genetic structure of gall oak (Quercus infectoria) characterized by nuclear and chloroplast SSR markers. Tree Genet Genomes. 13:1–12.
- Pritchard JK, Stephens M, Donnelly P. 2000. Inference of population structure using multilocus genotype data. Genetics. 155:945–959.
- Rakshit S, Swapna M. 2015. DNA markers in diversity analysis. In: Madhusudhana R, Rajendrakumar P, Patil JV, editor. Sorghum molecular breeding. New Delhi: Springer; p. 23–46.
- Roldán-Ruiz I, Dendauw J, van Bockstaele E, Depicker A, de Loose M. 2000. AFLP markers reveal high polymorphic rates in ryegrasses (Lolium spp.). Mol Breed. 6:125–134.
- Schoen DJ, Brown AH. 1991. Intraspecific variation in population gene diversity and effective population size correlates with the mating system in plants. Proc Natl Acad Sci USA. 88:4494–4497.
- Slatkin M. 1987. Gene flow and the geographic structure of natural populations. Science. 236:787–792.
- Taib M, Rezzak Y, Bouyazza L, Lyoussi B. 2020. Medicinal uses, phytochemistry, and pharmacological activities of Quercus Species. Evid Based Complement Alternat Med. 2020:1920683.
- Talebi R, Nosrati S, Etminan A, Naji AM. 2018. Genetic diversity and population structure analysis of landrace and improved safflower (Cartamus tinctorious L.) germplasm using arbitrary functional gene-based molecular markers. Biotechnol Biotechnol Equip. 32:1183–1194.
- Tayel AA, El-Sedfy MA, Ibrahim AI, Moussa SH. 2018. Application of Quercus infectoria extract as a natural antimicrobial agent for chicken egg decontamination. Rev Argent Microbiol. 50:391–397.
- Torres-Ruiz JM, Kremer A, Carins Murphy MR, Brodribb T, Lamarque LJ, Truffaut L, Bonne F, Ducousso A, Delzon S. 2019. Genetic differentiation in functional traits among European sessile oak populations. Tree Physiol. 39:1736–1749.
- Zohary M. 1973. Geobotanical foundations of the Middle East. vol. 1 and 2. Stuttgart: Swets and Zeitlinger.