
Abstract
This study aimed to investigate ferroptosis-related molecular subtypes and their potential value in gastric adenocarcinoma (GAC). Gene expression and associated clinical phenotype data were downloaded from TCGA database. Unsupervised clustering was performed to identify suitable subtypes, followed by a correlation analysis of clinical factors. Gene set variation analysis, immune infiltration, and differentially expressed genes (DEGs) were investigated between subtypes, followed by functional enrichment for DEGs. Univariate Cox regression analysis was used to screen DEGs to construct a prognostic model. Of the 53 ferroptosis-related genes identified in GAC, two ferroptosis-related molecular subtypes were further examined. These two subtypes showed significant differences in the distribution of histological grades and KEGG pathways. In addition, tumor infiltration of 10 immune cells, including Tregs and natural killer cells, was significantly different between the two subtypes. A total of 660 DEGs were identified between these two subtypes and ultimately 12 genes associated with prognosis, including GPX3, SNCG, DUSP1, and FBN1, were selected by LASSO to construct a prognostic risk model. Survival analysis showed that this model had better prognostic value. Finally, regression analysis showed that the risk score was an independent prognostic indicator of GAC. In summary, two ferroptosis-related molecular subtypes that were associated with the histological grade and tumor immune infiltration were identified. The 12 gene-based risk model had an independent value for predicting GAC prognosis.
Introduction
Gastric adenocarcinoma (GAC), a common histological type of gastric cancer (GC), imposes a considerable global health burden (Ajani et al., Citation2017). Although the incidence rate of GAC is decreasing globally, it still accounts for 10% of all cancer-associated deaths (Dicken et al., Citation2005). Endoscopy detection and limited surgical intervention are the gold standards for diagnosis and clinical treatment of GAC, respectively (Banks et al., Citation2019). Although significant improvements have been achieved in the clinical treatment of GAC, the median survival time for late-stage patients is still only 9 months (Correa, Citation2013).
The discovery of ferroptosis, a type of nonapoptotic cell death characterized by the iron-dependent accumulation of regulatory lipid peroxides, presented a new breakthrough in tumor therapy (Nie et al., Citation2018). A recent study showed that ferroptosis sensitivity in GC is closely associated with certain pathways, such as polyunsaturated fatty acid biosynthesis (Lee et al., Citation2020). Angeli et al. indicated that ferroptosis plays a vital role in acquired drug resistance and immune evasion during cancer progression (Angeli et al., Citation2019). Although ferroptosis has become the focus of etiology research and treatment as an intervention method in the occurrence and development of cancer and related diseases, its molecular mechanism remains unclear (Li et al., Citation2020). Some differentially expressed genes (DEGs), such as histone acetyltransferase KAT2B, are important for the biological function of ferroptosis in cancer progression due to suppressing glutathione synthesis (Zhang et al., Citation2019). The ferroptosis potential index indicates the functional roles of ferroptosis and is higher in tumor samples than that in normal samples and is closely associated with subtypes and clinical features (Liu et al., Citation2020b). It has been proved that GPX4 participates in ferroptosis during cancer progression, providing novel insights into its pharmacological implications (Seibt et al., Citation2019). Biomarkers associated with ferroptosis can be used to predict the prognosis of hepatocellular carcinoma (Liang et al., Citation2020). However, the ferroptosis-related molecular subtypes and corresponding markers in the GAC remain unclear.
Thus, this study aimed to identify ferroptosis-associated molecular subtypes of GAC using The Cancer Genome Atlas (TCGA) data sets and investigate the differences between subtypes based on a clinical factor correlation analysis, gene set variation analysis (GSVA), and immune infiltration analysis. In addition, the study proposed to screen DEGs between subtypes involved in prognosis and establish a prognostic risk model. This study provided new insights into the potential of ferroptosis-based cancer therapy in GAC.
Materials and methods
A flow chart of the analytical process is shown in Supplementary Figure 1.
Microarray data and preprocessing
RNA-seq data from 407 samples of stomach adenocarcinoma (STAD) (including 375 tumor samples) from TCGA were downloaded from UCSC-Xena (http://xena.ucsc.edu/) (Tomczak et al., Citation2015). Reannotation of RNA-seq data in TCGA-STAD was performed based on the annotation information (gencode.v22) in UCSC-Xena. Clinical data and survival information were compared with RNA-seq data to collect the corresponding clinical phenotype data and survival information from the 375 tumor samples. A total of 60 ferroptosis-related genes (FRGs) (Supplementary Table 1) were obtained from the results of a previous study (Liang et al., Citation2020). Finally, the FRGs were matched with the TCGA-STAD data set, and the expression data of FRGs with fragments per kilobase million (FPKM) > 1 in at least half of the samples were used to construct the expression matrix.
Unsupervised cluster analysis
To divide the GAC samples into suitable subtypes, an unsupervised cluster analysis was performed using the NMF package (version: 0.23.0) in R software based on the FRG expression matrix. Heat maps of clinical factor subtypes such as age (65 years or older vs. younger than 65 years), clinical stage (stages I–II vs. stages III–IV), and tumor grade were constructed. The differences between the subtypes in terms of the individual tumor grade, gender ratio, age distribution, and clinical stage were investigated.
Gene set variation analysis
Based on the enrichment background (c2.cp.kegg.v7.1.symbols.gmt) in the GSEA database (Liberzon et al., Citation2011), the enrichment scores of each Kyoto Encyclopedia of Genes and Genomes (KEGG) pathway between two subtypes were calculated to obtain a scoring matrix using the GSVA algorithm (version: 1.36.2) in R (Hänzelmann et al., Citation2013). Finally, a P value <0.05, was considered a statistically significant difference.
Immune infiltration analysis between subtypes
An immune infiltration analysis was performed based on the calculation method described by Newman et al. (Newman et al., Citation2015). Briefly, the immune cell gene expression data in ImmGen were used as a reference to determine the weight associated with the specificity of gene expression in different immune cell subtypes. These gene weights were distributed in the sequencing gene expression profile of each patient and were subsequently used to calculate the immune infiltration score of each patient. In this study, 22 types of reference cells were used to calculate the infiltration scores of all samples between two GAC subtypes using the CIBERSORT algorithm (Newman et al., Citation2015). Differences between the two subtypes were considered significant at P < 0.05.
DEG investigation between two subtypes
DEGs between the two groups were analyzed using empirical Bayesian methods (Wickham et al., Citation2016) in the limma package (version: 3.44.3) in R. Cutoff values for DEG exploration were P < 0.05 and |log2 fold change (FC)| > 1.
Enrichment analysis based on DEGs
Gene Ontology-biological process (GO-BP) function (Ashburner et al., Citation2000) and KEGG pathway (Kanehisa & Goto, Citation2000) analyses were performed on DEGs between the two subtypes using Metascape software (Zhou et al., Citation2019) with the parameters P < 0.01 and count ≥ 3. Furthermore, a principal component analysis (PCA) is a type of an unsupervised analysis method that can be used to observe the overall distribution, natural aggregation, and discrete points of samples (Abdi & Williams, Citation2010). A PCA was performed to determine whether these DEGs differed significantly between the two subtypes.
Prognostic model analysis
A univariate Cox regression analysis was used to determine the relationship between DEGs and prognosis of patients with GAC, with a cutoff value of P < 0.01. DEGs associated with GAC prognosis were further fitted into a LASSO regression analysis to obtain GAC prognostic genes. Multivariate regression (coxph) was used to examine the effect of these genes on survival, and the prognostic correlation coefficient β was obtained. The coefficient calculated by Cox regression was used as the weight, and prediction models based on prognostic genes were constructed based on the linear combination of prognostic genes.
TCGA-STAD tumor samples were randomly divided into a test set and a validation set, and the risk score of each patient was calculated. In each data set, the optimal thresholds determined by the Survival package divided all patients enrolled in the current study into high-risk and low-risk groups. A Kaplan-Meier (K-M) curve was used for overall survival (OS) analysis of the two groups, followed by a log-rank test.
Independence exploration based on the prognostic model
Univariate regression was performed to test the possibility of an independent prognostic model based on other clinical variables (such as age, gender, and clinical staging). Variables with P < 0.05 in the univariate regression analysis were included in a multivariate Cox regression analysis. Finally, variables with P < 0.05 in the multivariate analysis were considered independent prognostic factors.
Results
Investigation for two ferroptosis-related molecular subtypes of GAC
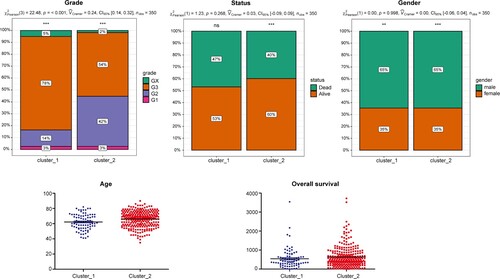
Among the 60 FRGs, 53 were expressed in TCGA-STAD data set with FPKM > 1 in at least half of the samples. Unsupervised clustering of GAC samples was performed based on these 53 FRGs using NMF software, and a cophenetic coefficient of 2–10 clusters was obtained. All samples were divided into two subtypes based on the optimal cophenetic coefficient (Figure ): 82 and 293 samples in Clusters 1 and 2, respectively. Most histological grade 2 samples were grouped in Cluster 2, while Cluster 1 contained more histological grade 3 samples (Figure B). Confirming this, Figure shows that the distribution of histological grades was significantly different between the two subtypes. Cluster 1 contained 78% of histological grade 3 samples and 14% of histological grade 2 samples, while Cluster 2 included 54% of histological grade 3 samples and 42% of histological grade 2 samples (P < 0.001). Age, sex, and OS between the two subtypes were not statistically different.
Figure 1. Unsupervised cluster analysis A, Cophenetic coefficient for selecting the optimal NMF rank in cluster analysis; B, heat map of the two molecular subtypes using the 53 ferroptosis-related genes (FRGs).
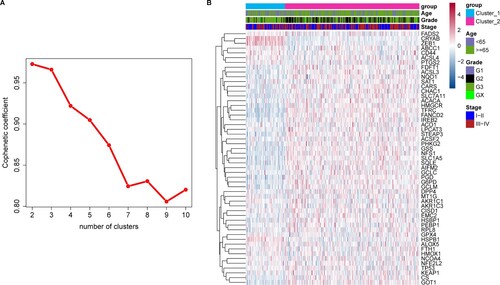
Figure 2. Correlation between clinical factors and gastric adenocarcinoma (GAC) subtypes. Clinical factors included AJCC tumor grade, age, sex, overall survival (OS) time, and status. The x-axis represents different groups (subtypes) and the y-axis different values for each clinical factor.
GSVA
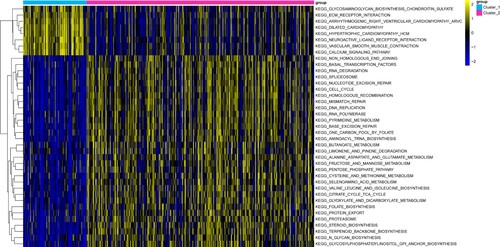
GSVA was performed to investigate the differences in the KEGG pathways between the two subtypes. Results showed 39 KEGG pathways with P < 0.05. Samples from Cluster 1 were primarily enriched in pathways such as extracellular matrix (ECM) receptor interactions and calcium signaling pathways. Meanwhile, samples from Cluster 2 were primarily enriched in pathways such as cell cycle and DNA replication. Figure shows a heat map for GSVA enrichment analysis.
Figure 3. Heat map of gene set enrichment analysis (GSVA). The different colors in the top bar represent different gastric adenocarcinoma (GAC) subtypes.
Immune infiltration analysis
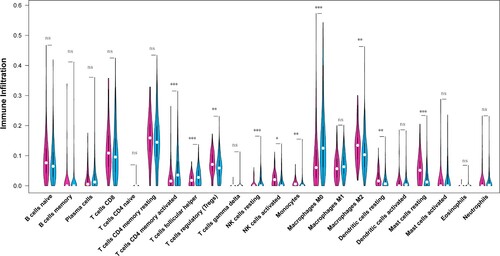
Results of the immune infiltration analysis for the two GAC subtypes (Figure ) showed a significant difference in the infiltration abundance of the following 10 immune cells: activated memory CD4 T cells, helper follicular T cells, regulatory T cells (Tregs), resting natural killer (NK) cells, activated NK cells, monocytes, macrophages M0, macrophages M2, resting dendritic cells, and resting mast cells.
Figure 4. Immune infiltration analysis in two gastric adenocarcinoma (GAC) subtypes. The x-axis represents different immune cells selected based on previous literature and the y-axis represents the different levels of immune infiltration. Different colors represent different gastric adenocarcinoma (GAC) subtypes.
DEGs between two subtypes
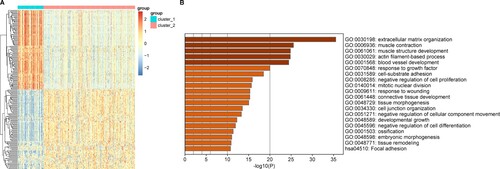
A total of 660 DEGs (including 599 upregulated and 101 downregulated genes) were identified between the two GAC subtypes. A heat map of the Top100 upregulated DEGs and the Top100 downregulated DEGs is shown in Figure A. Results showed that these genes could be well separated into two groups (subtypes). The enrichment analysis showed that these DEGs were mainly involved in GO-BP functions and KEGG pathways such as ECM organization (GO:0030198) and focal adhesion (hsa04510) pathways, respectively. The Top20 items for the GO-BP and KEGG pathways are shown in Figure B. Furthermore, PCA of all 660 DEGs between the two GAC subtypes showed that the two subtypes could be significantly separated based on DEGs (Supplementary Figure 2).
Figure 5. Investigation of differentially expressed genes (DEGs) between two gastric adenocarcinoma (GAC) subtypes. A, Top20 results of enrichment analysis for differentially expressed genes (DEGs) between the two subtypes. The x-axis represents the P value and the y-axis the different functions or pathways enriched by DEGs. P < 0.05 was selected as the cutoff value for this enrichment analysis. B, Heat map for the Top100 upregulated genes and the Top100 downregulated genes between two gastric adenocarcinoma (GAC) subtypes.
Prognostic risk model
Seventy GAC prognostic genes were identified from the 660 DEGs between the two subtypes. Subsequently, the LASSO regression analysis identified 12 genes to be of prognostic value: glutathione peroxidase 3 (GPX3), GJA1, APOD, CNTN1, synuclein gamma (SNCG), RGS2, dual specificity phosphatase 1 (DUSP1), PRR15L, RAMP1, NGFRAP1, fibrillin 1 (FBN1), and HTRA3 (Figure A). These 12 genes were used to construct a prognostic risk model that was then used to calculate risk scores for all samples.
Figure 6. LASSO regression and Kaplan-Meier (K-M) survival analysis for prognostic feature genes of gastric adenocarcinoma (GAC) subtypes. A, LASSO regression analysis showed 12 feature genes. The x-axis represents the value of log(λ) and the y-axis the value of partial likelihood deviance. B, Survival analysis of the two subgroups stratified based on the median risk scores. C, Validation of the prognostic risk feature genes. The x-axis represents survival time (days) and the y-axis survival probability. The red line represents the high-risk group and the blue line the low-risk group.
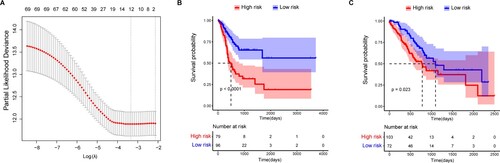
In the test set, 175 patients were enrolled in either the low-risk group (n = 96) or the high-risk group (n = 79), based on the optimal cutoff value. The OS time of patients in the low-risk group was significantly higher than that in the high-risk group (P < 0.001) (Figure B). Similar results were found in the validation set, and the distribution of OS status based on the K-M analysis showed that the OS time of the high-risk group was significantly lower than that of the low-risk group (P = 0.023) (Figure C).
The univariate regression analysis showed that clinical factors, including age (HR = 1.5653, 95% confidence interval [CI] [1.1132–2.2009], P < 0.01), tumor stage (HR = 1.8025, 95%CI [1.2657–2.5671], P < 0.05), and risk score (HR = 1.7935, 95% CI [1.3391-2.4021], P < 0.001) were significantly associated with prognosis (Table ). Moreover, the multivariate regression analysis based on age, stage, and risk score showed that the risk score (HR = 1.7751, 95% CI [1.305–2.415], P < 0.001) could be used as an independent prognostic indicator for GAC (Table ).
Table 1. Univariate Cox regression analysis based on risk score and clinical characteristics of GAC
Table 2. Multivariate Cox regression analysis based on risk score and clinical characteristics of GAC.
Discussion
Although ferroptosis is related to the development of GAC, the underlying molecular mechanism remains unclear. In this study, two molecular subtypes of GAC were identified based on 53 FRGs. These two subtypes were significantly different in terms of histological grade, KEGG pathways, and tumor-infiltrating immune cells. Cluster 1 subtype contained a higher proportion of high-grade tumors (histological grade 3) than Cluster 2 subtype. Correct identification of histological grades facilitates the development of individualized treatment strategies that help to improve patient outcomes (Dias et al., Citation2017). Kwong et al. suggested that pathological downstaging was detected after neoadjuvant therapy and resection in approximately 52.9% of low-grade (grade 1/2) tumors, in comparison with approximately 22.2% of high-grade (grade 3) tumors, indicating that high-grade GC does not respond to neoadjuvant therapy (Kwong et al., Citation2019). Meanwhile, the immune infiltration analysis showed that the infiltration abundance of 10 immune cells, including Tregs and NK cells, was significantly different between the two GAC subtypes. NK cells are closely related to immunosurveillance (Pernot et al., Citation2020), and the increase in NK cell number plays a vital role in GAC progression (Rosso et al., Citation2012). Elevated NC cell density is observed in patients with GAC and can be used as a marker for positive outcomes of GAC (Kang et al., Citation2017). In contrast, Tregs are associated with the progression of different cancer subtypes (Zou, Citation2006). An increasing number of Tregs have been found in peripheral blood and tumor-infiltrating lymphocytes in patients with GC (Ichihara et al., Citation2003). Thus, we speculated that the difference in tumor infiltration of immune cells between the two ferroptosis-associated subtypes might be associated with the differences in histological grade.
We further investigated the DEGs between the two subtypes and identified 660 DEGs that were primarily related to ECM organization and focal adhesion pathways. During GC progression, ECM organization correlates with a mesenchymal phenotype (Peng et al., Citation2014). The ECM is a dynamic tissue structure with a well-organized environment (Walker et al., Citation2018). Moreira et al. indicated that variations in the ECM contribute to the development of GC (Moreira et al., Citation2020). Different subtypes of cancers are generated based on the variation of genes associated with the ECM (Luo et al., Citation2019). Focal adhesion plays a vital role in the development of various human diseases, including GC (Yang et al., Citation2007) and contributes to the effect of a molecular subtype on outcomes in ovarian cancer (Pils et al., Citation2012). The signature role of ferroptosis-associated genes in the development of gliomas is closely related to focal adhesion (Liu et al., Citation2020a). The upregulation of kinases in focal adhesion is not only commonly explored in primary tumors but also associated with poor clinical outcomes, indicating that focal adhesion kinases can be used as a prognostic marker and anticancer target (Tai et al., Citation2015). Thus, we speculated that the DEGs might be involved in ECM organization and focal adhesion in GAC.
Among the DEGs, 70 genes associated with prognosis were further identified, and 12 genes, including GPX3, GJA1, APOD, CNTN1, SNCG, RGS2, DUSP1, PRR15L, RAMP1, NGFRAP1, FBN1 and HTRA3, were identified as feature genes for GAC using LASSO. Moreover, this 12 gene-based prognosis risk model was found to predict OS rates in GAC and the risk score to be an independent prognostic indicator for GAC, confirming the prognostic value of these genes. Of which, GPX3, APOD, RGS2 and HTRA3 were reported to act as tumor suppressors in many tumors (Utsunomiya et al., Citation2005; Lyu et al., Citation2015; Wenta et al., Citation2018; Nirgude & Choudhary, Citation2021), while CNTN1, SNCG, FBN1 and RAMP1 were reported to promote tumorigenesis (Logan et al., Citation2013; Gu et al., Citation2020; van Loon et al., Citation2020; Zhang et al., Citation2020). GJA1, DUSP1 had an ambiguous role in different tumors, acting as both a tumor suppressor and tumor promoter (Shen et al., Citation2016; Hu et al., Citation2020; Niu et al., Citation2021). Less study reported the roles of PRR15L and NGFRAP1 in cancer development.
GPX3 is an inhibitor of ferroptotic cell death and an important target for ferroptosis-based cancer therapy (Chang et al., Citation2020). A previous gene expression cluster analysis reported two distinct subtypes of high-grade serous adenocarcinomas that were specifically separated into clusters based on GPX3 expression (Worley et al., Citation2019). Moreover, SNCG, a marker for adverse and aggressive diseases, is closely associated with different subtypes of human cancer (Mhawech-Fauceglia et al., Citation2012). The upregulation of SNCG in tumor tissue contributes to the progression of GAC by participating in tumorigenesis, progression, infiltration, and metastasis (Zheng et al., Citation2014). SNCG contributes to tumor metastasis and can be used as a biomarker in GAC gene therapy (Li-fang et al., Citation2011). In addition, DUSP1 is a novel inhibitor of ferroptosis in different types of human cancer cells (Xie et al., Citation2020). Downregulation of DUSP1, which is considered a biomarker for different subtypes of breast cancer, has been identified in one basal subtype of breast cancer (Liu et al., Citation2018). In GC, DUSP1 induces apatinib resistance by activating the MAPK pathway (Teng et al., Citation2018). Furthermore, overexpression of the FBN1 gene plays a role in the proliferation and invasion caused by GC (Yang et al., Citation2017). Based on a bioinformatics investigation, the prognostic value of FBN1 in GC has been identified (Shen et al., Citation2020). In this study, GPX3, SNCG, DUSP1, and FBN1 were not only FRGs found in both subtypes but also novel feature genes for GAC. Thus, we speculated that FRGs, including GPX3, SNCG, DUSP1, and FBN1 could be novel biomarkers for different subtypes of GAC.
In conclusion, we identified two molecular subtypes of GAC based on FRGs, and these two subtypes were associated with histological grade and tumor-infiltrating immune cells. The DEGs between these two subtypes were involved in ECM organization and focal adhesion. Twelve prognostic genes (such as GPX3, SNCG, DUSP1, and FBN1) were identified, and a prognostic risk model established with these 12 genes could predict the OS of patients with GAC. The risk score may be an independent prognostic indicator of GAC.
Authors’ contributions
Conception and design of the research: GJ, WL; acquisition of data: LL, ZL, LW; analysis and interpretation of data: WW, XW, YH; statistical analysis: WW, YH; drafting the manuscript: WL; revision of the manuscript for important intellectual content: XW, LW. All authors read and approved the final manuscript.
Conflicts of interest
The authors declare that they have no conflicts of interest.
Disclosure statement
No potential conflict of interest was reported by the author(s).
Data availability statement
The RNAseq data and clinical phenotype data of stomach adenocarcinoma (STAD) analyzed in this study is available publicly from The Cancer Genome Atlas (TCGA) database at https://xenabrowser.net/.
References
- Abdi H, Williams LJ. 2010. Principal component analysis. Wiley Interdisciplinary Rev: Comput Stat. 2:433–459.
- Ajani JA, Lee J, Sano T, Janjigian YY, Fan D, Song S. 2017. Gastric adenocarcinoma. Nat Rev Dis Primers. 3:1–19.
- Angeli JPF, Krysko DV, Conrad M. 2019. Ferroptosis at the crossroads of cancer-acquired drug resistance and immune evasion. Nat Rev Cancer. 19:405–414.
- Ashburner M, Ball CA, Blake JA, Botstein D, Butler H, Cherry JM, Davis AP, Dolinski K, Dwight SS, Eppig JT, et al. 2000. Gene Ontology: tool for the unification of biology. Nat Genet. 25:25–29.
- Banks M, Graham D, Jansen M, Gotoda T, Coda S, Di Pietro M, Uedo N, Bhandari P, Pritchard DM, Kuipers EJ. 2019. British society of Gastroenterology guidelines on the diagnosis and management of patients at risk of gastric adenocarcinoma. Gut. 68:1545–1575.
- Chang C, Worley BL, Phaëton R, Hempel N. 2020. Extracellular glutathione peroxidase GPx3 and its role in cancer. Cancers (Basel). 12:2197.
- Correa P. 2013. Gastric cancer: overview. Gastroenterol Clin North Am. 42:211.
- Dias AR, Azevedo BC, Alban LBV, Yagi OK, Ramos M, Jacob CE, Barchi LC, Cecconello I, Ribeiro U, Jr., Zilberstein B. 2017. Gastric neuroendocrine tumoe: review and update. Arquivos Brasileiros de Cirurgia Digestiva: ABCD = Brazilian Archives of Digestive Surgery. 30:150–154.
- Dicken BJ, Bigam DL, Cass C, Mackey JR, Joy AA, Hamilton SM. 2005. Gastric adenocarcinoma: review and considerations for future directions. Ann Surg. 241:27.
- Gu Y, Li T, Kapoor A, Major P, Tang D. 2020. Contactin 1: An important and Emerging oncogenic protein promoting cancer progression and metastasis. Genes (Basel). 11:874.
- Hänzelmann S, Castelo R, Guinney J. 2013. GSVA: gene set variation analysis for microarray and RNA-seq data. BMC Bioinformatics. 14:7.
- Hu W, Li S, Zhang S, Xie B, Zheng M, Sun J, Yang X, Zang L. 2020. GJA1 is a prognostic biomarker and correlated with immune infiltrates in colorectal cancer. Cancer Manag. Res. 12:11649–11661.
- Ichihara F, Kono K, Takahashi A, Kawaida H, Sugai H, Fujii H. 2003. Increased populations of regulatory T cells in peripheral blood and tumor-infiltrating lymphocytes in patients with gastric and esophageal cancers. Clin Cancer Res. 9:4404–4408.
- Kanehisa M, Goto S. 2000. KEGG: Kyoto Encyclopedia of Genes and genomes. Nucleic Acids Res. 28:27–30.
- Kang BW, Kim JG, Lee IH, Bae HI, Seo AN. 2017. Clinical significance of tumor-infiltrating lymphocytes for gastric cancer in the era of immunology. World J Gastrointest Oncol. 9:293.
- Kwong MLM, Denham L, Selleck MJ, Kim C, Kunihira K, Kubba R, Rojas R, Garberoglio C, Senthil M. 2019. Response to neoadjuvant treatment Is influenced by grade in gastric cancer. Am Surg. 85:1419–1422.
- Lee J-Y, Nam M, Son HY, Hyun K, Jang SY, Kim JW, Kim MW, Jung Y, Jang E, Yoon S-J. 2020. Polyunsaturated fatty acid biosynthesis pathway determines ferroptosis sensitivity in gastric cancer. Proc Natl Acad Sci USA. 117:32433–32442.
- Li J, Cao F, Yin H-L, Huang Z-J, Lin Z-T, Mao N, Sun B, Wang G. 2020. Ferroptosis: past, present and future. Cell Death Dis. 11:1–13.
- Liang J-Y, Wang D-S, Lin H-C, Chen X-X, Yang H, Zheng Y, Li Y-H. 2020. A novel ferroptosis-related gene signature for overall survival prediction in patients with hepatocellular carcinoma. Int J Biol Sci. 16:2430.
- Liberzon A, Subramanian A, Pinchback R, Thorvaldsdóttir H, Tamayo P, Mesirov JP. 2011. Molecular signatures database (MSigDB) 3.0. Bioinformatics. 27:1739–1740.
- Li-fang SHI, Shu-fang2A ZHENG, Yong-gang ZHAO, Jian-wei WANG, Xiao-hong ZHAN. 2011. Expressions of SNCG in gastric adenocarcinoma and its clinical significances. Prog Mod Biomed. 11:1532–1535.
- Liu H-J, Hu H-M, Li G-Z, Zhang Y, Wu F, Liu X, Wang K-Y, Zhang C-B, Jiang T. 2020a. Ferroptosis-related gene signature predicts glioma cell death and glioma patient progression. Front Cell Dev Biol. 8:538.
- Liu T, Sun H, Liu S, Yang Z, Li L, Yao N, Cheng S, Dong X, Liang X, Chen C. 2018. The suppression of DUSP5 expression correlates with paclitaxel resistance and poor prognosis in basal-like breast cancer. Int J Med Sci. 15:738.
- Liu Z, Zhao Q, Zuo Z-X, Yuan S-Q, Yu K, Zhang Q, Zhang X, Sheng H, Ju H-Q, Cheng H. 2020b. Systematic analysis of the aberrances and functional implications of ferroptosis in cancer. Iscience. 23:101302.
- Logan M, Anderson PD, Saab ST, Hameed O, Abdulkadir SA. 2013. RAMP1 is a direct NKX3.1 target gene up-regulated in prostate cancer that promotes tumorigenesis. Am J Pathol. 183:951–963.
- Luo Z, Wang W, Li F, Songyang Z, Feng X, Xin C, Dai Z, Xiong Y. 2019. Pan-cancer analysis identifies telomerase-associated signatures and cancer subtypes. Mol Cancer. 18:1–15.
- Lyu JH, Park DW, Huang B, Kang SH, Lee SJ, Lee C, Bae YS, Lee JG, Baek SH. 2015. RGS2 suppresses breast cancer cell growth via a MCPIP1-dependent pathway. J Cell Biochem. 116:260–267.
- Mhawech-Fauceglia P, Wang D, Syriac S, Godoy H, Dupont N, Liu S, Odunsi K. 2012. Synuclein-γ (SNCG) protein expression is associated with poor outcome in endometrial adenocarcinoma. Gynecol Oncol. 124:148–152.
- Moreira AM, Pereira J, Melo S, Fernandes MS, Carneiro P, Seruca R, Figueiredo J. 2020. The extracellular matrix: an accomplice in gastric cancer development and progression. Cells. 9:394.
- Newman AM, Liu CL, Green MR, Gentles AJ, Feng W, Xu Y, Hoang CD, Diehn M, Alizadeh AA. 2015. Robust enumeration of cell subsets from tissue expression profiles. Nat Methods. 12:453–457.
- Nie J, Lin B, Zhou M, Wu L, Zheng T. 2018. Role of ferroptosis in hepatocellular carcinoma. J Cancer Res Clin Oncol. 144:2329–2337.
- Nirgude S, Choudhary B. 2021. Insights into the role of GPX3, a highly efficient plasma antioxidant, in cancer. Biochem. Pharmacol. 184:114365.
- Niu G, Zhang X, Hong R, Yang X, Gu J, Song T, Hu Z, Chen L, Wang X, Xia J, et al. 2021. GJA1 promotes hepatocellular carcinoma progression by mediating TGF-β-induced activation and the epithelial-mesenchymal transition of hepatic stellate cells. Open Medicine (Warsaw, Poland). 16:1459–1471.
- Peng Z, Wang C-X, Fang E-H, Wang G-B, Tong Q. 2014. Role of epithelial-mesenchymal transition in gastric cancer initiation and progression. World J Gastroenterol. 20:5403.
- Pernot S, Terme M, Radosevic-Robin N, Castan F, Badoual C, Marcheteau E, Penault-Llorca F, Bouche O, Bennouna J, Francois E. 2020. Infiltrating and peripheral immune cell analysis in advanced gastric cancer according to the lauren classification and its prognostic significance. Gastric Cancer. 23:73–81.
- Pils D, Hager G, Tong D, Aust S, Heinze G, Kohl M, Schuster E, Wolf A, Sehouli J, Braicu I. 2012. Validating the impact of a molecular subtype in ovarian cancer on outcomes: a study of the OVCAD consortium. Cancer Sci. 103:1334–1341.
- Rosso D, Rigueiro MP, Kassab P, Ilias EJ, Castro O, Novo NF, Lourenço LG. 2012. Correlation of natural killer cells with the prognosis of gastric adenocarcinoma. Arquivos Brasileiros de Cirurgia Digestiva: ABCD = Brazilian Archives of Digestive Surgery. 25:114–117.
- Seibt TM, Proneth B, Conrad M. 2019. Role of GPX4 in ferroptosis and its pharmacological implication. Free Radical Biol Med. 133:144–152.
- Shen H, Wang L, Chen Q, Xu J, Zhang J, Fang L, Wang J, Fan W. 2020. The prognostic value of COL3A1/FBN1/COL5A2/SPARC-mir-29a-3p-H19 associated ceRNA network in gastric cancer through bioinformatic exploration. J Cancer. 11:4933.
- Shen J, Zhang Y, Yu H, Shen B, Liang Y, Jin R, Liu X, Shi L, Cai X. 2016. Role of DUSP1/MKP1 in tumorigenesis, tumor progression and therapy. Cancer Med. 5:2061–2068.
- Tai Y-L, Chen L-C, Shen T-L. 2015. Emerging roles of focal adhesion kinase in cancer. BioMed Res Int. 2015:690690.
- Teng F, Xu Z, Chen J, Zheng G, Zheng G, Lv H, Wang Y, Wang L, Cheng X. 2018. DUSP1 induces apatinib resistance by activating the MAPK pathway in gastric cancer. Oncol Rep. 40:1203–1222.
- Tomczak K, Czerwińska P, Wiznerowicz M. 2015. The Cancer Genome Atlas (TCGA): an immeasurable source of knowledge. Contemp Oncol. 19:A68.
- Utsunomiya T, Ogawa K, Yoshinaga K, Ohta M, Yamashita K, Mimori K, Inoue H, Ezaki T, Yoshikawa Y, Mori M. 2005. Clinicopathologic and prognostic values of apolipoprotein D alterations in hepatocellular carcinoma. Int J Cancer. 116:105–109.
- Van Loon K, Yemelyanenko-Lyalenko J, Margadant C, Griffioen AW, Huijbers EJM. 2020. Role of fibrillin-2 in the control of TGF-β activation in tumor angiogenesis and connective tissue disorders. Biochimica et Biophysica Acta. Reviews on Cancer. 1873:188354.
- Walker C, Mojares E. 2018. Del Río hernández A. 2018.role of extracellular matrix in development and cancer progression. Int J Mol Sci. 19:3028.
- Wenta T, Zurawa-Janicka D, Rychlowski M, Jarzab M, Glaza P, Lipinska A, Bienkowska-Szewczyk K, Herman-Antosiewicz A, Skorko-Glonek J, Lipinska B. 2018. Htra3 is a cellular partner of cytoskeleton proteins and TCP1α chaperonin. J Proteomics. 177:88–111.
- Wickham H, Chang W, Wickham MH. 2016. Package ‘ggplot2’. create elegant data visualisations using the grammar of graphics. Version. 2:1–189.
- Worley BL, Kim YS, Mardini J, Zaman R, Leon KE, Vallur PG, Nduwumwami A, Warrick JI, Timmins PF, Kesterson JP. 2019. GPx3 supports ovarian cancer progression by manipulating the extracellular redox environment. Redox Biol. 25:101051.
- Xie Y, Kuang F, Liu J, Tang D, Kang R. 2020. DUSP1 blocks autophagy-dependent ferroptosis in pancreatic cancer. J Pancreatology. 3:154–160.
- Yang D, Zhao D, Chen X. 2017. MiR-133b inhibits proliferation and invasion of gastric cancer cells by up-regulating FBN1 expression. Cancer Biomark. 19:425–436.
- Yang S, Shin J, Park KH, Jeung H-C, Rha SY, Noh SH, Yang WI, Chung HC. 2007. Molecular basis of the differences between normal and tumor tissues of gastric cancer. Biochimica et Biophysica Acta (BBA)-Molecular Basis of Disease. 1772:1033–1040.
- Zhang J, Liu XH, Li C, Wu XX, Chen YL, Li WW, Li X, Gong F, Tang Q, Jiang D. 2020. SNCG promotes the progression and metastasis of high-grade serous ovarian cancer via targeting the PI3K/AKT signaling pathway. J Exp Clin Cancer Res. 39:79.
- Zhang X, Du L, Qiao Y, Zhang X, Zheng W, Wu Q, Chen Y, Zhu G, Liu Y, Bian Z. 2019. Ferroptosis is governed by differential regulation of transcription in liver cancer. Redox Biol. 24:101211.
- Zheng S, Shi L, Zhang Y, He T. 2014. Expression of SNCG, MAP2, SDF-1 and CXCR4 in gastric adenocarcinoma and their clinical significance. Int J Clin Exp Pathol. 7:6606.
- Zhou Y, Zhou B, Pache L, Chang M, Khodabakhshi AH, Tanaseichuk O, Benner C, Chanda SK. 2019. Metascape provides a biologist-oriented resource for the analysis of systems-level datasets. Nat Commun. 10:1523.
- Zou W. 2006. Regulatory T cells, tumour immunity and immunotherapy. Nat Rev Immunol. 6:295–307.