
Abstract
Previous studies have suggested that pituitary tumor transforming gene family serves as an oncogene in human cancers. However, the underlying molecular mechanisms of pituitary tumor transforming gene (PTTG) family in gastric cancer are unclear. This study aimed to explore the expression patterns, biological functions, and potential regulatory mechanism of PTTG family in gastric cancer cells. Results showed that the genes of PTTG family were highly expressed in gastric cancer tissues and correlated with low survival outcomes. Further, it was noted that regulation of the PTTG3P expression was associated with miR-129-5p and miR-383-5p. A PTTG3P-miRNA-mRNA regulatory network was established. In addition, results of the functional network analysis revealed that PTTG3P was enriched in transcription and cell signaling pathways. Moreover, results of the LinkedOmics and gene chip technology revealed that PTTG3P was positively correlated with PTTG2, whereas PTTG3P expression was not significantly correlated with PTTG1 expression. In conclusion, these results show that genes of the PTTG family promotes the occurrence and development of gastric cancer with PTTG3P regulating the transcription and cell signaling pathways. PTTG3P has an oncogenic role in gastric cancer by regulating the parental gene PTTG2.
KEYWORDS:
Introduction
In China, gastric cancer is one of the common causes of deaths due to malignant cancers. Statistically, the annual number of new cases and deaths due to this cancer in China accounts for about half of the global numbers. Therefore, there is a need to develop new preventive and treatment strategies for this cancer (Cai et al. Citation2019). The current therapeutic options for gastric cancer include surgery, chemotherapy, radiotherapy, and molecular targeted therapy. However, due to the low rate of early diagnosis, 50% of patients with gastric cancer are diagnosed while in advanced stages hence manifest poor treatment effects, high recurrence rates, and high mortality rates (Correa Citation2013; Karimi et al. Citation2014; Katai et al. Citation2018). Therefore, understanding the molecular mechanisms of gastric cancer, identifying reliable biomarkers, and developing effective therapeutic targets are crucial for gastric cancer treatment.
Pituitary tumor transforming gene (PTTG) family has been linked to the occurrence and development of many types of cancers. For instance, PTTG1 was found to be abnormally expressed and it high expression promoted the growth and metastasis of tumor tissues (Noll et al. Citation2015; Lin et al. Citation2019; Shih et al. Citation2020). The pituitary tumor transforming gene-2 (PTTG2) has also been shown to promote proliferation and invasion of glioblastoma and hence it is an indicator of poor prognosis (Guo et al. Citation2016). Pituitary tumor transforming gene-3 (PTTG3) is a newly identified long non-coding RNA (lncRNA) with carcinogenic effects. Long non-coding RNAs (LncRNAs) are non-coding RNA molecules with a length of more than 200 nucleotides expressed in different body fluids. They participate in cell cycle regulation, cell proliferation, human angiogenesis, and cell apoptosis (Khorkova et al. Citation2015; Zheng et al. Citation2015; Liu et al. Citation2018). Some previous studies have also reported that PTTG3P promotes the occurrence and development of gastric tumors (Weng et al. Citation2017). Currently, it is not known whether PTTG1 and PTTG2 are involved in the progression of gastric cancer.
In the current study, UALCAN, Kaplan-Meier, and Oncomine databases as well as gene chip technology were used to evaluate the expression levels of PTTG family in tumor and normal tissues. The Kaplan-Meier Potter database was used to determine the expression levels of the PTTG family, the clinico-pathological features of gastric cancer (grade, stage, sex, and age among others) and the prognosis of patients. In addition, miRNet database was used to identify miRNA target genes and the potential miRNAs that bind PTTG. Further, the Starbase database was analyzed to detect the expression levels of miRNAs in gastric cancer cells. Linkedomics was used to determine differentially expressed genes that were associated with PTTG3P, whereas GSEA was used to analyze the GO (CC, BP, and MF), KEGG pathways, and Reactome pathway.
The findings revealed the role of the PTTG family in the occurrence and development of gastric cancer and provided a reference for further studies on the mechanisms of gastric cancer and utilization of the PTTG family as a therapeutic targets for gastric cancer.
Materials and methods
The gene chip technology was used in the current study. Fresh gastric cancer samples and the adjacent non-tumor tissues were obtained from Shanghai XinChao Biotechnology, frozen, and stored in liquid nitrogen until later use. A total of 30 samples of gastric cancer were collected for use in the present study. The inclusion criteria was: 1. Accord with gastric cancer diagnosis standard and clinical staging standard 2. No previous history of tumor or major organ damage. On the other hand the exclusion criteria included: 1. Non-primary gastric cancer 2. Failure of vital organs 3. Women under 18 years of age and pregnant or lactating women 4. Pre-treated patients, who had been treated in the past. The chip used in this study was a commercial product purchased from the company. No ethical certificate was required for this study.
qRT-PCR
1. According to Takara: Protocol for SYBR® Premix Ex Taq™ II (Tli RNaseH Plus) (RR820Q). The 20ul system used was used to configure the qPCR MasterMix. Since the DNA template already existed on the product cDNA, the 2ul DNA template was replaced with water. 2. After vortexing well, centrifuge briefly and aliquot into 8 tubes. 3. Use RAININ electronic 8-unit pipette E4 XLS, set to 20ul, then add 20ul qPCR MasterMix to each well of each row 4. Use Axygen PlateMax Ultraclear Sealing Film (UC-500) to seal the product, and place the chip on ice for 15 min to fully dissolve the lyophilized cDNA. 5. Place the sponge on a vortex shaker for 30s, put it into a plate centrifuge Xiang Yi L-530 and centrifuge at 3000rpm for 3min. 6. On the machine: place the chip on the Roche LightCycler 480II, Setup program: Step 1: 95 degrees for 30s Step 2: 95 degrees for 5s, 60 degrees for 30s Cycle: 40 60 degrees stage: collect fluorescence Step3: 95 degrees for 5s, 60 degrees for 1min, 95 degrees 60 degrees to 95 degrees stage: collect fluorescence.
UALCAN
The UALCAN (http://ualcan.path.uab.edu/index.html/) (Chandrashekar et al. Citation2017) is an interactive web portal that was used to analyze cancer genome data to determine the expression levels of PTTG family genes between tumor and normal tissues as well as between different pathological signs of tumor tissue.
Kaplan-Meier plotter
The Kaplan- Meier (http://kmplot.com/analysis/) (Győrffy et al. Citation2013) database was used to analyze the expression levels of the PTTG family in tumor and normal tissues, the expression levels of PTTG family, and the overall survival (OS) of patients with gastric cancer (First progression (FP) survival and post progression survival (PPS)) as well as in the analysis of clinic pathological features.
Oncomine
The Oncomine (https://www.oncomine.org/) (Rhodes et al. Citation2004) is a cancer microarray database. It was used in the present study to determine the expression levels of the PTTG family gene in different gastric cancer types.
MiRNet
The MiRNet (https://www.mirnet.ca/) (Li et al. Citation2014; Fan et al. Citation2016; Chang et al. Citation2020) is an integrated database from multiple miRNA-linked databases that can be used for functional interpretation of miRNA-target interaction networks. In the present study, PTTG-related miRNAs were introduced and target genes of miRNAs were identified to establish a regulatory network.
Starbase
The StarBase (http://starbase.sysu.edu.cn/) (Li et al. Citation2014; Fan et al. Citation2016) through analyzing millions of Ago and other RBP binding sites constructed the most comprehensive miRNA-lncRNA, miRNA-pseudogene, miRNA-circRNA, and miRNA-mRNA, as well as protein–RNA interaction networks. In the present study, the Starbase database was used to detect the expression levels of the potential miRNAs in gastric cancer tissues.
Linkedomics
The Linkedomics (http://www.linkedomics.org/login.php) (Vasaikar et al. Citation2018) based on mass spectrometry (MS) was the first integration of the global proteomics database of multiple omics data. In the current study, expressed genes were statistically analyzed using the Pearson correlation coefficient of PTTG3P and the figure of volcano was displayed in the form of heat. Further, the functional modules of Linkedomics were used to establish the relationship between PTTG3P and the parent genes through gene set enrichment analysis (GSEA), gene ontology (GO), functional annotation, and pathway enrichment analysis.
Statistical analysis
A t test (p < 0.05) was used to compared the PTTG expression levels among the PTTG family groups, *p < 0.05, *p < 0.01, ***p < 0.001. The Kaplan-Meier curve was also used to compare the differences in survival time. Spearman correlation coefficient was calculated to determine the association between PTTG3P and −1 or −2.
Results
Expression levels of PTTG in gastric cancer family
First, the Kaplan-Meier Plotter database was used to determine the expression levels of PTTG family genes in common tumor tissues. It was found that PTTG1, PTTG2, and PTTG3P were highly expressed in several solid tumors such as lung cancer, breast cancer, ovarian cancer, and gastric cancer among others, as well as in hematological diseases such as lymphocytic leukemia (Supplement Figure 1A-C).
The expression levels of PTTG family in gastric cancer tissues was then analyzed through Kaplan-Meier Plotter database and UALCAN cancer database. In Kaplan-Meier Plotter database, expression levels of PTTG1, PTTG2, and PTTG3P in gastric cancer tissues were significantly higher compared with those in normal tissues (Figure (A–C)). Results of the UALCAN cancer database analysis revealed that expression levels of PTTG1 and PTTG3P in gastric cancer tissues were significantly higher than those of normal tissues, whereas the expression levels of PTTG2 in gastric cancer tissues showed an increasing trend, but the difference was not significant compared with the expression level in normal tissues (Figure (D,F)).
Figure 1. Expression of the PTTG gene family in gastric cancer tissues. (A) Expression profiles of PTTG1 in gastric tissues (Normal n = 294, Tumor n = 375) were analyzed using the Kaplan-Meier Plotter database. (B) Expression profiles of PTTG2 in gastric tissues (Normal n = 294, Tumor n = 375) were analyzed using the Kaplan-Meier Plotter database. (C) Expression profiles of PTTG3P in gastric tissues (Normal n = 294, Tumor n = 375) was analyzed using the Kaplan-Meier Plotter database. (D) Expression profiles of PTTG1 in gastric cancer were analyzed using the UALCAN database. (E) UALCAN database analysis of PTTG2 expression profiles in gastric cancer. (F) UALCAN database analysis of PTTG3P expression profiles in gastric cancer. (G) qRT-PCR analysis of PTTG1 expression profiles in 30 pairs of GC and adjacent non-tumor tissues (H) qRT-PCR analysis of PTTG2 expression profiles in 30 pairs of GC and adjacent non-tumor tissues. (I) qRT-PCR analysis of PTTG3P expression profiles in 30 pairs of GC and adjacent non-tumor tissues. **p < 0.01, ***p < 0.001. (A-F), The five horizontal lines from bottom to top denote: minimum, 25th percentile, 50th percentile, 75th percentile and maximum values; (G-I), The three horizontal lines from bottom to top represent: the 25th percentile, 50th percentile, and 75th percentile values.
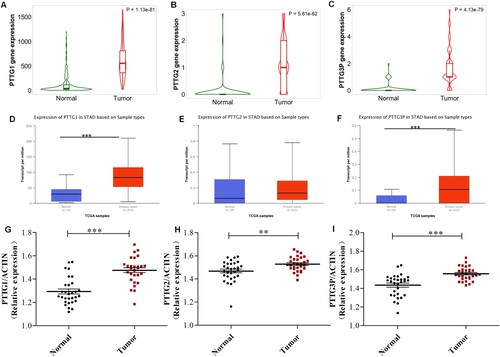
Expression of PTTG family in gastric cancer tissues was analyzed using the Oncomine cancer microarray database. Results showed that the genes of PTTG family were significantly upregulated in gastric cancer tissues (Supplement Table 1). To confirm the up-regulation of PTTG family in GC, the expression of PTTG family was also examined in another 30 pairs of GC/ non-tumor tissues using qRT-PCR. Further, of this study were then verified through gene chip technology experiments as shown in Figure (G–I): The qRT-PCR was also used to detect mRNA expressions levels of PTTG1, PTTG2, and PTTG3P in 30 pairs of gastric cancer/non-tumor tissues, which were consistent with the database results. Expression levels of PTTG1, PTTG2, and PTTG3P in tumor tissues were significantly higher than those of the paracancillary tissues. These results indicate that genes of the PTTG family are highly expressed in gastric cancer tissues and may have therapeutic value in gastric cancer.
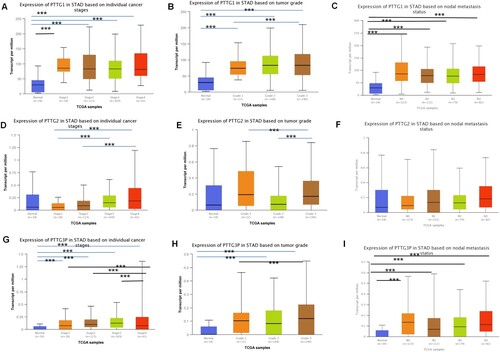
To determine the correlation between the expression levels of PTTG1, PTTG2, PTTG3P, and various clinic-pathological features of gastric cancer, the UALCAN cancer database was used for further subgroup analysis of the clinic pathological features of gastric cancer tissues. The expression levels of PTTG1 and PTTG3P in patients with gastric cancer were significantly higher compared with those of normal tissues based on tumor grade, stage, and lymph node metastasis (Figure (A–C,G–I)). Further analysis showed that the expression level of PTTG2 was not statistically significant (Figure (D–F)). Moreover, based on age, gender, race, Helicobacter pylori infection, and TP53 expression, the expression levels of PTTG1 and PTTG3P in gastric cancer tissues were significantly higher than those of the normal controls, whereas the PTTG2 was not significantly expressed (Supplement Figures 2–4).
Figure 2. Expression profiles of the PTTG gene family in gastric cancer patient subgroups, grouped according to tumor grade, stage and lymph node metastasis. (A) Box plots for relative expression of PTTG1 in normal individuals or in stage 1, 2, 3 and 4 gastric cancer patients. (B) Box plots for relative expression of PTTG1 in normal individuals or in grade 1, 2 or 3 gastric cancer patients. (C) Box plots for relative expression of PTTG1 in normal individuals or in gastric cancer patients at N0, NI, N2 as well as N3 and N4 interchange. (D) Box plots for relative expression of PTTG2 in normal individuals or in stage 1, 2, 3 and 4 gastric cancer patients. (E) Box plots for relative expression of PTTG2 in normal individuals or in grade 1, 2 and 3 gastric cancer patients. (F) Box plots for relative expression of PTTG2 in normal individuals or in gastric cancer patients at N0, NI, N2 as well as N3 and N4 interchange. (G) Box plots for relative expression of PTTG3P in normal individuals or in stage 1, 2, 3 or 4 gastric cancer patients. (H) Box plots for relative expression of PTTG3P in normal individuals or in grade 1, 2, and 3 gastric cancer patients. (I) Box plots for relative expression of PTTG3P in normal individuals or in gastric cancer patients at N0, NI, N2 as well as N3 and N4 interchange. ***p < 0.001. (A-I, The five horizontal lines from bottom to top denote: minimum, 25th percentile, 50th percentile, 75th percentile and maximum values).
Prognostic significance of the PTTG family in gastric cancer
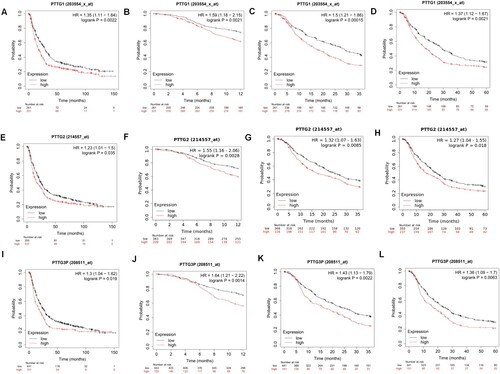
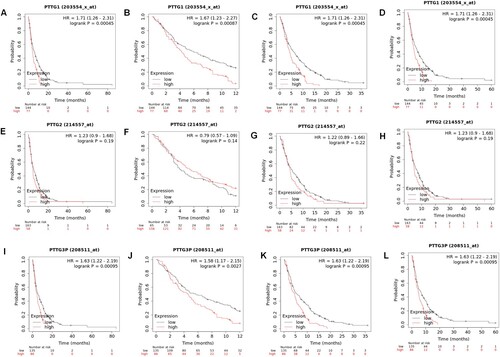
The Kaplan-Meier plotter was used to determine the cutoff value for dividing samples into high expression and low expression groups. The database was also used to evaluate the prognostic value of genes of the PTTG family in human gastric cancer. The correlation between overall survival outcomes and PTTG1, PTTG2 and PTTG3P expression levels in gastric cancer tissues was explored. Results showed that patients with high expression levels of PTTG1, PTTG2, and PTTG3P had shorter overall survival (OS) outcomes as well as shorter 1-, 3-, and 5-years survival outcomes (Figure (A–L)). Subsequently, the relationship between the expression levels of PTTG1, PTTG2, PTTG3P, and survival time was analyzed after primary progression (FP) and post progression survival (PPS) of patients with gastric cancer.
Figure 3. Prognostic values of the PTTG gene family in gastric cancer patients. (A–D) PTTG1 levels and overall survival outcomes in gastric cancer and 1-, 3- and 5-year survival outcomes. (E–H) PTTG2 levels and overall survival outcomes in gastric cancer as well as 1-, 3- and 5-year survival outcomes. (I–L) PTTG3P levels and overall survival outcomes in gastric cancer as well as 1-, 3- and 5-year survival outcomes. (Shorter overall survival patients with high expressions of PTTG1/PTTG2/PTTG3P while longer overall survival patients with low expression).
We found that elevated expression levels of PTTG1 and PTTG3P in both FP and PPS were significantly lower than patients with lower expression and also have shorter 1-, 3-, and 5-years survival (Figure (A–D,I–L) and Figure (A–D,I–L)). Further, it was noted that the high expression of PTTG2 was significantly lower in FP than in patients with low expression but the difference was not significant in PPS (Figures (E–H) and 5(E–H)).
Figure 4. Associations between PTTG gene family expressions and survival outcomes in patients with first progression of gastric cancer. (A–D) PTTG1 levels and first progression survival outcomes in gastric cancer as well as the 1-, 3- and 5-year survival outcomes. (E-H) PTTG2 levels and first progression survival outcomes in gastric cancer as well as the 1-, 3- and 5-year survival outcomes. (I-L) PTTG3P levels and first progression survival in gastric cancer as well as the 1-, 3- and 5-year survival outcomes. (Shorter FP patients with high expressions of PTTG1/PTTG2/PTTG3P while longer FP patients with low expressions).
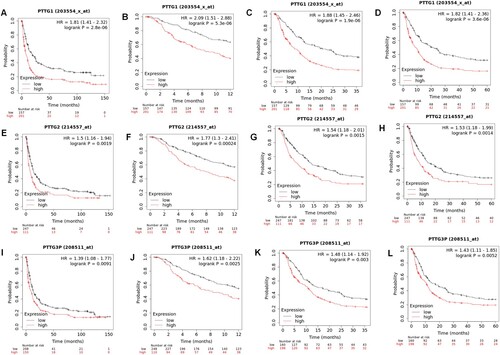
Figure 5. Associations between PTTG gene family levels and post progression survival outcomes in gastric cancer patients. (A-D) PTTG1 levels and post progression survival outcomes for gastric cancer as well as the 1-, 3- and 5-year survival outcomes. (E-H) PTTG2 levels and post-progression survival outcomes in gastric cancer as well as 1-, 3- and 5-year survival outcomes. (I-L) PTTG3P levels and post progression survival outcomes in gastric cancer as well as the 1-, 3- and 5-year survival outcomes. (Shorter PPS patients with high expressions of PTTG1/PTTG2/PTTG3P while longer PPS patients with low expressions).
Results of sub-analysis revealed that elevated PTTG1 expression correlated with shorter survival time in patients with negative HER-2, no distant metastasis, male and female typing, surgical treatment, chemotherapy with 5-Fu, and poorly differentiated cancer. By contrast, PTTG1 expression was not correlated with lymph node metastatic state, tumor size, and survival in disease stage (supplement Table 2). Furthermore, high PTTG2 expression was associated with shorter survival time in patients with negative HER-2, male and female genotypes, chemotherapy with 5-Fu, stage 1 disease, and with no lymph node metastasis or lymph node metastasis, but this was not significantly associated with the degree of tumor differentiation or survival with distant metastasis (supplement Table 3).
The high expression of PTTG3P was associated with shorter survival time in patients with negative HER-2, those using the 5-FU chemotherapeutic drug, patients with differentiated and highly differentiated cancers, patients in stage 2 of the disease, and female patients. However, this was not significantly correlated with lymph node metastasis and survival in large tumors (Supplement Table 4). Therefore, these findings imply that the PTTG family may predict poor prognosis of patients with gastric cancer.
The regulatory network of PTTG3P-miRNA- mRNA
A total of 15 candidate miRNAs were identified in the present study as PTTG3P using miRNET analysis (Figure (A)). Further analysis of ceRNA showed that expression level of downstream miRNA of PTTG3P in gastric cancer tissues was lower compared with that of normal control tissues. In addition, results of UALCAN and Starbase database analyses showed that the expression levels of miR-129-5p and miR-383-5p in gastric cancer tissues were significantly lower than those of the normal tissues (Figure (B–F)).
Figure 6. Construction of the PTTG3P-miRNA-mRNA network. (A) Potential PTTG3P-miRNA regulatory network. (B) UALCAN analysis of has-miR-383 levels in gastric cancer and normal control tissues. (C) Has-miR-129-1 levels in gastric cancer and normal control tissues were analyzed by UALCAN. (D) Expression of has-miR-385-5p in gastric cancer and normal control tissues were analyzed by Starbase. (E) Expression of has-miR-129-5p in breast cancer and normal control tissues were analyzed by Starbase. (F) Potential pseudogenetic PTTG3P-miRNA-mRNA regulatory network. (The five horizontal lines from bottom to top represent: minimum, 25th percentile, 50th percentile, 75th percentile and maximum values).
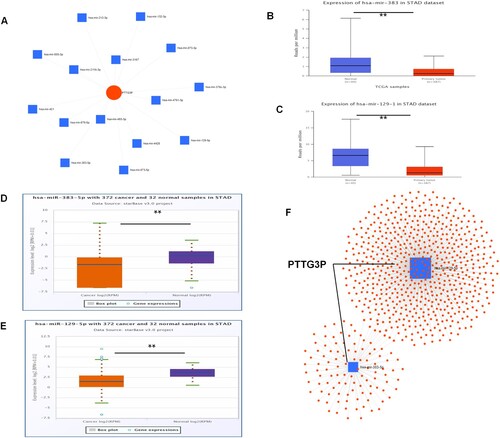
A total of 738 potential mRNA targets of the two miRNAs (miR-129-5p and miR-383-5p) were identified using miRNet. The two miRNA target genes are shown in Supplement Table 5. Finally, the pseudogene PTTG3P-miRNA-mRNA regulatory network was constructed. Analysis of the network suggested that the pseudogene PTTG3P may play a carcinogenic role through this regulatory network (pseudogene PTTG3P-miRNA-mRNA) in the gastric cancer tissues. However, these findings should be validated in future studies.
We further analyzed the regulatory network of lncRNA-miRNA-PTTG1 /PTTG2. A total of 31 miRNAs were identified as candidate miRNAs of PTTG1 whereas 6 miRNAs were identified as candidate miRNAs of PTTG2 (Supplement Figure 5A and B). After screening, it was found that the expression levels of miR-1-3p, miR-195-5p, miR-23b-3p, and miR-129-2-3p in gastric cancer tissues were significantly low than those in normal tissues (Supplement Figure 6 and supplement Figure 7). The miRNA target genes are presented in Supplement Table 6. Therefore, PTTG2 be regulated by the ceRNA network in gastric cancer.
Co-expression networks of PTTG3P in gastric cancer
The functional module of Linkedomics was used to analyze PTTG3P co-expression genes in gastric cancer. A total of 823 genes were positively correlated with PTTG3P (dark red dots), whereas a total of 391 genes were negatively correlated with PTTG3P (dark green dots) (Figure (A)). The heat map in the current study also showed the top 50 important genes that were positively and negatively correlated with PTTG3P (Figure (B,C)).
Figure 7. Differential expression of PTTG3P-related genes in gastric cancer (Linkedomics). (A) Linkedomics was used to analyze PTTG3P-associated genes. (B-C) Heat map showing the genes that were positively and negatively correlated with PTTG3P in gastric cancer (TOP 50). The genes marked in red were positively correlated while those marked in green were negatively correlated. (D) Bioprocesses enriched with co-expressed PTTG3P-associated genes (BP, MF, and CC). (E) KEGG and Reactome pathways enriched with co-expressed PTTG3P-associated genes.
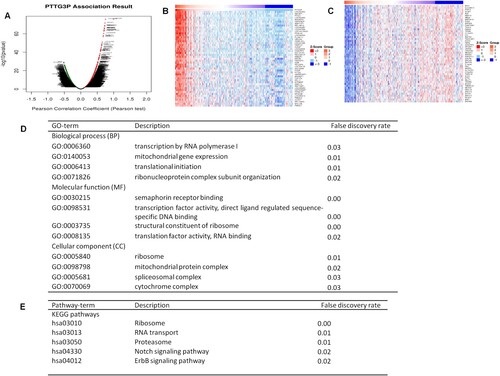
Analysis of GO was performed using the gene set enrichment analysis (GSEA). Results showed that genes were enriched in biological process (BP), cellular component (CC), and molecular function (MF), such as BP class ribosomes RNA polymerase I transcription (GO: 0006360), mitochondrial gene expression (GO: 0140053), and ribosomal ribonucleoprotein complex subunit tissue (GO: 0071826). Cellular component (CC), class ribosomes (GO: 0005840) and spliceosome complexes (GO: 0005681); the structural components of MF ribosomes (GO: 0003735), translation factor activity, RNA binding (GO: 0008135), and ligand activated transcription factor activity (GO: 0098531).
This study found that the expression of PTTG3P was correlated with the transcription and translation processes (Figure (D)). Pathway analysis showed that KEGG was enriched in ribosome (HSA03010), proteasome (HSA03050), RNA transport (HSA03013), Notch signaling pathway (HSA04330), and ErbB signaling pathways (HSA04012) among other pathways (Figure (E)). This indicated that PTTG3P has a wide range of effects on transcriptional translation and cell signaling pathways.
Association between pseudogene PTTG3P and its parent genes PTTG1 and PTTG12
Previous studies have shown that pseudogenes can regulate their parent genes in various ways during the pathogenesis of human cancer. Therefore, LinkedOmics was used to determine the correlation between PTTG3P, PTTG1, and PTTG2. It was found that both PTTG1 and PTTG2 were positively correlated with PTTG3P expression, however the correlation between the two was weak (Figure (A,B)).
Figure 8. Correlations between PTTG3 and parental gene expressions. (A) Linkedomics was used to analyze the correlations between PTTG3P and PTTG1 gene expression in gastric cancer. (B) Linkedomics was used to analyze the correlations between PTTG3p and PTTG2 expression in gastric cancer. (C) Correlations between PTTG3p and PTTG1 in 30 clinical samples. (D) Correlations between PTTG3P and PTTG2 in 30 clinical samples.
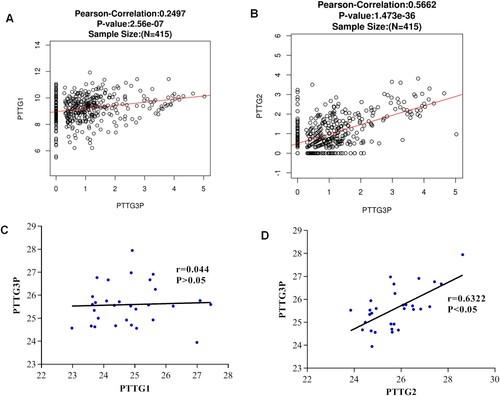
To confirm the accuracy of the findings, the expression levels of PTTG1, PTTG2, and PTTG3P were detected using gene microarray. Correlation analysis revealed that the PTTG3P was positively correlated with PTTG2, whereas the expression level of PTTG3P was not significantly correlated with the expression of PTTG1 (Figure (C,D)). Therefore, these findings indicated that PTTG3P expression was positively correlated with PTTG2 expression, implying that PTTG3P may promote gastric cancer progression by up-regulating PTTG2. However, there is need for more studies to validate the findings.
Discussion
The PTTG family of genes consists of PTTG1, PTTG2, and PTTG3P. Among them, PTTG1 is the most studied. The expression of PTTG1 has been shown to be significantly up-regulated in many endocrine-related tumors, which inhibits cell apoptosis, thereby promoting tumor proliferation, invasion, and metastasis (Vlotides et al. Citation2007; Ren and Jin Citation2017; Fraune et al. Citation2020; Meng et al. Citation2020). Therefore, PTTG1 participates in the development of many tumors. In terms of PTTG2 functions in cells, studies have shown that consumption of PTTG2 cells showed a loss of contact between them, accompanied by cells became round, and similar spindle cell formation. Low expression of PTTG2 in cells are associated with elevated levels of E-calcium mucin repressors (q and Zeb1), implying that PTTG2 is involved in cell invasion (Méndez-Vidal et al. Citation2013). PTTG3, which was discovered by Kakar et al., is a pseudogene that is highly homologous to its parent genes (PTTG1 and PTTG2). Even though pseudogenes have similar DNA sequences to parent genes, they have cell expression and protein coding defects(Chen et al. Citation2000; Poliseno et al. Citation2010; Zhang and Shi Citation2019). Elevated expression of PTTG3p in HCC tissues promoted G1-/-S transition, and enhanced the expression of c-myc, CyclinD1, and p-Rb. These findings imply that PTTG3P contributes to the proliferation and metastasis of HCC cells (Huang et al. Citation2018). It was found that miR-129-5p, miR-376C-3p, and miR-383-5p levels in breast cancer tissues were significantly lower relative to normal tissues. Analysis of the PTTG3P-miRNA-mRNA network in breast cancer tissues showed that PTTG3P may be regulated by this miRNA-mRNA network. The network participates in carcinogenesis. Functional studies have revealed that genes co-expressed with PTTG3P are mainly enriched in nuclear division, cell cycle and oocyte meiosis (Lou et al. Citation2019). However, the potential regulatory mechanisms of PTTG3P in gastric cancer and how it regulates gastric cancer occurrence and development have not been conclusively determined.
In this study, we found that PTTG1, PTTG2, and PTTG3P levels are elevated in most tumor tissues, including gastric cancer tissues. The high expression level of PTTG3P in gastric cancer tissues was verified by qRT-PCR and the Kaplan-Meier plotter was used to evaluate the prognostic value of PTTG1, PTTG2 and PTTG3P in gastric cancer patients. High expression of PTTG family members in gastric cancer patients was strongly correlated with low overall survival outcomes, low survival after primary progression (FP), and low post-progression survival (PPS). In their study, Weng et al. analyzed the mRNA expression of PTTG3P in 63 pairs of gastric cancer tissues and adjacent non-tumors. They reported that PTTG3P was significantly up-regulated in about 68.3% of gastric cancer tissues. Further analyses of the PTTG3P expression and clinic-pathological features of 163 gastric cancer patients showed that high expression level of PTTG3P was closely associated with larger tumor sizes and higher recurrence rates (Weng et al. Citation2017). Xu et al. confirmed that mRNA expression of PTTG1 was significantly higher in gastric cancer tissues compared with the corresponding adjacent normal gastric mucosa. Moreover, they reported that compared with adjacent normal gastric mucosa, PTTG1 levels were significantly higher in the cytoplasm and nucleus of gastric cancer cells (Xu et al. Citation2016). These results show that expression level of PTTG gene family is elevated in gastric cancer and can be used to predict the prognosis of this cancer.
High expression of PTTG3P enhances tumor cell proliferation and invasion (Huang et al. Citation2018; Guo et al. Citation2019; Lou et al. Citation2019; Liu et al. Citation2020). To elucidate the biological mechanism involved, we explored the candidate miRNAs of PTTG3P. Two miRNAs were significantly down-regulated in gastric cancer. Based on the ceRNA hypothesis, the two miRNAs may be two downstream miRNAs of PTTG3P. Furthermore, 738 potential mRNA targets of miR-129-5p and miR-383-5p were predicted, after which the PTTG3P-miRNA-mRNA ceRNA network was constructed. It has been reported that these two miRNAs play tumor suppressor roles in various human cancer types (including gastric cancer) (Gao et al. Citation2019; Sun et al. Citation2020; Xu et al. Citation2020; Huang et al. Citation2021). After verifying the down-regulation of miR-129-5p in GC tissues, He et al. (Citation2020) analyzed the potential mechanisms through which it inhibits tumor growth. They confirmed that HOXC10 is the target gene of miR-129-5p and reported that miR-129-5p inhibits GC cell proliferation as well as tumor progression by regulating HOXC10. Wang and Yu (Citation2018) identified COL1A1 as the gene that is down-regulated by miR-129-5p to inhibit tumor growth. Wei and Gao (Citation2019) found that LDHA is the target gene of miR-383-5p. MiR-383-5p regulates tumor cell proliferation through the target genes involved in PI3K, m TOR, c-MYC, TGF- β receptor, VEGF/VEGFR and E-cadherin signaling pathways. In summary, miRNAs regulate carcinogenesis as well as tumor inhibitory pathways, and targets various genes to control several cancer processes. Therefore, the PTTG3P-miRNA-mRNA network provides a basis for in-depth analyses of PTTG3P-related targets, and is expected to reveal the mechanisms of PTTG3P in tumorigenesis.
In this study, we found the PTTG3P-related genes through linkedonomics. The genes were subjected to GO (CC, BP and MF) and KEGG enrichment analyses via GSEA. The functional network of PTTG3P was found to be related to ribosome, spliceosome complex, mitochondrial gene expression, cell signal transduction, and enzymes involved in gene transcription. Previously, analysis of the transcriptome landscape of gastric cancer, functional analysis of EBV, and MSI-high Microsatellite instability of gastric cancer revealed that MSI-high tumors were enriched with DNA replication and mitotic cell cycle, while eBV tumors showed down-regulation of genes involved in mitotic pathways (Gullo et al. Citation2018). The signal pathway is important in tumorigenesis and plays an important role in regulating cell proliferation, apoptosis and differentiation (Molaei et al. Citation2018). Yeh et al. (Citation2009) found that the Notch signal pathway induced the expression of cyclooxygenase-2 (COX-2) by binding to the Notch1 receptor intracellular domain on the COX-2 promoter. In this way, it promotes the progression of gastric cancer. Immunofluorescence and flow cytometry assays on stomach cancer samples showed that PTTG3P promoted cell cycle progression by enhancing G1-S transformation of gastric cancer cells (Weng et al. Citation2017). Therefore, we postulated that PTTG3P promoted cancer progression by regulating gene transcription and cell signal transduction. Pseudogenes promote cancer occurrence and development by regulating their parent genes (Huang et al. Citation2018; Lou et al. Citation2019; Liu et al. Citation2020). We found that PTTG3P levels in the Linkedomics database were significantly positively correlated with PTTG2 levels, and weakly correlated with PTTG1 levels. The association between PTTG3P and PTTG1 or −2 was further evaluated in clinical samples. It was found that PTTG3P was only positively correlated with PTTG2. PTTG2 and PTTG1 are homologous genes of PTTG3P. Although its biological function has not been established, high expression of PTTG2 was found to be correlated with increased cell proliferation and invasion. For head and neck cancers, expression levels of PTTG2 have been associated with expression levels of genes involved in the p53 pathway and p53 mutations, which regulates the cell cycle progression and transcriptional activities, hence the cell survival outcomes. Thus, PTTG2 participates in the regulation of cell cycle progression and cell proliferation (Guo et al. Citation2016; Grzechowiak et al. Citation2020). These findings imply that PTTG3P influences the occurrence and development of gastric cancer by promoting gene expression.
Conclusions
High expression of PTTG1, PTTG2, and PTTG3P in gastric cancer tissues is significantly correlated with poor survival outcomes. Moreover, PTTG3P up-regulates the expression of PTTG2, thereby promoting malignancy in gastric cancer. In conclusion, the PTTG gene family, especially PTTG3P, can be used to predict the prognosis and develop therapeutic agents for cancer treatment.
Compliance with ethical standards
The chip used in this study was a commercial product that can be purchased from the company. No ethical certificate is required.
Authors’ contributions
Lihong Fei and Guoxin Hou contributed to the conception and design of the research and drafted the manuscript. Lihong Fei, Guoxin Hou and Zhimin Lu contributed to the acquisition of data. Lihong Fei and Guoxin Hou contributed to the analysis and interpretation of data. Lihong Fei, Guoxin Hou, Xinmei Yang and Zizhong Ji contributed to statistical analysis. Xinmei Yang and Zizhong Ji revised the manuscript for important intellectual content. All authors revised the content and approved the final manuscript. All authors agree to be accountable for all aspects of the work.
Disclosure statement
No potential conflict of interest was reported by the author(s).
Data availability statement
Data available in a public repository that issues datasets with https://datadryad.org/stash/share/qE0uGwjCWSLR7kRz7a-uVblTB3q9l34IZ7ij0kICiUQ.
Additional information
Funding
References
- Cai Q, Zhu C, Yuan Y, Feng Q, Feng Y, Hao Y, Li J, Zhang K, Ye G, Ye L, et al. 2019. Development and validation of a prediction rule for estimating gastric cancer risk in the Chinese high-risk population: a nationwide multicentre study. Gut. 68:1576–1587.
- Chandrashekar DS, Bashel B, Balasubramanya SAH, Creighton CJ, Ponce-Rodriguez I, Chakravarthi BVSK, Varambally S. 2017. UALCAN: a portal for facilitating tumor subgroup gene expression and survival analyses. Neoplasia. 19:649–658.
- Chang L, Zhou G, Soufan O, Xia J. 2020. miRNet 2.0: network-based visual analytics for miRNA functional analysis and systems biology. Nucleic Acids Res. 48:W244–W251.
- Chen L, Puri R, Lefkowitz EJ, Kakar SS. 2000. Identification of the human pituitary tumor transforming gene (hPTTG) family: molecular structure, expression, and chromosomal localization. Gene. 248:41–50.
- Correa P. 2013. Gastric cancer: overview. Gastroenterol Clin North Am. 42:211–217.
- Fan Y, Siklenka K, Arora SK, Ribeiro P, Kimmins S, Xia J. 2016. miRNet – dissecting miRNA-target interactions and functional associations through network-based visual analysis. Nucleic Acids Res. 44:W135–W141.
- Fraune C, Yehorov S, Luebke AM, Steurer S, Hube-Magg C, Büscheck F, Höflmayer D, Tsourlakis MC, Clauditz TS, Simon R, et al. 2020. Upregulation of PTTG1 is associated with poor prognosis in prostate cancer. Pathol Int. 70:441–451.
- Gao G, Xiu D, Yang B, Sun D, Wei X, Ding Y, Ma Y, Wang Z. 2019. miR-129-5p inhibits prostate cancer proliferation via targeting ETV1. Onco Targets Ther. 12:3531–3544.
- Grzechowiak I, Graś J, Szymańska D, et al. 2020. The oncogenic roles of PTTG1 and PTTG2 genes and pseudogene PTTG3P in head and neck squamous cell carcinomas. Diagnostics. 10:606.
- Gullo I, Carvalho J, Martins D, Lemos D, Monteiro A, Ferreira M, Das K, Tan P, Oliveira C, Carneiro F, et al. 2018. The transcriptomic landscape of gastric cancer: insights into Epstein-Barr virus infected and microsatellite unstable tumors. Int J Mol Sci. 19:2079.
- Guo X-C, Li L, Gao Z-H, Zhou H-w, Li J, Wang Q-q. 2019. The long non-coding RNA PTTG3P promotes growth and metastasis of cervical cancer through PTTG1. Aging. 11:1333–1341.
- Guo Y, Shao Y, Chen J, Xu S, Zhang X, Liu H. 2016. Expression of pituitary tumor-transforming 2 in human glioblastoma cell lines and its role in glioblastoma tumorigenesis. Exp Ther Med. 11:1847–1852.
- Győrffy B, Surowiak P, Budczies J, Lánczky A. 2013. Online survival analysis software to assess the prognostic value of biomarkers using transcriptomic data in non-small-cell lung cancer. PloS one. 8:e82241.
- He J, Ge Q, Lin Z, Shen W, Lin R, Wu J, Wang B, Lu Y, Chen L, Liu X, et al. 2020. MiR-129-5p induces cell cycle arrest through modulating HOXC10/cyclin D1 to inhibit gastric cancer progression. FASEB J. 34:8544–8557.
- Huang G, Guo X, Yang H. 2021. Long noncoding RNA SNHG1 promotes human prostate cancer progression by sponging miR-383-5p. Anti-cancer Drugs. 32:286–295.
- Huang J-L, Cao S-W, Ou Q-S, Yang B, Zheng S-h, Tang J, Chen J, Hu Y-w, Zheng L, Wang Q. 2018. The long non-coding RNA PTTG3P promotes cell growth and metastasis via up-regulating PTTG1 and activating PI3K/AKT signaling in hepatocellular carcinoma. Mol Cancer. 17:93.
- Karimi P, Islami F, Anandasabapathy S, Freedman ND, Kamangar F. 2014. Gastric cancer: descriptive epidemiology, risk factors, screening, and prevention. Cancer Epidemiol Biomarkers Prev. 23:700–713.
- Katai H, Ishikawa T, Akazawa K, Isobe Y, Miyashiro I, Oda I, Tsujitani S, Ono H, Tanabe S, Fukagawa T, et al. 2018. Five-year survival analysis of surgically resected gastric cancer cases in Japan: a retrospective analysis of more than 100,000 patients from the nationwide registry of the Japanese gastric cancer Association (2001–2007). Gastric Cancer. 21:144–154.
- Khorkova O, Hsiao J, Wahlestedt C. 2015. Basic biology and therapeutic implications of lncRNA. Adv Drug Delivery Rev. 87:15–24.
- Li JH, Liu S, Zhou H, et al. 2014. Starbase v2.0: decoding miRNA-ceRNA, miRNA-ncRNA and protein-RNA interaction networks from large-scale CLIP-Seq data. Nucleic Acids Res. 42:D92–D97.
- Lin X, Yang Y, Guo Y, Liu H, Jiang J, Zheng F, Wu B, et al. 2019. PTTG1 is involved in TNF-α-related hepatocellular carcinoma via the induction of c-myc. Cancer Med. 8:5702–5715.
- Liu J, Wang J, Song Y, Ma B, Luo J, Ni Z, Gao P, Sun J, Zhao J, Chen X, et al. 2018. A panel consisting of three novel circulating lncRNAs, is it a predictive tool for gastric cancer? J Cell Mol Med. 22:3605–3613.
- Liu N, Dou L, Zhang X. 2020. LncRNA PTTG3P sponge absorbs microRNA-155-5P to promote metastasis of colorectal cancer. Onco Targets Ther. 13:5283–5291.
- Lou W, Ding B, Fan W. 2019. High expression of pseudogene PTTG3P indicates a poor prognosis in human breast cancer. Mol Ther Oncolytics. 14:15–26.
- Méndez-Vidal C, Gámez-Del Estal MM, Moreno-Mateos MA, Espina-Zambrano ÁG, Torres B, Pintor-Toro JA. 2013. PTTG2 silencing results in induction of epithelial-to-mesenchymal transition and apoptosis. Cell Death Dis. 4:e530.
- Meng C, Zou Y, Hong W, Bao C, Jia X. 2020. Estrogen-regulated PTTG1 promotes breast cancer progression by regulating cyclin kinase expression. Mol Med. 26:33.
- Molaei F, Forghanifard MM, Fahim Y, Abbaszadegan MR. 2018. Molecular signaling in tumorigenesis of gastric cancer. Iran Biomed J. 22:217–230.
- Noll JE, Vandyke K, Hewett DR, Mrozik KM, Bala RJ, Williams SA, Kok CH, Zannettino ACW. 2015. PTTG1 expression is associated with hyperproliferative disease and poor prognosis in multiple myeloma. J Hematol Oncol. 8:106.
- Poliseno L, Salmena L, Zhang J, Carver B, Haveman WJ, Pandolfi PP. 2010. A coding-independent function of gene and pseudogene mRNAs regulates tumour biology. Nature. 465:1033–1038.
- Ren Q, Jin B. 2017. The clinical value and biological function of PTTG1 in colorectal cancer. Biomed Pharmacother. 89:108–115.
- Rhodes DR, Yu J, Shanker K, Deshpande N, Varambally R, Ghosh D, Barrette T, Pander A, Chinnaiyan AM. 2004. ONCOMINE: a cancer microarray database and integrated data-mining platform. Neoplasia. 6:1–6.
- Shih JH, Chen HY, Lin SC, Yeh Y-C, Shen R, Lang Y-D, Wu D-C, Chen C-Y, Chen R-H, Chou T-Y, et al. 2020. Integrative analyses of noncoding RNAs reveal the potential mechanisms augmenting tumor malignancy in lung adenocarcinoma. Nucleic Acids Res. 48:1175–1191.
- Sun X, Wang X, Dong G, Zhang B, et al. 2020. Expression level of miR-383-5p in colorectal cancer patients following neoadjuvant chemotherapy and its clinical significance in the prognosis. Minerva Med.
- Vasaikar SV, Straub P, Wang J, Zhang B. 2018. Linkedomics: analyzing multi-omics data within and across 32 cancer types. Nucleic Acids Res. 46:D956–d963.
- Vlotides G, Eigler T, Melmed S. 2007. Pituitary tumor-transforming gene: physiology and implications for tumorigenesis. Endocr Rev. 28:165–186.
- Wang Q, Yu J. 2018. MiR-129-5p suppresses gastric cancer cell invasion and proliferation by inhibiting COL1A1. Biochem Cell Biol. 96:19–25.
- Wei C, Gao J-J. 2019. Downregulated miR-383-5p contributes to the proliferation and migration of gastric cancer cells and is associated with poor prognosis. PeerJ. 7:e7882.
- Weng W, Ni S, Wang Y, Xu M, Zhang Q, Yang Y, Wu Y, Xu Q, Qi P, Tan C, et al. 2017. PTTG3P promotes gastric tumour cell proliferation and invasion and is an indicator of poor prognosis. J Cell Mol Med. 21:3360–3371.
- Xu C, Du Z, Ren S, Liang X, Li H. 2020. MiR-129-5p sensitization of lung cancer cells to etoposide-induced apoptosis by reducing YWHAB. J Cancer. 11:858–866.
- Xu MD, Dong L, Qi P, Weng W-w, Shen X-h, Ni S-j, Huang D, Tan C, Sheng W-q, Zhou X-y, et al. 2016. Pituitary tumor-transforming gene-1 serves as an independent prognostic biomarker for gastric cancer. Gastric Cancer. 19:107–115.
- Yeh TS, Wu CW, Hsu KW, et al. 2009. The activated Notch1 signal pathway is associated with gastric cancer progression through cyclooxygenase-2. Cancer Res. 69:5039–5048.
- Zhang Z, Shi Z. 2019. The pseudogene PTTG3P promotes cell migration and invasion in esophageal squamous cell carcinoma. Open Med. 14:516–522.
- Zheng Y, Guo J, Zhou J, Lu J, Chen Q, Zhang C, Qing C, Koeffler HP, Tong Y. 2015. Foxm1 transactivates PTTG1 and promotes colorectal cancer cell migration and invasion. BMC Med Genet. 8:49.