
 ?Mathematical formulae have been encoded as MathML and are displayed in this HTML version using MathJax in order to improve their display. Uncheck the box to turn MathJax off. This feature requires Javascript. Click on a formula to zoom.
Abstract
The innovation in the proposed termite detection system can detect and predict the population non-destructively based on acoustic and temperature signals. This study aims to identify the characteristics of acoustic and temperature signals of subterranean termite infestation. Various termite populations were inserted into the pine board for 21 days as a feeding test, then infestation was monitored through the continuous acoustic-temperature signals response after 24 h. Based on the signal analysis, the peak of daily termite activity can be found in the afternoon, while the evening until early morning contained significantly less activity. This fluctuation was significantly associated with ambient temperature, the higher the temperature, the greater the activity. Furthermore, the signal analysis revealed that the higher the termite population, the warmer the board temperature with an average of 0.101°C. Based on the results, extensive knowledge is essential to effectively develop the signal processing package in the termite detection system.
Introduction
Termite control and damage repair costs in Indonesia are estimated at over IDR 8.7 trillion per year due to the significant structural damage inflicted on wood structures (Nandika et al. Citation2015). Approximately 90% of the damage is caused by subterranean termites in the genus of Coptotermes (Kuswanto et al. Citation2015; Haneda et al. Citation2017). Meanwhile, these costs can be substantially reduced when infestations are detected earlier. In termite control, early detection is becoming more critical due to the tightening of environmental regulations regarding termiticides. Visual inspection by a trained inspector is the primary method of termite detection. The inspector looks for evidence of infestation such as shelter tubes, feces, damaged woods, and broken-off wings. However, this method has several drawbacks, including (1) inaccessibility of most of the buildings; (2) uncertain level of training and motivation of the inspector; and (3) inspection subjectivity (Robbins et al. Citation1991). These problems have promoted the search for other detection methods that can detect termites in areas inaccessible to direct visual inspection and remove some of the subjectiveness. The other methods developed include trained dogs (Lewis et al. Citation1997), microwave (Evans Citation2002; Fujii et al. Citation2007), acoustic emission device (Mankin et al. Citation2002), infrared temperature (Farkhanda Citation2013), moisture content (Oliver-Villanueva and Abián-Pérez Citation2013), electronic odour detectors (Lewis et al. Citation1997), and borescope camera (Sutherland et al. Citation2014). Fundamentally, numerous advanced termite-detecting systems are developed to detect signals such as temperature, acoustic, moisture content, and gas.
After undergoing a benchmarking process such as sensor availability in the market, ease of integration, and minimal noise interferences, the acoustic and temperature signals were selected because they have an admirable potential compared to others such as moisture content and gas. The detection system is capable of two tasks namely detecting termites’ presence and forecasting their population. It is an innovative breakthrough considering that the detection devices can work for one purpose only, i.e. detecting termites (Lewis et al. Citation2004; Mankin et al. Citation2011; Nanda et al. Citation2018a).
This study was conducted to develop a termite detection system for detecting and predicting the termite population size. A prototype was initially constructed at IPB University, Indonesia, but this system requires an embedded signal processing package for optimal service. This can be built by exploring the acoustic and temperature signals of termite infestation. Besides, this system is specifically designed to detect Indonesia's most dangerous termite, namely the subterranean species Coptotermes curvignathus (Holmgren) (Isoptera: Rhinotermitidae).
In acoustic signal, a few preliminary studies of termite activities in small laboratory colonies of tens to a few hundreds have been performed for drywood termite Incisitermes minor (Hagen) (Isoptera: Kalotermitidae) and the subterranean Reticulitermes grassei(Clément) (Isoptera: Rhinotermitidae) (de la Rosa et al. Citation2015; Lewis et al. Citation2011). In general, acoustic signals have good detection potential with an accuracy of approximately 80% (Su Citation2001; Lewis et al. Citation2004; Nanda et al. Citation2018b). These detectable acoustics are generated during feeding-excavating activity and alarm signals or head-banging of workers and soldiers. The human ear can also hear some termites’ sounds without amplification (Lewis et al. Citation2011). To develop a robust acoustic signal processing package in the proposed system, the following information is needed: (1) termites’ acoustic signal compared to the background noise as a filter; (2) daily activity pattern; and (3) activity duration. The weak point of any acoustic-based device is its dependence on the target activity which might be absent when a signal is acquired. Therefore, all of the above information is significantly essential as the anticipated first step. This crucial issue was discovered by Pinhas et al. (Citation2008) in developing an automatic acoustic detection of red palm weevil and Schofield (Citation2011) on the real-time acoustic identification of invasive wood-boring beetles.
In the modern study of termites’ acoustic signal, various species have been covered such as I. minor (Lewis and Lemaster Citation1991; Indrayani et al. Citation2007; Lewis et al. Citation2011), R. grassei (de la Rosa et al. Citation2015), Coptotermes formosanus (Shiraki) (Isoptera: Rhinotermitidae) (Matsuoka et al. Citation1996), Reticulitermes speratus (Kolbe) (Isoptera: Rhinotermitidae) (Matsuoka et al. Citation1996), Cryptotermes domesticus (Haviland) (Isoptera: Kalotermitidae) (Matsuoka et al. Citation1996), Macrotermes natalensis (Haviland) (Isoptera: Termitidae) (Hager and Kirchner Citation2013), Odontotermes sp. (Isoptera: Termitidae) (Hager and Kirchner Citation2013), and Cryptotermes domesticus (Haviland) (Isoptera: Kalotermitidae) (Evans et al. Citation2007). However, no investigation has been carried out on the subterranean termite C. curvignathus, specifcally in relation to its daily pattern and activity duration. The only most related study was conducted by Lewis et al. (Citation2011), which examined the seasonal and daily activity patterns in using acoustic technology. This study used drywood termite I. minor which might have different behavior compared to the subterranean. Therefore, the results will fill the knowledge gap regarding subterranean termite biology behavior.
Another signal used as a parameter to develop a termite detection system is temperature. Ecologically, termites have the optimum temperature for their survival, such as C. formosanus 36°C (Gautam and Henderson Citation2011), R. speratus 30°C (Nakayama et al. Citation2004), and I. minor 23°C (Lewis et al. Citation2011). However, there are no published reports on the performance of the temperature signal to successfully detect termites. The study of Arinana et al. (Citation2016) was conducted to identify the temperature inside the nest of C. curvignathus. The results showed that the termite nest has a temperature of 31.4°C, which is 1.3°C warmer than the ambient temperature in the laboratory. This difference is caused by termite activity, metabolism, the friction that occurs while feeding on the wood, and a total of individuals in the colony. The termite population size also influences this difference, but the characteristic of wood infested remains poorly understood. This knowledge is vital to provide the possible perspective of applying the temperature signal in a future termite detection system.
Therefore, this study aims to identify the characteristics of acoustic and temperature signals of subterranean termite infestation. This knowledge will significantly improve the development of the detection system and the effective integrated pest management system, enabling more detailed investigations into the natural history of subterranean termites C. curvignathus.
Materials and methods
Termites
Subterranean termites C. curvignathus were collected from infested timbers in Termite Laboratory, IPB University. Historically, this species was first obtained from Yanlappa experimental forest, Bogor (ID) in 2012 and has been successfully cultivated at Termite Laboratory to date. To maintain the termite survival, this laboratory is maintained at 28 ± 2°C and relative humidity (RH) of 89%. This study was reviewed and approved by the Faculty of Agricultural Engineering and Technology, IPB University. The termite testing method referred to Indonesia National Standard (SNI) No. 01.7207-2006 concerning wood and related products’ resistance to destroying organisms.
Test timber
The air-dried pine board Pinus merkusii (Jungh. et de Vries) (Pinales: Pinaceae) with an initial moisture content of 12 ± 0.03% was used for feeding tests. In a previous wood-feeding preference study, the pine board was the most preferred species compared to the other two species investigated, i.e. Falcataria moluccana (Miq.) (Barneby & JW Grimes) (Fabales: Fabaceae), and Acacia mangium (Willd) (Fabales: Fabaceae) (Hadi et al. Citation2016). Infestation was made artificially with a cavity of 12 × 6 × 1 cm on the board with a dimensional size of 20 × 10 × 2.5 cm. Subsequently, for feeding tests, termites were initially inserted, then the board was sealed and infested for 21 days on the concrete chamber with a maintained water supply. A full and detailed description of this concrete chamber was explained by Nanda et al. (Citation2018c).
The groups of the boards were divided into two classes, namely infested and uninfested. The infested class showed the termite-attack boards in various populations, i.e. 100, 200, 300, … , 1000 individuals, while the uninfested represented the board with no termite and served as the control with 0 individual. Each termite population consists of 5 boards, resulting a total of 55 boards were used. Determination of this variation referred to Nanda et al. (Citation2018c), which surveyed C. curvignathus at various board volumes. Based on their formula, this board has a volume of 500 cm3 and can be inhabited by at least 315 individuals. However, to represent an extreme condition of attack, termites were inserted into boards of up to 1000 individuals to enable the proposed system recognize the signals in the study population.
The proportion of every termite population between workers and soldiers was 8:2, for example, when the population is 100 individuals, it consisted of 80 workers and 20 soldiers. Furthermore, a common ratio was applied in testing wood resistance to termites in the laboratory to quantify the population with 1 g = 300 ± 12 individuals. This technique is adequate to avoid termite mortality compared to manual calculation, in which the thin skin quickly dries up. During the 21 days infestation, a change in the termite population was observed. Therefore, a real re-calculation after the infestation process was carried out and used as the population reference for further analysis.
The proposed termite detection system
The proposed termite detection system was built using 3 acoustic and 12 temperature sensors, as well as various other electronic modules. All sensors were mounted in an acrylic box with dimensions 18 × 8 × 8 cm incorporating all the electronic circuits. Theoretically, the work area of the detection system is adjusted to the dimension of the board surface as a feeding test, i.e. 20 cm (length) and 10 cm (width). This means that the system will sense acoustic and temperature signals in an array on the outer surface of the board. shows 2D engineering drawing from the proposed system containing the main components such as real-time clock (RTC) module, micro-SD, microcontroller, acrylic box, pine board, as well as acoustic (MAX9814, San Jose, California), and temperature sensors (MLX90614, Ieper, Belgium). The acoustic sensor has a frequency range of 0.022–22 kHz with gain setting of 40 dB, while the temperature has a resolution of 0.02°C. This system set the sensor distance to the pine board as 0.5 cm as shown in (a), while the distance between sensors on the horizontal and vertical axis was 2 cm ((b)).
Figure 1. Two-dimensional (2D) engineering drawing of the termite detection system, (a) front view; (b) bottom view.
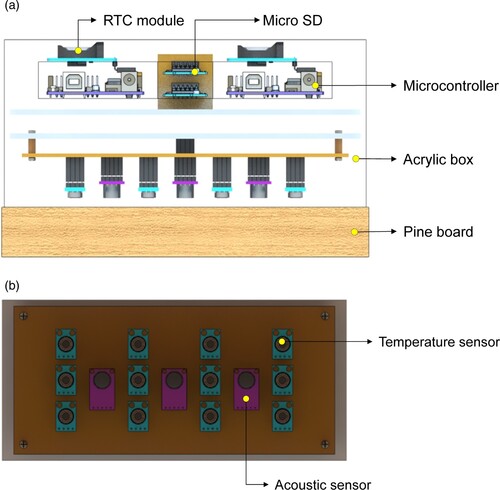
The acoustic and the temperature sensors were connected to an ATmega328P microcontroller (Arduino Uno, Ivrea, Italy) for ease in signal acquisition. This device includes an analog-to-digital converter for converting a signal to an electrical voltage equivalent. The RTC module can monitor the fluctuation of an acoustic and temperature signal over time. Finally, the acquired signals were stored on a Micro-SD card and analyzed on a computer (ThinkPad X-240) equipped with a 2.49 GHz Intel Core i5 processor, 8 GB RAM, and a 64-bit operating system.
Signal acquisition procedure
After 21 days of feeding test, the 55 infested and uninfested boards were prepared for signal acquisition. Alternately, the compact sensor of the termite detection system was placed on the board surface to record acoustic and temperature signals for 24 h, continuously and simultaneously. This duration was set to observe detailed fluctuations in the signals over time. The infested boards were specially placed in a suitable environment to reduce movement resulting in a termite population increase or decrease. After the acoustic and temperature signals acquisition was completed, the termite population was recalculated as a reference for further analysis.
The acoustic signal is digitized at 50 Hz sampling rate, meaning the sensors obtain 50 signals in a second. Meanwhile, the temperature signal, including ambient and board, was monitored every second at 1 Hz sampling rate. During the signal acquisition process, silence was maintained in the room to reduce environmental noises. The 50 and 1 Hz sampling rates on the acoustic and temperature signals were selected to detect the termite activities, considering that events at these resolutions are likely to have ethological significance. According to Mahdiani et al. (Citation2015), the 50 Hz sampling rate is sufficient to obtain time-domain features such as temporal energy with reasonable accuracy. The 1 Hz rate is also considered appropriate because the temperature changes from time to time take and more slowly, unlike acoustic signals, which have a fast-changing pattern. The main advantage of this predefined sampling rate size is to reduce the excessive computational load because this termite detection system will be designed as a portable handheld device.
Signal characteristic analysis
Analyzing the characteristics of acoustic and temperature signals is a crucial step in developing a signal processing package in the termite detection system. Both raw signals were analyzed using Matlab® by MathWorks, Inc. (version R2016b 9.1.0.441655-©1984-2016, US) (Matlab Citation2018). The procedure for analyzing data on acoustic and temperature signals is as follows:
Acoustic signal
Acoustic signals acquired by three sensors were averaged and normalized, the normalization is a scaling technique or pre-processing stage to find a new range from an existing one. The primary goals of normalization are: (1) to guarantee the quality of the data before it is fed to any learning algorithm; and (2) to minimize the data outlier (Patro and Sahu Citation2015). In this investigation, the normalization formula was applied as follows (Prasetyo Citation2014):
(1)
(1)
where
=
,
is the normalized amplitude of the acoustic signal data, −i,
is the signal value,
and
are the maximum and the minimum value of entire signals. This normalization gives the new range of values between −1 and 1, after this process, the characteristics of the acoustic signal including noise filter, daily termite pattern, and termite activity duration were analyzed as follows:
Noise filter
The daily activity of termite
Termite activity duration
Temperature signal
The ambient and the board temperatures in the infested and uninfested boards were graphed to understand the fluctuations in 24 h. Besides, a statistical analysis of polynomial regression with a degree (d = 3) was applied to examine the relationship of: (i) termite population and board temperature; (ii) board temperature and temporal energy. This temperature is selected at the same hour of continuous record for 24 h. The basic model of polynomial regression is as follows:
(3)
(3)
where,
is the slope of the polynomial regression line, and θ0 is the
intercept. The coefficient of determination (R2) is also given in this analysis, and when the value of R2 is close to 1, then the model developed is considered to be more accurate with high correlation.
Results
Re-quantification of termite populations
After 21 days of infestation, the termite population decreased with an average mortality of 7.24% from the initial size. This is a natural phenomenon often experienced when an organism is used as a test subject for an experiment. Gautam and Henderson (Citation2011) reported that various factors cause termite mortality as follows: (a) low RH condition, (b) isolation from a moist food source or substrate, and (c) low movement which weakens the natural immune power, because they lived in a limited condition, not in the natural habitat. Also, Jayasimha and Henderson (Citation2007) stated that the possibility of high mortalities in termite colonies was maintained in the laboratory due to pathogenic fungi attacks. Based on the experimental results, the minimum and maximum termite population after 21 days of infestation varied greatly between 78 and 966, respectively. During the implementation process, it is essential to note that mortality does not affect the development of the detection system. Consequently, the various termite populations will reflect their signature in the acoustic and temperature signals.
Acoustic signal
Over the last decade, acoustic-based devices have been successfully used to detect insects within wood (Hussein et al. Citation2010; Rach et al. Citation2013; Srinivas et al. Citation2013). In terms of termite detection, the acoustic sensor displays values representing activities such as feeding, excavating, and head-banging (Matsuoka et al. Citation1996; Chapman Citation1998; Evans et al. Citation2007; Fujii et al. Citation2007). Overall, these activities will generate a particular characteristic in the acoustic signal. To detect an acoustic signal generated by termites, it must be enframed with a specific total duration that contains the desired activity and undesired signal or background noise. Both signals have a distinctive signature that is reflected in their amplitude (Hussein et al. Citation2010; de la Rosa et al. Citation2015). This value can be used as a threshold (th), for example, when the amplitude is less than th, the signal is considered as background noise (Le-Qing Citation2011).
The acquired termite acoustic signal still contains background noise that must be adequately separated. Based on the analysis, the approximated amplitude threshold as the background noise was −0.17 to 0.17. Therefore, the proposed noise filter to reduce background noise is given in Equation (4), where is the normalized amplitude of the acoustic signals
. This filter has the following rules: when
meets the criteria of −0.17 ≥
≤ 0.17, then it is considered as background noise, but when
or known as 0 paddings (Chen et al. Citation2014), it is regarded as the acoustic signal and its value is preserved. This implies that it is feasible to separate termite-generated acoustic signals from background noise through filtering.
(4)
(4)
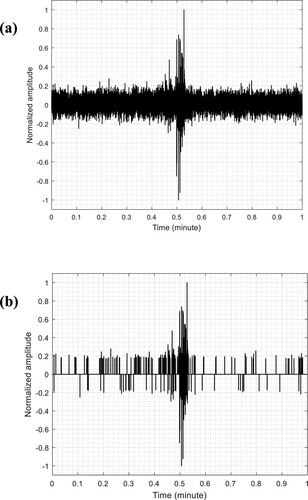
Termite acoustic signal is almost exclusively detected when termites are feeding-excavating or head-banging, but these activities do not always produce acoustic emission. shows the 1-minute cut of the acoustic signal generated by termite infestation. As shown in (a), termite acoustic signals are still mixed with background noise, and must be eliminated. After passing the noise filter in Equation (3), the acoustic signal as background noise had 0 paddings ((b)). Due to the instantaneous activity of termites, some of the detected acoustic signals had several peaks. The purified acoustic signal might contain various activities such as feeding, excavating, and head-banging. According to de la Rosa et al. (Citation2015), the head-banging signal can be identified from sudden amplitude explosions that exceed the average throughout the duration. Termite soldiers generate this signal by banging their heads against the wood when they are disturbed, and this is usually known as an ‘alarm signal’ (Evans et al. Citation2005). This behavior is used for intraspecific communication (Hager and Kirchner Citation2013).
Figure 2. One example of an acoustic signal generated by termite infestation, (a) the termite acoustic signal contains background noise; (b) the purified termite acoustic signal after passing through the noise filter.
The daily activity of termite
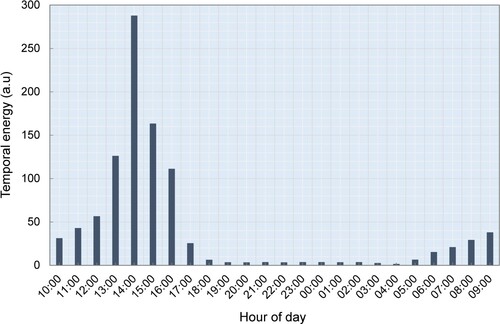
shows the daily activities of termites based on their temporal energy, based on the results, the higher the temporal energy, the more frequent the activity. Visually, the temporal energy indicates that the maximum peak of daily activity occurs at 14:00, as well as in the afternoon between 13:00–16:00. The results showed that termites’ activity slowly increased in the daytime and gradually decreased until the early evening. Based on the analysis, the evening until early morning namely 18:00–5:00 also contained significantly less activity. Lewis et al. (Citation2011) argued that the daily fluctuation in termite activity was significantly associated with ambient temperature, hence, the activity increases with a rise in the ambient temperature. This is consistent with the results which showed that the maximum peak of activity occurred at 14:00, when the ambient temperature in the laboratory has reached its maximum peak, i.e. 28.74°C ().
Figure 3. Termite activity for 24 h of monitoring.
Termite activity duration
To determine whether an acoustic signal is considered a termites’ signal or not, the pre-defined frame length must be segmented into different sizes depending on the average activity duration. This segmentation process has proven effective for detecting various insects such as red palm weevil (Pinhas et al. Citation2008; Hussein et al. Citation2010), Scolytidae (Le-Qing and Zhen Citation2010), flying insect (Chen et al. Citation2014), and cricket family (Potamitis et al. Citation2006). Le-Qing (Citation2011) reported that the small frame size usually only shows part of the segment of insect activity. Therefore, the frame size must be determined precisely and carefully to avoid overlapping termite acoustic signals and background noise.
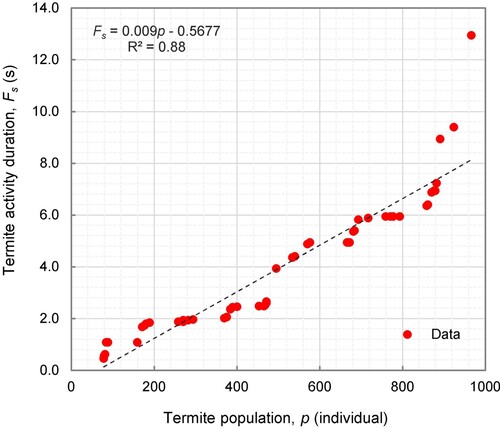
The frame length was set at one minute to identify the termite activity duration. Meanwhile, this frame contains termite activities that vary significantly in duration among various populations as shown in . Based on the analysis, the duration of termite activity in various populations varies greatly between 0.46 and 12.9 s (). Also, this investigation confirms that the average duration is 4.02 s every minute. This result indicates that the acoustic sensors are sensitive to the termite activity in the various population. It can also be implied that the higher the population, the longer the activity detected by the sensor. This is because a higher number of termites will produce greater acoustic signals due to their instantaneous activity. The R2 value of 0.88 indicates that the termite population and termite activity duration have a good correlation between two variables.
Figure 4. The length of termite activity duration in various populations.
The information about the activity duration is crucial in developing an acoustic signal processing package for detecting termites. As previously explained, the duration of termite activity is known as frame size in its implementation. Equation (5) according to (Schofield Citation2011; Giannakopoulos and Pikrakis Citation2014) is the basic formula in the development of the acoustic signal processing package in the termite detection system, where the frame length will be segmented against the activity duration () to produce several m-frame (
). In this study, the value of
was taken from the activity duration. The results showed that the average duration of activity occurs for 4.02s every minute, hence, the value of
can be defined at 4.02s. However, for practical and easy acoustic signal computation,
was set at 4.00 s, then each
was extracted to produce a feature that characterizes each termite population (Ni et al. Citation2011; Daud et al. Citation2013; Mohamad et al. Citation2015).
(5)
(5)
Temperature signal
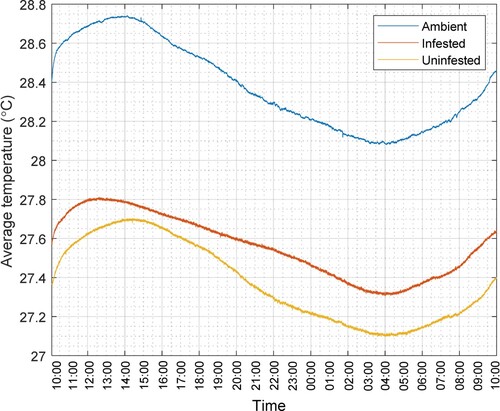
The proposed detection system embedded the temperature signal in the sensing technology. Based on the analysis, the average temperature of ambient, infested, and uninfested board during the 24 h was 28.38, 27.56, and 27.37°C, respectively. gives a more detailed explanation as follows: (i) the ambient has a warmer temperature of 0.82°C and 1.01°C against the infested and uninfested board, respectively, (ii) the infested board has a warmer temperature of 0.19°C compared to the uninfested board. Overall, the maximum temperature occurs in the afternoon between 12:30–14:30 and reaches the lowest in the early morning at 04:00. Peak temperatures on the ambient, infested, and uninfested boards were 14:00, 12:30, and 14:30, respectively. Fluctuations over time tend to follow the trend of ambient, where both the infested and uninfested board constantly keep the temperature lower. According to the continuous record of the temperature signal for 24 h, temperature fluctuations follow the sinusoidal curve. Arinana et al. (Citation2016) reported that they are caused by sunrays radiation and earth-surface energy. The sunrays’ radiation is reduced by the atmosphere before reaching the earth’s surface. Some are also absorbed by water vapor, O2, O3, and CO2, or reflected by clouds and other particles with a greater dimension (Bahtiar et al. Citation2014).
Figure 5. The average temperature fluctuations (i.e. ambient, infested, and uninfested) from a continuous record during 24 h.
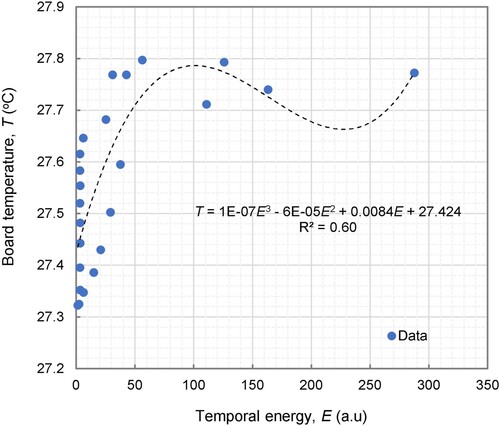
shows the relationship between the termite population and board temperature. Visually, both parameters have a nonlinear relationship, hence, the polynomial regression was used to analyze their relationship. The R2 (0.81) was close to 1, which indicates that the model is accurate and has a high correlation, the larger the termite population, the warmer the board temperature, as evidenced by the increasing trend of the black dotted line. The line can form a curvature to match the data distribution through the role of a degree in the polynomial regression (Nanda et al. Citation2018a). Also, the nonlinear correlation between the temporal energy and board temperature was visualized as shown in . Both parameters have a moderate level correlation, which is indicated by the value of R2 = 0.60, implying the warmer the board temperature, the higher the temporal energy.
Figure 6. The plot of the termite population against board temperature, the black dotted line indicates the best fit of the polynomial regression model.
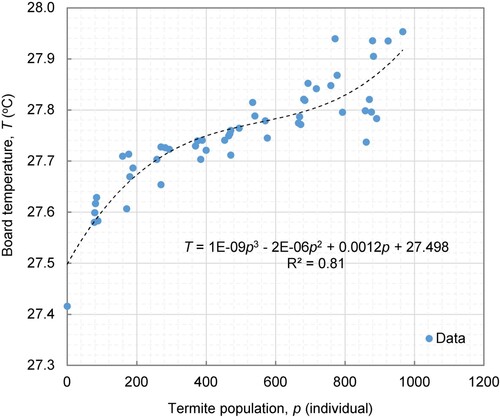
Figure 7. Nonlinear correlation driven by polynomial regression model between the temporal energy and board temperature.
Based on the analysis, the temperature difference in various termite populations was 0.101°C, where the lowest was 27.416°C in 0 individual and the warmest was 27.953°C in 966. This result is consistent with Arinana et al. (Citation2016) which stated that the variations of termite population sizes can affect the temperature of the board because when the infestation is active, they produce metabolic gases such as CO2, hydrogen, nitrogen oxide, and chloroform (Tsunoda Citation1993; Fujii et al. Citation2007; Yanase et al. Citation2012; Yanase et al. Citation2013; Nandika et al. Citation2015). This means the greater the termite population, the higher the amount of gas produced, and in turn, this affects the temperature differences of the board which comes from the center of termites’ attacks to maintain their physical conditions (Harris Citation1971). Furthermore, the temperature is absorbed into all board fibers, even to its outer area. The results also confirm that infrared sensors are sensitive to temperatures produced by various termite populations and can be embedded into the detection system.
Discussion
Over the last decade, the subterranean termite C. curvignathus has become the most destructive pest to wooden buildings, crops, and forest trees, specifically in Indonesia. Due to the cryptic behavior, active infestation and obvious wood damage are rarely apparent during visual observation. Consequently, the development of a detection system is critical for termite pest management. Based on the acoustic and temperature signals, the proposed detection system is designed not only to detect termites but to also predict their population. The main focus of this study is to analyze the characteristics of acoustic and temperature signals produced by termites.
The noise filter that was successfully developed is a valuable property in the pre-processing stage of the acoustic signal. This filter is used to explore the termite behavior, such as daily patterns and their duration activity. The amplitude threshold in the noise filter was analyzed and approximated based on a continuous record of the acoustic signal. Gutiérrez et al. (Citation2010) applied a threshold based on output voltage to detect Rhynchophorus ferrugineus (Oliver) (Coleoptera: Curculionidae) in the palm with the acoustic signal from the uninfested and infested palm being <0.6 V and >0.7 V, respectively. Webb et al. (Citation1988) also applied a simple amplitude threshold in their computation system to detect larval activities in fruit as well as grain, and showed satisfactory performance. In addition, an amplitude threshold can be generated through various numerical algorithms such as fractal dimension to detect wood-boring beetles (Schofield Citation2011), spectral profiling for Anoplophora glabripennis (Motschulsky) (Coleoptera: Cerambycidae) (Mankin et al. Citation2008), high-pass filter for R. ferrugineus (Hussein et al. Citation2010), gaussian mixture model and vector quantization to detect red palm weevil (Pinhas et al. Citation2008), and spectral subtraction technique for flying insect detection and classification (Chen et al. Citation2014).
The application of an acoustic signal to detect termites within the board is not new. Sixty-five years ago, electronic stethoscopes were first proposed to detect termites (Pence et al. Citation1954), but a widespread adaptation of this technology did not occur due to excessive background noise levels (Lewis and Lemaster Citation1991). In termite sensing technology, Farkhanda (Citation2013) recommended that the acoustic signal combines another signal, such as temperature. However, there are no experimental results currently, specifically on termite detection performance using multiple parameters (Nanda et al. Citation2018b). Therefore, this study provides a perspective on the use of acoustic and temperature signals. The results showed that the peak period of the daily termite activity can be found in the afternoon between 13:00–16:00. The training data to develop a classification model by artificial intelligence (Schofield Citation2011) can be directly represented by the information obtained in that period. These results have a significant impact on the development of the termite detection system.
The proposed detection system also involves a temperature signal in sensing technology. In the entomology field, temperature in termite ecology is known to play a significant role, according to the various reports such as (i) evaluation of temperature preference for termite activity (Indrayani et al. Citation2007), (ii) temperature identification in termite nests (Arinana et al. Citation2016), and (iii) the effect of different temperature against termite mortality (Gautam and Henderson Citation2011). This study presents new knowledge about identifying board temperature infested by various termite populations. The results confirm that the higher the termite population, the warmer the board temperature. The temperature difference between termite populations was small, namely 0.101o C based on its average value. As a signal processing package in the termite detection system, statistical calculations such as standard deviation are presumed to make a significant difference between various termite populations. It calculates the variance of the temperature distribution on the board surface. Also, it is important to note that temperature variations on the board surface area might be related to the position of termite activity inside. Based on the results, it can be concluded that the temperature signal needs to be implemented into the termite detection system. However, the relevance of this signal to performance still requires further exploration and a challenging direction for future investigations.
Conclusion
The results present the acoustic-temperature signals’ characteristics of subterranean termite infestation. The noise filter, the daily termite activity, and duration were successfully identified. Based on the numerical analysis, the amplitude threshold as the background noise is −0.17 to 0.17 but outside this range, it is considered as the acoustic signal. During the 24-hour observation, the peak of daily activity was found in the afternoon, while the evening until early morning contained significantly less activity. Furthermore, the daily termite activity fluctuation was significantly associated with ambient temperature, hence, the activity increased with a rise in the ambient temperature. The results also showed that the ambient temperature, 28.38°C was consistently higher than the infested and uninfested board at 27.56°C and 27.37°C, respectively. This information can be applied to develop a termite detection system, specifically for acoustic and temperature signal processing packages.
Acknowledgements
The financial support for the article processing was provided by Universitas Padjadjaran. The authors are grateful to Prof. Tsuyoshi Yoshimura from Kyoto University, Japan, for his constructive comments on this article, as well as the referees and the editors for their suggestions for improving the transferability and readability. Authors contributions: M.A.N.: Writing-original draft and validation, software and data curation, investigation and formal analysis. K.B.S.: Supervision, study design and data curation. A.M.: Conceptualization, formal analysis and visualization. D.N.: Methodology, data analysis and validation. All authors contributed to data interpretation, as well as critically reviewed, revised and approved the final manuscript.
Disclosure statement
No potential conflict of interest was reported by the author(s).
Data availability statement
The data supporting the findings of this study are openly available in Mendeley Data Repository with DOI at http://dx.doi.org/10.17632/n8scbwn6dc.2.
Additional information
Funding
References
- Arinana A, Philippines I, Koesmaryono Y, Nandika D, Aunu R, Harahap IS, Sumertajaya IM, Bahtiar ET. 2016. Coptotermes curvignathus Holmgren (Isoptera: Rhinotermitidae) capability to maintain the temperature inside its nests. J Entomol. 13(5-6):199–202.
- Bahtiar ET, Nugroho N, Karlinasari L, Surjokusumo S. 2014. Human comfort period outside and inside bamboo stands. J Environ Sci Technol. 7(-):245–265.
- Chapman RF. 1998. The insects: structure and function. Cambridge: Cambridge University Press.
- Chen Y, Why A, Batista G, Mafra-Neto A, Keogh E. 2014. Flying insect classification with inexpensive sensors. J Iinsect Behav. 27(5):657–677.
- Daud WMBW, Yahya AB, Horng CS, Sulaima MF, Sudirman R. 2013. Features extraction of electromyography signals in time domain on biceps brachii muscle. Int J Model Optim. 3(6):515–519.
- de la Rosa JJG, Pérez AA, Salas JCP, Fernández JMS. 2015. A novel measurement method for transient detection based in wavelets entropy and the spectral kurtosis: An application to vibrations and acoustic emission signals from termite activity. Measurement. 68(-):58–69.
- Evans T. 2002. Assessing efficacy of TermatracTM; a new microwave based technology for non-destructive detection of termites (Isoptera). Sociobiology. 40(3):575–584.
- Evans T, Inta R, Lai JC, Lenz M. 2007. Foraging vibration signals attract foragers and identify food size in the drywood termite, Cryptotermes secundus. Insect Soc. 54(4):374–382.
- Evans TA, Lai JC, Toledano E, McDowall L, Rakotonarivo S, Lenz M. 2005. Termites assess wood size by using vibration signals. Proc Natl Acad Sci USA. 102(10):3732–3737.
- Farkhanda M. 2013. Biosensors for termite control. International Conference on Sensing for Industry, Control, Communications and Security Technologies.
- Fujii Y, Fujiwara Y, Yanase Y, Okumura S, Narahara K, Ngatsuma T, Yoshimura T, Imamura Y. 2007. Nondestructive detection of termites using a millimeter-wave imaging technique. Forest Prod J. 57(10):75.
- Gautam BK, Henderson G. 2011. Relative humidity preference and survival of starved Formosan subterranean termites (Isoptera: Rhinotermitidae) at various temperature and relative humidity conditions. Environ Entomol. 40(5):1232–1238.
- Giannakopoulos T, Pikrakis A. 2014. Introduction to audio analysis: a MATLAB® approach. Massachusetts: Academic Press.
- Gutiérrez A, Ruiz V, Moltó E, Tapia G, del Mar Téllez M. 2010. Development of a bioacoustic sensor for the early detection of Red Palm Weevil (Rhynchophorus ferrugineus Olivier). Crop Prot. 29(7):671–676.
- Hadi YS, Massijaya MY, Arinana A. 2016. Subterranean termite resistance of polystyrene-treated wood from three tropical wood species. Insects. 7(3):37.
- Hager FA, Kirchner WH. 2013. Vibrational long-distance communication in the termites Macrotermes natalensis and Odontotermes sp. J Exp Biol. 216(17):3249–3256.
- Haneda NF, Retmadjona IY, Nandika D, Arinana. 2017. Biodiversity of subterranean termites on the Acacia crassicarpa plantation. Biod J Biol Divers. 18(4):1657–1662.
- Harris WV. 1971. Termites. Their recognition and control. London: Longman.
- Hussein WB, Hussein MA, Becker T. 2010. Detection of the red palm weevil rhynchophorus ferrugineus using its bioacoustics features. Bioacoustics. 19(3):177–194.
- Indrayani Y, Yoshimura T, Yanase Y, Fujii Y, Imamura Y. 2007. Evaluation of the temperature and relative humidity preferences of the western dry-wood termite Incisitermes minor (Hagen) using acoustic emission (AE) monitoring. J Wood Sci. 53(1):76–79.
- Jayasimha P, Henderson G. 2007. Fungi isolated from integument and guts of Coptotermes formosanus and their antagonistic effect on Gleophyllum trabeum. Ann Entomol Soc Am. 100(5):703–710.
- Kuswanto E, Ahmad I, Dungani R. 2015. Threat of subterranean termites attack on the wooden buildings in Asian countries and their control: a review. Indian J Entomol. 77(4):356–362.
- Le-Qing Z. 2011. Insect sound recognition based on MFCC and PNN. Proceedings of the 2011 International Conference on Multimedia and Signal Processing (CMSP); IEEE.
- Le-Qing Z, Zhen Z. 2010. An investigation in acoustic insect recognition. Orient Insects. 44(1):415–428.
- Lewis VR, Fouche CF, Lemaster RL. 1997. Evaluation of dog-assisted searches and electronic odor devices for detecting the western subterranean termite. Forest Prod J. 47(10):79.
- Lewis VR, Leighton S, Tabuchi R, Haverty M. 2011. Seasonal and daily patterns in activity of the western drywood termite, Incisitermes minor (Hagen). Insects. 2(4):555–563.
- Lewis VR, Lemaster RL 1991. The potential of using acoustical emission to detect termites within wood. USDA Forest Service. Available from: https://www.fs.usda.gov/treesearch/pubs/27856.
- Lewis VR, Power AB, Haverty MI. 2004. Surface and subsurface sensor performance in acoustically detecting western drywood termites in naturally infested boards. Forest Prod J. 54(6):57–62.
- Mahdiani S, Jeyhani V, Peltokangas M, Vehkaoja A. 2015. Is 50 Hz high enough ECG sampling frequency for accurate HRV analysis? Proceedings of the 2015 37th Annual International Conference of the IEEE Engineering in Medicine and Biology Society (EMBC); IEEE.
- Mankin R, Hagstrum D, Smith M, Roda A, Kairo M. 2011. Perspective and promise: a century of insect acoustic detection and monitoring. Am Entomol. 57(1):30–44.
- Mankin R, Osbrink W, Oi F, Anderson J. 2002. Acoustic detection of termite infestations in urban trees. J Econ Entomol. 95(5):981–988.
- Mankin R, Smith M, Tropp J, Atkinson E, Jong D. 2008. Detection of Anoplophora glabripennis (Coleoptera: Cerambycidae) larvae in different host trees and tissues by automated analyses of sound-impulse frequency and temporal patterns. J Econ Entomol. 101(3):838–849.
- Matlab. 2018. Matlab R-2016a: MathWorks. Available from https://www.mathworks.com/?s_tid=gn_logo.
- Matsuoka H, Fujii Y, Okumura S, Imamura Y, Yoshimura T. 1996. Relationship between the type of feeding behavior of termites and the acoustic emission (AE) generation. Wood Res. 83:1–7.
- Mohamad MA, Hassan H, Nasien D, Haron H. 2015. A review on feature extraction and feature selection for handwritten character recognition. J Adv Comp Sci Appl. 1(6):204–212.
- Nakayama T, Yoshimura T, Imamura Y. 2004. The optimum temperature-humidity combination for the feeding activities of Japanese subterranean termites. J Wood Sci. 50(6):530–534.
- Nanda MA, Seminar KB, Nandika D, Maddu A. 2018a. A comparison study of kernel functions in the support vector machine and its application for termite detection. Information. 9(1):5.
- Nanda MA, Seminar KB, Nandika D, Maddu A. 2018b. Discriminant analysis as a tool for detecting the acoustic signals of termites Coptotermes curvignathus (Isoptera: Rhinotermitidae). Int J Tech. 9(4):840–851.
- Nanda MA, Seminar KB, Nandika D, Maddu A. 2018c. Population survey of subterranean termite Coptotermes curvignathus (Isoptera: Rhinotermitidae) on infested pine boards. J Entomol. 15(2):93–100.
- Nandika D, Rismayadi Y, Diba F. 2015. Rayap: Biologi dan Pengendaliannya, Edisi ke-2 (Termite: Biology and its Control), 2nd ed. Surakarta. Universitas Muhammadiyah Surakarta.
- Ni Z, Wang L, Meng J, Qiu F, Huang J. 2011. EEG signal processing in anesthesia feature extraction of time and frequency parameters. Proc Environ Sci. 8:215–220.
- Oliver-Villanueva J, Abián-Pérez M. 2013. Advanced wireless sensors for termite detection in wood constructions. Wood Sci Tech. 47(2):269–280.
- Patro S, Sahu KK. 2015. Normalization: a preprocessing stage. arXiv preprint arXiv:150306462.
- Pence R, Magasin S, Nordberg R. 1954. Detecting wood-boring insects: electronic device developed as aid in locating insects destructive to timber and wood products. Calif Agric. 8(11):5–5.
- Pinhas J, Soroker V, Hetzroni A, Mizrach A, Teicher M, Goldberger J. 2008. Automatic acoustic detection of the red palm weevil. Comput Electron Agric. 63(2):131–139.
- Potamitis I, Ganchev T, Fakotakis N. 2006. Automatic acoustic identification of insects inspired by the speaker recognition paradigm. Proceedings of the INTERSPEECH.
- Prasetyo E. 2014. Data mining mengolah data menjadi informasi menggunakan matlab. Yogyakarta: Andi Offset.
- Rach MM, Gomis HM, Granado OL, Malumbres MP, Campoy AM, Martín JJS. 2013. On the design of a bioacoustic sensor for the early detection of the red palm weevil. Sensors. 13(2):1706–1729.
- Robbins W, Mueller R, Schaal T, Ebeling T. 1991. Characteristics of acoustic emission signals generated by termite activity in wood. Proceedings of the Ultrasonics Symposium, 1991; IEEE.
- Schofield J. 2011. Real-time acoustic identification of invasive wood-boring beetles. University of York.
- Srinivas S, Harsha KS, Sujatha A, Narendra KG. 2013. Effcient protection of palms from RPW larvae using wireless sensor networks. Int J Comput Sci. 10(3):192–200.
- Su N-Y. 2001. A computerized system for remote monitoring of subterranean termites near structures. J Econ Entomol. 94(6):1518–1525.
- Sutherland AM, Tabuchi RL, Moore S, Lewis VR. 2014. Borescope-aided inspection may be useful in some drywood termite detection situations. Forest Prod J. 64(7):304–309.
- Tsunoda K. 1993. Methane emission by the termite, Coptotermes formosanus Shiraki (Isoptera: Rhinotermitidae) (II). Presence of methanogenic bacteria and effect of food on methane emission rates. Jpn J Appl Entomol Z. 5(4):166–174.
- Webb J, Slaughter D, Litzkow C. 1988. Acoustical system to detect larvae in infested commodities. Fla Entomol. 71, 492–504.
- Yanase Y, Fujii Y, Okumura S, Yoshimura T. 2012. Detection of metabolic gas emitted by termites using semiconductor gas sensors. Forest Prod J. 62(7):579–583.
- Yanase Y, Miura M, Fujii Y, Okumura S, Yoshimura T. 2013. Evaluation of the concentrations of hydrogen and methane emitted by termite using a semiconductor gas sensor. J Wood Sci. 59(3):243–248.