
 ?Mathematical formulae have been encoded as MathML and are displayed in this HTML version using MathJax in order to improve their display. Uncheck the box to turn MathJax off. This feature requires Javascript. Click on a formula to zoom.
Abstract
The study aimed to estimate the extent of genetic variability, heritability, and expected genetic gain attributable to agro-morphological traits and to suggest an effective selection scheme and specify promising genotypes for future oat breeding programs. One hundred twenty oat (Avena sativa L.) genotypes were evaluated at two locations in the central highlands of Ethiopia. The analysis of variance indicated that the mean squares due to locations and genotype x location interaction varied significantly for some measured traits while that of genotypes varied significantly (P ≤ 0.001) among all studied traits. Moreover, the estimates of genetic variability, heritability, and expected genetic advance indicate the presence of remarkable genetic diversity in oat genotypes and the magnitude of selection response for these traits in the population to develop superior genotypes for oat improvement. The result revealed that very high to moderately high heritability in a broad sense (h2b) coupled with high to moderate genetic advance as percent of mean (GAM) were recorded for forage dry matter yield (h2b = 64.4%; GAM = 19.3%), number of leaves at forage harvest (h2b = 86.4%; GAM = 19.9%), stem dry matter yield (h2b = 62.9%; GAM = 18.3%), forage yield production rate (h2b = 69.7%; GAM = 21.7%), grain yield (h2b = 64.2%; GAM = 26.1%), panicle length at grain harvest (h2b = 80.9%; GAM = 21.9%), number of spikes per panicle (h2b = 68.8%; GAM = 16.0%), and harvest index (h2b = 80.9%; GAM = 26.0%). The results suggested that these traits are governed more by additive gene action, and selection based on these traits could be effective to achieve the desired genetic gains for improvement. Therefore, high forage dry matter and grain yielding genotypes along with these desirable yield-related traits could be considered for selection in oat genotypes.
Introduction
The common oat (Avena sativa L.), which belongs to the genus avena and the family gramineae/poaceae, is one of the most important dual-purpose cereal crops cultivated for use as fodder and grain worldwide (Stevens et al. Citation2004). The domesticated common oat is extremely variable and widely distributed as compared to other oat species due to human selection and breeding activities (Ladizinsky Citation2012; Esvelt et al. Citation2016). Common oat is an economically important crop and ranks sixth in production among all cereal crops, next to wheat, maize, rice, barley, and sorghum in the world (FAO Citation2012). The oat produced in the world is mainly used as feed, and only 17% of its grain production is used for human consumption (Wagh Citation2018). The grain of oat has a high contribution to human food and also animal feed in the world (Fekede Citation2004; Ruwali et al. Citation2013; Monica et al. Citation2017). Other studies also indicated that oat is a nutritious source of protein, fat, carbohydrate, fiber, vitamins, and minerals, as well as antioxidants with beneficial effects on health (Peterson et al. Citation2005).
Oat is widely utilized in the highland farming system of Ethiopia unlike other cultivated forage crops (Getnet et al. Citation2004). The forage yield potential of released oat varieties ranged from 7.5–19.5 dry matter t/ha with a mean of 11.9 t/ha and their seed yield varied from 1.5–4.1 t/ha with a mean of 2.9 t/ha (MoA Citation2019). The fodder produced from oat can be fed green and the surplus converted into hay and silage for use during the scarcity period (Fekede Citation2004). The green herbage of oat has adequate soluble carbohydrate which can be easily converted into very good silage (Charupriya and Singh Citation2019). In spite of rising land scarcity due to competition between food and forage crops, use of oat forage is increasing owing to reduced pasture lands in the highland mixed crop-livestock system (Muluneh et al. Citation2012). Therefore, enhancing the productivity of oat by developing high-yielding varieties is vital to mitigate the feed shortage problem by producing more on a limited acreage.
The nature and extent of genetic variability existing in the genotypes is of paramount importance for a successful breeding program because higher genetic variability would allow the selection of promising genotypes (Bhatia et al. Citation2017). The degree of heritability and genetic advance generally determine the effectiveness of selection (Kumar et al. Citation2013), while genetic variability is important for continuous genetic improvement (Sandhu et al. Citation2015). Evaluation of oat genotypes, to identify high yielding ones adapted to diverse environmental conditions, is a vital component in oat breeding programs. Oat genotypes for grain purposes have generally been selected for high grain yield and its yield components (Martinez et al. Citation2010), while high biomass yield, along with its better yield-related traits, is the prerequisite for the selection of fodder cultivars (Stevens et al. Citation2004). To this end, exploiting available genetic resources has become very important to select and develop varieties for specific purposes of production.
Yield is a complex quantitative trait governed by polygenic genes which is highly influenced by genetic and environmental factors. As yield is a complex product of yield-related traits and has low heritability, direct selection only for superior yield may not be adequately effective for improvement (Singh Citation2000). Yield-contributing traits, on the other hand, are less complex in inheritance and less influenced by environmental conditions, so selection based on yield components can be effective (Gatti et al. Citation2005). Thus, selection for high yield could be achieved through indirect selection of traits which have high heritability and high associations with grain yield (Sobhaninan et al. Citation2019). Consequently, the phenotypic diversity assessment and estimation of the heritability of desired traits is very important in the breeding program to identify parental materials and select high yielding genotypes (Shariatipour et al. Citation2022). So, assessing the extent of genetic diversity using markers of agro-morphological traits is very essential to exploit the existing variations in oat genotypes. Morphological markers, the simplest and the most direct measures of phenotypes, are rapid and inexpensive, allowing large-scale evaluation of genetic diversity (Habte Citation2018). Therefore, this study was done to (1) estimate the extent of genetic variability, heritability, and expected genetic gain attributable to agro-morphological traits, and (2) suggest an effective selection scheme and specify promising genotypes for future oat breeding programs.
Materials and methods
Description of the study sites
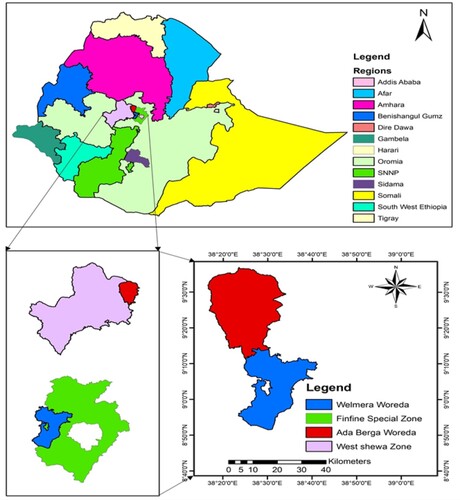
The field experiment was conducted during the main cropping season (June to January) of 2020/21 under rainfed condition at Holetta Agricultural Research Center (HARC) and at the Ada-Berga sub-station of HARC (Figure ). The HARC is situated at 09°03'38.14''N latitude, 38°30'03.12''E longitude, and at an altitude of 2400 meters above sea level (masl). The long term (50-year) average annual rainfall is 1020 mm, and the average maximum and minimum air temperatures are 22.5 and 6.3 °C, respectively. The rainfall in HARC is bimodal and about 85% of the precipitation falls in the period from June to September (the main Meher season), while the remaining 15% falls in the period from March to May (the short Belg season) (Getachew Citation2017). Ada-Berga sub-station of HARC is located at 09°16'09.17''N latitude, 38°22'59.71''E longitude, and at an altitude of 2600 masl. The average annual rainfall of the area is 1225 mm (Direba Citation2012), and the average maximum and minimum air temperatures are 25, and 10 °C, respectively (Alemu Citation2015). This sub-station receives most of its rain during the main (Meher) rainy season that extends from June–September. Small Belg rains during March and May also augment the main rains.
Figure 1. Map of the study sites of Holetta (Welmera Woreda) and Ada-Berga (Ada-Berga Woreda) in Ethiopia.
Experimental materials
The study was conducted using 120 oat genotypes, which included nine released varieties (8251, Bona-bas, Was, SRCPX80Ab2291, SRCPX80Ab2806, Bonsa, Sorataf, Walqaa, and Dumant 2007 portage). The test genotypes were randomly composed of which 98 are world collections which were introduced through the Food and Agricultural Organization (FAO), 20 were introduced via the International Maize and Wheat Improvement Center (CIMMYT), and the remaining 2 were recently introduced from Canada.
Experimental design and procedures
A randomized complete block design (RCBD) replicated three times was used for evaluating the genotypes. The genotype randomization was done using PROC PLAN seed procedures of the SAS general linear model version 9.4 (SAS Citation2012). A uniform seeding rate of 100 kg/ha was used as per the previous recommendation for a pure stand of oat in the highlands of Ethiopia (Astatke Citation1979). The seeds were sown on the 20th of June 2020 at Ada-Berga and the 7th of July 2020 at Holetta. Each genotype was sown to a plot area of 1.6 m2 consisting of 2 rows of 4 m length and 0.4 m width with 0.2 m row spacing. The two rows, with a net plot size of 3.8 m by 0.4 m (1.52 m2) were used for data collection. The recommended fertilizer at the rate of 18/46 kg/ha of N/P2O5 at sowing and 23 kg/ha of N at tillering (Getnet Citation1999; Ashenafi Citation2018) was uniformly applied to all experimental plots. Twice hand weedings was done at both locations to minimize yield reduction due to weed competition for major growth resources. All other crop management practices were uniformly applied to all genotypes as required.
Data collection and measurements
Data on agro-morphological traits were collected either on a plot basis or from five randomly selected plants per plot. A list of the studied 24 agro-morphological traits with their descriptions and sampling methods is indicated in Table .
Table 1. List of studied agro-morphological traits and their descriptions.
Statistical analyses
Analysis of variance
The analysis of variance (ANOVA) procedures of the statistical analysis system (SAS) general linear model (GLM) version 9.4 were used for individual locations and combined across locations (SAS Citation2012). To determine the validity of each location analysis, Bartlett’s test for homogeneity of variance was done by the SAS computer packages prior to computing ANOVA. Moreover, the homogeneity of error variance for combined ANOVA was tested using the F-max method of Hartley (Hartley Citation1950), which is based on the ratio of the larger mean square of error (MSE) from the separate analysis of variance to the smaller MSE. If the larger MSE is not three-fold larger than the smaller MSE, the error variance is considered homogeneous (Gomez and Gomez Citation1984). The combined ANOVA was performed using the PROC GLM procedure of SAS after testing the homogeneity of error variance. A linear random model was used to account for both the genotype and location effects, which were considered random. The mean squares of replication, interaction, and residual were combined to test the location effect. But the genotype random effect was tested against the interaction (genotype x location) mean square while the interaction effect was tested against the residual mean square. The statistical model for analysis of variance of the RCBD design for individual locations is given by:
where Yij is the measured response of genotype j in block i; μ is the grand mean; Bi is the effect of block i; Gi is the effect of genotype j;
is the random error effect of genotype j in block i.
The statistical model for combined analysis of variance of the RCBD design across locations is given by:
where Yijk is the measured response of genotypes j in block i nested at location k;
is the grand mean; Bi(k) is the effect of block i within location k; Gj is the effect of genotype j; Lk is the effect of location k; (GL)jk is the interaction effect between genotype j and location k; and
ijk is the residual or effects of random error.
Estimation of variance components
The total variance components are partitioned into different components using ANOVA by assuming the mean square of each sources of variation is equal to their expected mean squares (Table ), as suggested by Singh and Chaudhary (Citation1977). The variability present in the population is estimated by variance components and coefficient of variation. The combined over-locations mean squares were computed according to the statistical procedures of the SAS and the sources of variations in RCBD design were used to estimate the variance components using the method suggested by Johnson et al. (Citation1955) as follows:
Table 2. Combined analysis of variance (ANOVA) and expected mean squares for the random model of RCBD design.
where is location variance; MSl is the mean square of location; MSgl is the mean square of genotype by location interaction; g is the number of genotype; r is the number of replication;
is replication variance; MSr is the mean square of replication; MSe is the mean square of error;
is genotypic variance; MSg is the mean square of genotype; l is the number of location; σ2gl is genotype by location interaction variance;
is phenotypic variance; and
is environmental variance.
On the other hand, the genotypic coefficient of variation (GCV), phenotypic coefficient of variation (PCV) and environmental coefficient of variation (ECV) were also calculated according to the formula suggested by Singh and Chaudhary (Citation1977). These estimates of variations were classified as low when values were less than 10%, medium when values were between 10 and 20% and high when values were greater than 20% (Johnson et al. Citation1955).
where GCV is the genotypic coefficient of variation; PCV is the phenotypic coefficient of variation; ECV is the environmental coefficient of variation; is genotypic variance;
is phenotypic variance;
is environmental variance; and
is the mean of trait.
Estimation of heritability
The estimate of heritability (h2b) in the broad sense is expressed as a percentage of the ratio of the genotypic variance to the phenotypic variance as described by Allard (Citation1960) and Falconer (Citation1989). According to Singh (Citation2001), the heritability estimates were classified as low when the values were less than 40%; values between 40 and 59% were considered medium; values between 60 and 79 were moderately high, and values greater than 80% were reported as very high, and it was calculated as:
Where h2b is heritability in broad sense; σ2g is genotypic variance; σ2gl is the genotype by location interaction variance; l is the number of location; r is the number of replication; and is environmental variance.
Estimation of genetic advance
The expected genetic advance (GA) for each trait at 5% selection intensity (k = 2.06) was estimated using the method illustrated by Allard (Citation1960). Moreover, expected genetic advance as percent of the mean (GAM) is calculated to compare the extent of the predicted advance of different traits under selection, using the formula developed by Comstock and Robinson (Citation1952). According to Johnson et al. (Citation1955), the estimated GAM values were classified as low when values were less than 10%; values between 10 and 20% were medium; and values greater than 20% were testified as high.
where GA is the genetic advance; K is the standardized selection differential at 5% selection intensity (k = 2.06);
is the square root of phenotypic variance; h2b is heritability in broad sense; GAM is the genetic advance as percent mean; and
is the mean of the population in which selection employed.
Results
Analysis of variance
The pooled analysis of variance revealed that half of the studied traits were significantly influenced by the test locations (Table ). Among the traits, tillers dry weight (TDW), the largest leaf length at forage harvest (LLFH), days to forage harvest (DFH), panicle length at grain harvest (PLGH), and number of spikelets per panicle (NSLPP) varied (P ≤ 0.0001) between locations. Likewise, the number of leaves at forage harvest (NLFP), number of spikes per panicle (NSPP), grain sink filling rate (GSFR), and harvest index (HI) differed (P ≤ 0.01), while differences (P ≤ 0.05) were also noted for days to seed harvest (DSH), straw yield (SY), and grain yield (GY) between locations. The tested genotypes also showed variation (P ≤ 0.0001) for all measured traits. Furthermore, the genotype x location interaction effect displayed significant differences for all traits except PDMY and FYPR. The interactions of genotype x location for economically important yields (FDMY and GY) were crossover showing the genotypes performed inconsistently under diverse locations (data not shown).
Table 3. Mean squares from a combined ANOVA for 24 traits of 120 oat genotypes grown at Holetta and Ada-Berga in 2020/21 cropping season.
Effect of test locations
The results indicated that some of the measured traits were significantly influenced by the test locations (Table ). Among the traits, NLFH, LLFH, NSPP, NSLPP, GSFR, HI, and GY were significantly higher at Holetta compared to Ada-Berga. On the other hand, the genotypes had significantly higher performances in TDW, PLGH, SY, and longer DFH and DSH at Ada-Berga. The rates of accumulation for GY, FDMY, and TBY were higher by 21, 3, and 2% at Holetta compared to Ada-Berga, respectively. The observed GY and TBY were higher by 16 and 1% at Holetta, whereas FDMY and SY were higher by 8 and 7% at Ada-Berga, respectively. Traits such as HI and TSW were higher by 19 and 7% at Holetta compared to Ada-Berga, respectively. On the contrary, the traits like NTPP, PHFH, LDMY, SDMY, PDMY, FYPR, FDMY, PHGH, GFP, TBY, BYPR and TSW were less sensitive to changing environments, indicating the low influence of environmental factors on these traits.
Table 4. Mean performance for 24 traits of 120 oat genotypes grown at Holetta and Ada-Berga in 2020/21 cropping season.
Mean performance of genotypes
The mean performance of the top 5% of forage yielder oat genotypes was compared with the least 5% forage yielder genotypes, the mean of the population, and the mean of nine released varieties for studied traits (Table ). The result revealed that the top forage yielder genotypes were superior to the least forage yielder genotypes, the mean of the population, and the mean of released varieties in NLFH, LLFH, PHFH, LDMY, SDMY, PDMY, FYPR, FDMY, PHGH, PLGH, NSPP, NSLPP, TBY, BYPR, and SY. However, the top forage yielder genotypes were inferior in TDW, GFP, TSW, and HI over the least forage yielder genotypes, the mean of the population, and the mean of released varieties. Similarly, the mean performance of the top 5% of seed yielder oat genotypes were compared with the least 5% seed yielder genotypes, the mean of the population, and the mean of released varieties as explained in Table . The top seed yielder genotypes in this study were superior in TBY, BYPR, GSFR, TSW, HI, and GY over the least seed yielder genotypes, the mean of the population, and the mean of released varieties. On the contrary, the top seed yielder genotypes were inferior in NLFH, LLFH, PHFH, and PHGH over the least seed yielder genotypes, the mean of the population, and the mean of released varieties.
Table 5. Mean comparison of the top 5% forage and seed yielder genotypes with the least yielder 5% genotypes, mean of population and mean of released varieties for 24 traits of oat grown at Holetta and Ada-Berga in 2020/21 cropping season.
The performance of the top 5% of forage yielder genotypes for phenotypic traits is elucidated in Table . The results indicated that the top 5% of forage yielder genotypes had different characteristics in the studied traits. The first top forage yielder genotype (S-122) had higher PHFH, SDMY, PDMY, FYPR, NSLPP, TBY, BYPR, SY, and GY. The genotype (T-1926513) which ranked as the second top forage yielder produced greater LDMY and PLGH, while the third top forage yielder genotype (1480) was superior in GSFR and GY. The attributes of the fourth top forage yielder genotype (1677) were higher in NTPP, NLFH, LLFH, DFH, and TSW. Higher PHGH, NSPP, and GY were the characteristics of the fifth top forage yielder genotype (Bona-bas), while the sixth top forage yielder genotype (1674) showed higher TDW, DSH, GFP, HI, and GY. Except for the second and fourth top forage yielder genotypes, the remaining top 5% forage yielder genotypes produced comparable GY.
Table 6. Mean performance of the top 5% forage and seed yielder genotypes for 24 traits of oat grown at Holetta and Ada-Berga in 2020/21 cropping season.
The top 5% of seed yielder genotypes for phenotypic trait performance is also displayed in Table . The result revealed that there was a considerable variation among the top 5% seed yielder genotypes for measured traits. The first top seed yielder genotype (SRCPX80Ab2806) had higher GFP and HI. The second top seed yielder genotype (SRCPX80Ab2267) displayed intermediate characteristics for all traits except NTPP, TDW, LDMY, PDMY, FYPR, and FDMY. These mentioned traits generally showed lower mean values in the second top seed yielder genotypes compared to other top 5% seed yielder genotypes. The genotype (715) which ranked as the third top seed yielder was superior in NLFH, LLFH, PHFH, DFH, LDMY, SDMY, PDMY, FYPR, FDMY, PHGH, PLGH, NSPP, TBY, and GSFR. Likewise, greater TDW, NSLPP, BYPR, and SY were the characteristics of the fourth top seed yielder genotype (1463), while the fifth top seed yielder genotype (SRCPX80Ab2291) produced higher NTPP and DSH. The attributes of sixth (A-505) top seed yielder genotype were greater in TSW and DSH. The fifth and sixth high seed yielder genotypes required comparable duration for seed maturity and are generally classified as late-maturing genotypes.
Variance components and coefficient of variation
The study revealed that the values of phenotypic variance were higher than the corresponding genotypic variance for all studied traits (Table ). Furthermore, the values of phenotypic variance were higher than the corresponding genotype x location interaction variance in all traits under consideration. The values of phenotypic variance were also higher than the corresponding environmental variances in TDW, NLFH, PHFH, DFH, PHGH, PLGH, DSH, GFP, NSLPP, GSFR, TSW, and HI. On the other hand, the values of genotypic variance were higher than the corresponding genotype x location interaction variance in all considered traits except LLFH, GFP, TBY, and GSFR. Similarly, the values of genotypic variance were higher than the corresponding environmental variance in NLFH, DFH, PHGH, PLGH, DSH, GFP, NSLPP, TSW and HI, while 15 (about 63%) of the studied traits had higher environmental variance compared to genotypic variance. Fodder and grain yields were generally controlled by traits of yield components and were more influenced by environmental factors than yield related traits.
Table 7. Components of variance and coefficient of variation for 24 traits of 120 oat genotypes grown at Holetta and Ada-Berga in 2020/21 cropping season.
The phenotypic coefficient of variation (PCV), genotypic coefficient of variation (GCV), and environmental coefficient of variation (ECV) in oat genotypes for the studied traits are described in Table . The result indicated that 16.7, 62.5 and 20.8% of the studied traits showed high, medium, and low PCV, respectively. The PCV values were generally higher than the corresponding GCV values in all measured traits. The highest PCV estimate was recorded for GSFR (25.03%) followed by NSLPP (24.56%), GY (22.72%), and HI (20.20%) while the lowest (5.97%) was recorded for DSH. Furthermore, the PCV values were comparatively higher than the corresponding ECV values in TDW, NLFH, PHFH, DFH, PHGH, PLGH, DSH, GFP, NSLPP, GSFR, TSW, and HI. Likewise, wide variability was observed in GCV and the values ranged from 5.22% for DSH to 20.00% for NSLPP. Among the studied traits, 62.5% of the traits had medium GCV while 37.5% had low GCV. The GCV estimates were relatively higher than the corresponding ECV values in NLFH, DFH, PHGH, PLGH, DSH, GFP, NSLPP, TSW, and HI.
Heritability and genetic advance
The estimate of heritability in a broad sense (h2b) for the studied agro-morphological traits in oat genotypes is presented in Table . The values of heritability varied widely and ranged from 44.3% to 94.7% for considered phenotypic traits. The result revealed that very high heritability (>80%) estimates were recorded for DFH (94.7%), NLFH (86.4%), TSW (86.1%), HI (80.9%), PHGH (80.9%), and PLGH (80.9%). The traits which showed moderately high heritability (60–79%) estimates were PHFH (79.1%), DSH (76.4%), FYPR (69.7%), NSPP (68.8%), NSLPP (66.3%), TDW (65.9%), FDMY (64.4%), GY (64.2%), PDMY (63.8%), and SDMY (62.9%). The remaining eight (about 33%) of the studied traits had medium heritability (40–59%) estimates which ranged from 44.3% for TBY to 59.6% for LDMY.
Table 8. Heritability, genetic advance, and genetic advance as percent of mean for 24 traits of 120 oat genotypes grown at Holetta and Ada-Berga in 2020/21 cropping season.
The genetic advance as percent of the means (GAM) for measured phenotypic traits in oat genotypes is also illustrated in Table . The result indicated that medium values of GAM produced traits were higher in number than traits having high GAM estimates. Among the studied traits, seven (about 29.2%) of the studied traits showed high GAM values while sixteen (about 66.7%) and one of the studied traits had moderate and low GAM values, respectively. The values of high GAM (>20%) were recorded for NSLPP (28.7%), GSFR (26.2%), GY (26.1%), HI (26.0%), PLGH (21.9%), FYPR (21.7%), and PDMY (21.3%). Similarly, medium GAM (10–20%) values were noted for NLFH (19.9%), FDMY (19.3%), BYPR (19.2%), LDMY (19.0%), NTPP (18.7%), SDMY (18.3%), SY (18.1%), NSPP (16.0%), GFP (14.1%), TBY (13.9%), PHGH (12.3%), TDW (12.2%), PHFH (12.1%), LLFH (11.7%), TSW (11.2%), and DFH (10.4). But, the estimate of GAM reported for DSH was below 10% indicating this trait had low GAM.
Discussion
Effect of location, genotype, and their interactions
In this study, a wide range of variations were observed among locations, genotypes, and genotype x location interaction for all or some of the measured traits. Out of the 24 studied traits, 12 traits in oat genotypes that were significantly influenced by the test locations might be due to significant variations in edaphic and climatic conditions between the two locations. The performance of genotypes often fluctuates across locations due to wide variations among locations. Accordingly, evaluation of genotypes across locations is vital to select consistently performing genotypes under diverse environmental conditions. The effect of locations on the performance of locally collected and introduced oat genotypes was also reported (Ashenafi Citation2018; Gezahagn et al. Citation2021). Moreover, the performance of genotypes usually varies over years due to variation in amount and distribution of precipitation and minimum and maximum temperatures. Thus, evaluation of genotypes over years is also important to identify high yielding with consistently performing genotypes over years. The mean squares of genotypes from the analysis of variance also indicated that there was a wide variation among the genotypes for measured traits. The great variations observed among the studied genotypes indicate the presence of remarkable inherent variability among oat genotypes for the studied traits. The existence of substantial variations was also reported in oat genotypes by different scholars (Fekede Citation2004; Tanvi Citation2016; Ashenafi Citation2018; Wagh Citation2018; Gezahagn et al. Citation2021).
The genotypes x location interactions were found to be significant for TDW, NLFH, LLFH, DFH, PLGH, DSH, NSPP, NSLPP, GSFR, SY, HI, and GY. This is due to both the differential response of genotypes to the test locations and the influence of the test locations on the genotypes differently. However, the observed significant interactions for the remaining ten (about 45%) of the studied traits were only due to the differential response of genotypes to the test locations. The performance of a genotype is generally expected to vary under diverse environments due to variations in growing conditions (Gemechu Citation2012; Mussa Citation2017; Habte Citation2018; Wondimu et al. Citation2023). The observed crossover interactions in FDMY and GY were owing to variations in genotypic performance with changing environments. The crossover interaction indicates the change in the rank order of genotypes across environments, and it can be managed either by selecting the best-performing genotypes for each environment or avoiding them by identifying high-yielding and relatively stable genotypes across environments (Ceccarelli Citation1989; Moghaddam and Pourdad Citation2009). When genotypes are tested under various environments, the performance of genotypes fluctuates frequently, and genotypes that perform best in a particular environment may perform poorly under diverse environmental conditions (Ceccarelli Citation1997; Gemechu Citation2012; Temesgen et al. Citation2022; Wondimu et al. Citation2023).
Performance of genotypes
Plant height is one of the important traits, which has a significant contribution for forage yield improvement, and it generally varies among oat genotypes (Fekede Citation2004; Ashenafi Citation2018). The observed taller plant heights in the top 5% of forage yielder genotypes might be due to the inherent genetic variation, strong light competition, and partitioning of more assimilates for stem elongation. This result is also in close conformity with the findings of Steiner (Citation1986); Ballare et al. (Citation1990); and Irfan et al. (Citation2016). The higher FDMY and GY revealed in the top 5% of forage yielder genotypes might be due to better radiation-use efficiency, greater accumulation of dry matter, and better nutrient uptake and use efficiency. The existence of better yield attributes in the top 5% of forage yielder genotypes generally leads to greater FDMY and GY, which is mainly due to better source-sink relationship, and this result is also in agreement with that of Siloriya et al. (Citation2014). The contribution of NTPP for forage yield in the top 5% of forage yielder genotypes was moderately lower than the least 5% of forage yielder genotypes. The reason might be related to the genotypes being small-seeded, which is reflected by the small weight of TSW that may use large numbers of seed per unit area of land at planting. This high population density can hamper the tillering performance of genotypes owing to high intra and inter-tillers competition for growth resources. Fekede (Citation2004) reported that oat genotypes may express their tillering performances under low plant population, which may be possible by considering TSW to establish the seeding rate for each genotype. Higher NLFH and LLFH in the top 5% of forage yielder genotypes provide better canopy cover at the early growth stage, which results in the efficient interception of photosynthetically active radiation for photosynthesis. Differences in the number of leaves (Wagh, 2018; Tessema and Getinet Citation2020) and leaf length (Tanvi Citation2016; Atman Citation2017) were also reported in oat genotypes.
Tillering performance of oat genotypes varies with cultivars, environmental and management conditions. Low tillering performance in the top 5% of seed yielder genotypes could be mainly due to the existence of low inherent tillering potential in the genotypes. Although the NTPP were relatively higher in the least 5% of seed yielder genotypes, the GY performances in these genotypes were lower. This might be due to the production of a high number of non-panicle-bearing tillers, which leads to a decrease in grain yield. Early canopy cover associated with rapidly attaining the optimum leaf area index and maintaining it for a longer time would be helpful to enhance grain yield by creating favorable conditions for spikelet and floret formation and a longer grain filling period (Peltonen-Sainio Citation1999). The plant height varied among genotypes, and a shorter plant height was recorded in the top seed yielder genotypes. The research findings also indicated that high grain producing genotypes had generally shorter plant heights (Lynch and Frey Citation1993; Reynolds et al. Citation2009; Tao et al. Citation2021). The observed seed yield in the top 5% of seed yielder genotypes was relatively higher, which might be related to better use of growth resources for photosynthesis and efficient translocation of synthesized assimilates and mobilization of stored food to the grain during the grain filling period. A shorter growth period during vegetative growth ensures more growth resources are reserved for the reproductive phase, which leads to higher GY due to the efficient utilization of growth resources for yield formation (Tao et al. Citation2021). Variations in HI between the top and least 5% of seed yielder genotypes were due to the differences in GY and TBY, and this result is also supported by Dreccer et al. (Citation2009) and Siloriya et al. (Citation2014). Higher yield performances (forage, grain, straw and biological yields) were observed in the top 5% of genotypes, which generally indicates the presence of a high level of oat improvements through selection.
Phenotypic and genotypic coefficient of variations
In the current study, the magnitudes of phenotypic variances were comparatively higher than the corresponding genotypic and the interaction of genotype x location variances for all studied agro-morphological traits. This indicates that the extent of environmental influence is relatively high on the expression of these traits. This result is also in line with the finding of Ashenafi (Citation2018), who reported that the phenotypic variance in all studied traits is higher than the genotypic and interaction variances in oat genotypes. The magnitudes of genotype x location interaction variances were relatively higher than the respective genotypic variances in LLFH, GFP, TBY and GSFR. This suggests that location effect caused a substantial variation in the aforementioned traits compared to other traits. When the interaction variance for a trait is greater than the genotypic variance, selection of the best genotypes based on this trait should be performed depending on target environment (Tahmasebi et al. Citation2014). The values of genotypic variances in nine (about 38%) of the studied traits were relatively higher than the corresponding environmental variances, indicating that the contribution of the environment to the expression of these traits was relatively lower when compared to the remaining studied traits.
The observed wider variability on phenotypic and genotypic coefficients of variation generally indicates the existence of substantial variability in the studied traits. The study illustrated that 20.8 and 37.5% of the studied traits had lower PCV and GCV estimates, respectively; suggesting selection based on these traits may not be effective. However, 79.2 and 62.5% of the studied traits had high to moderate values of PCV and GCV, respectively; indicating that the larger proportion of variability was contributed by the genetic component but less by the environment. Thus, selection may be effective based on the phenotypic performance of these traits. Among the studied traits, NSLPP, GSFR, GY, and HI had high PCV values, but these respective traits gave moderate GCV values. Similarly, Singh and Singh (Citation2011); Bind et al. (Citation2016); Atman (Citation2017); and Harshita (Citation2018) have reported low PCV and GCV values for DFH and DSH in oat.
The PCV values for all measured traits were comparatively higher than the corresponding GCV values, indicating the greater influence of the environment on the expression of these traits. Similar results were also reported on various traits in oat genotypes by different scholars (Singh and Singh Citation2011; Bind et al. Citation2016; Kumar et al. Citation2016; Atman Citation2017; Ashenafi Citation2018). The higher PCV values for forage dry matter yield was also reported for grass grown under non-stress and drought stress conditions (Shariatipour et al. Citation2022). The estimates of ECV were relatively low for eight (about 33%) of the studied traits, showing these traits were less sensitive to environmental factors. On the contrary, the influence of environment in nine (about 38%) of the studied traits exhibited high (>20%) estimates of ECV. The influence of environment on yield traits (FDMY, TBY, SY, and GY) and botanical fractions yields (LDMY, SDMY, and PDMY) was higher compared to other traits. The observed moderate to high PCV and moderate GCV, accompanied by the corresponding low to moderate ECV estimates for NLFH, PLGH, NSPP, and HI, indicated that improvement in these traits could be achieved through selection. The estimates of PCV and GCV are always high when the population has considerable genetic variability, and their high values provide a wide scope of selection based on the phenotypic performance of these traits for improvement (Yadav Citation2000; Khan et al. Citation2009; Habte et al. Citation2015).
Although the estimates of PCV were greater than GCV, the differences between high to moderate PCV and the respective moderate GCV were relatively lower in magnitude for NLFH (1.06%), PLGH (1.71%), HI (2.03%), and NSPP (2.30%). The lower values indicated that these traits had relatively high exploitable inherent genetic variability and the phenotypic performance was less influenced by environmental factors. Therefore, selection based on phenotypic performance would be an effective way to bring about considerable improvement in these traits. This result is also in agreement with the findings of Singh (Citation1999) and Surje and De (Citation2014). On the contrary, slightly wider ranges between high to moderate PCV and the corresponding moderate GCV were observed for GSFR (6.73%) and NTPP (4.83%), suggesting that the influence of the environment on these traits is high and selection based on the phenotypic performance of these traits may not be effective for genetic improvement.
Heritability and genetic gains
The study revealed that the estimated heritability, in broad sense, generally exhibited considerable variability for measured phenotypic traits. This wide range of variability in the studied traits indicated the possibility of high genetic improvement of traits under consideration because the extent of wide variability virtually offers better scope for selection. The tested oat genotypes had a very high degree of heritability in DFH, NLFH, TSW, PHGH, PLGH, and HI, while moderately high heritability estimates were recorded for PHFH, DSH, FYPR, NSPP, NSLPP, TDW, FDMY, GY, PDMY, and SDMY. This indicates the influence of environmental factors on the expression of these traits was relatively small. Consequently, the expressed phenotypic performance was manifested mainly due to the substantial effect of the genetic factor. Hence, significant attention should be given to these particular transmissible traits to make selection effective for oat improvement. The high heritability estimates observed in this study were also reported by Atman (Citation2017) and Bind et al. (Citation2016), who observed high heritability estimates in one or more of their studied traits in oat genotypes. The phenotypic based selection could be effective for yield improvement when the traits have moderate to high heritability (Shariatipour et al. Citation2022). The influence of environmental factors on the phenotypes is relatively low for traits having a very high degree of heritability, and selection based on these traits might be effective due to the presence of high additive gene action on the expression of these traits (Rosmaina et al. Citation2016).
The estimates of heritability were medium for LDMY, GFP, BYPR, SY, GSFR, NTPP, LLFH, and TBY. This medium heritability of traits indicated that the environmental effect was relatively high on the expression of these traits, and selection based on the phenotypic performance of these traits may not be effective for improvement. Singh (Citation1993) also reported that estimates of medium to low heritability make selection considerably difficult due to the significant masking effect of the environment on the genotypic effects. The heritability estimates in this study were generally lower than those reported from a single environment (Tanvi Citation2016; Atman Citation2017; Harshita Citation2018; Wagh Citation2018). The observed low heritability estimates in the current study might be mainly due to the presence of significant genotype x location interactions in 22 (about 92%) of the studied traits. Ashenafi (Citation2018) also reported lower estimates of heritability in oat genotypes tested at two locations in Ethiopia. The existence of high genotype by year interaction for grain yield could be one of the reasons for low heritability of grain yield compared to other traits (Sobhaninan et al. Citation2019). Shariatipour et al. (Citation2022) also pointed out that the heritability estimates for forage dry matter yield under non-stress condition is relatively higher that drought stress condition indicating the effects of environments are remarkable on the heritability of the trait. The heritability of grain yield reduced under drought stress conditions compared to optimum growing condition (Sobhaninan et al. Citation2019).
The estimates of GA and GAM in the present study had wide variations among the observed traits, suggesting the existence of considerable expected genetic gain in oat genotypes for improvement. Based on the estimation of genetic gain in the current study, whenever we select the best 5% of high yielding genotypes as parents, the mean performance of the offspring is expected to be improved. Accordingly, the genotypic performance of the new population (progeny) is expected to be improved from 20.5–24.5 t/ha in FDMY; 16.0–18.9 t/ha in SY; 23.2–26.4 t/ha in TBY; and 7.2–9.1 t/ha in GY. Similarly, improvements in FYPR (161.3–196.3 kg/ha/day), BYPR (130.6–155.7 kg/ha/day), GSFR (107.8–136.0 kg/ha/day), PHFH (123.2–138.1 cm), TSW (48.4–53.8 g), and HI (31.3–39.5%) could be expected. All the studied traits had high to medium GAM estimates, except for DSH and this is in line with that of Atman (Citation2017) and Harshita (Citation2018), who reported high to medium GAM, in one or more their considered traits in oat. High expected genetic advance confirmed the relatively greater involvement of the additive gene action component indicating that selection based on phenotypic performance might be effective for improvement.
Selection of traits for yield improvement
Selection based on broad sense heritability alone may not be predictive, since the broad sense heritability is based on the total genetic variation, which involves additive, dominance, and epistatic variances. Thus, estimates of heritability coupled with genetic advance are more effective in predicting the genetic gain under selection than heritability alone (Singh Citation1999; Bicer and Sakar Citation2004; Singh and Singh Citation2009; Kapoor et al. Citation2011; Chakraborty et al. Citation2014; Charupriya and Singh Citation2019). Traits showing high heritability might not necessarily lead to high genetic gain (Johnson et al. Citation1955). Estimates of very high to moderately high heritability accompanied by high GAM were found in HI, PLGH, FYPR, PDMY, NSLPP, and GY. Traits with such high heritability in conjunction with high genetic advance are dominated with additive gene effects thereby selection based on the phenotypic performance of these traits would be promising for improvement. High heritability in combination with high genetic advance resulted in better genetic gain, implying that phenotypic selection can be an effective approach for improving of traits under consideration (Johnson et al. Citation1955).
On the other hand, very high to moderately high heritability estimates associated with medium GAM were observed in DFH, NLFH, PHGH, TDW, PHFH, SDMY, FDMY, NSPP, and TSW. These traits are most likely governed by both comparable additive and non-additive gene actions for the manifestation of phenotypic performance. The trait DSH had moderately high heritability along with low GAM indicating greater influence of the environment on the expression of this trait. This is due to the predominant nature of the non-additive gene action and hence selection based on phenotypic performance of this trait may not be effective for improving the genetic gain in oat genotypes. The traits which had very high to moderately high heritability in combination with high to medium GAM estimates in the present study suggest the extent of genetic gain through phenotypic selection would be reliable and effective for genetic improvement (Johnson et al. Citation1955; Burton and DeVane Citation1953).
Conclusion
The results of this study demonstrated the existence of considerable variation among 120 oat genotypes evaluated based on agro-morphological traits at two locations in the central highlands of Ethiopia. Estimates of very high to moderately high heritability accompanied by high to moderate genetic advance and variability were observed in FDMY, NLFH, SDMY, FYPR, GY, NSPP, PLGH, and HI, indicating these traits were controlled more by additive gene action. This indicates that phenotypic-based genetic selection on these traits could be reliable for improvement. Selection of genotypes based on high FDMY coupled with better NLFH, SDMY, and FYPR could be effective for fodder yield improvement in oat genotypes. On the other hand, grain yield improvement in oat genotypes could be effective through selections made on genotypes of high GY along with better HI, PLGH, and NSPP. For improvements on SY and TBY, selection of genotypes having higher respective yields along with better BYPR would be effective. Accordingly, genotypes such as S-122, T-1926513, 1480, 1677, Bona-bas, and 1674, had high FDMY along with better NLFH, SDMY, and FYPR. Among high FDMY-producing genotypes, 1480, S-122, Bona-bas, and 1674 genotypes also produced better GY. On the other hand, genotypes SRCPX80Ab2806, SRCPX80Ab2267, 715, 1463, SRCPX80Ab2291, and A-505 produced high GY along with better HI, PLGH, and NSPP. Out of high GY-producing genotypes, 715, 1463, SRCPX80Ab2806, and A-505 genotypes also gave better fodder yield. Therefore, such genotypes could be selected for both direct production to enhance the current productivity of fodder and grain yields and for further evaluation under diverse environmental conditions for commercial release. Moreover, some of the selected genotypes in this study could be used as potential parents for improving the genetic gain in oat breeding programs.
Authors’ contributions statement
Conceptualization and design of the work was made by G.K., W.W., F.F. and H.J.; Data investigation, G.K.; Data analysis using software, G.K.; Drafting of the paper, G.K.; Revising it critically for intellectual content, G.K., W.W., F.F. and H.J.; and the final approval of the version to be published G.K., W.W., F.F. and H.J. All authors agree to be accountable for all aspects of the work.
Acknowledgments
The assistance obtained from the Ethiopian Institute of Agricultural Research (EIAR), the livestock research directorate of EIAR, University of Florida (UF), Holetta Agricultural Research Center (HARC), the feeds and nutrition research program of HARC, and colleagues working on forage research at HARC are highly appreciated. Technical support received from Mr. Gebremedhin Hagos and Mr. Mulisa Faji during the experiment execution is also sincerely acknowledged.
Disclosure statement
No potential conflict of interest was reported by the author(s).
Permission for the study
Staff members of the Ethiopian Institute of Agricultural Research based at Holetta Agricultural Research Center are exempted from requiring specific permission to undertake research at the center and its sub-station fields. Therefore no specific permission was required to do this research.
Data availability statement
The data supporting the findings of this study are in the figshare repository and can be accessed using the link: http://www.doi.org/10.6084/m9.figshare.21828840.
Additional information
Funding
References
- Alemu T. 2015. Assessing potable water coverage (the case of Ada-Berga district). Thesis project work report for master of art in rural development. St. Mary’s University.
- Allard RW. 1960. Principles of plant breeding. New York: Wiley and Sons. Inc.
- Ashenafi A. 2018. Genetic diversity, relation between characters, and aluminum toxicity tolerance of Avena species from Ethiopia. Doctoral Dissertation. Addis Ababa, University.
- Astatke H. 1979. Forage crops and pasture management in the highlands of Ethiopia. Forage and Range Bulletin No. 2: IAR (Institute of Agricultural Research), Addis Ababa, Ethiopia.
- Atman P. 2017. Evaluation of oat (Avena sativa L.) genotypes for yield and quality characters. MSc thesis. Haryana, India: College of Agriculture.
- Ballare CL, Scopel AL, Sanchez RA. 1990. Farred radiation reflected from adjacent leaves: an early signal of competition in plant canopies. Science. 247:329–332. doi:10.1126/science.247.4940.329.
- Bhatia R, Dey SS, Kumar R. 2017. Genetic divergence studies in tulip (Tulipa gesneriana L.). Indian J Horticulture. 74(4):562–567. doi:10.5958/0974-0112.2017.00108.6.
- Bicer T, Sakar D. 2004. Genetic variability and heritability for grain yield and other characters in Lentil. J Bio Sci. 4(2):2016–2218.
- Bind H, Bharti B, Pandey MK, Kumar S, Vishwanath D, Kerkhi SA. 2016. Genetic variability, heritability and genetic advance studies for different characters on green fodder yield in oat (Avena sativa L.). Agric Sci Dig. 36(2):88–91.
- Burton GW, DeVane EW. 1953. Estimating heritability in tall fescue (Festuca arundinacea) from replicated clonal material. Agron J. 45:478–481. doi:10.2134/agronj1953.00021962004500100005x.
- Ceccarelli S. 1989. Wide adaptation: How wide? Euphytica. 40:197–205. doi:10.1007/BF00024512.
- Ceccarelli S. 1997. Adaptation to low/high input cultivation. In: Tigerstedt P.M.A., editor. Adaptation in plant breeding. The Netherlands: Kluwer Academic Publishers; p. 225–236.
- Chakraborty J, Arora RN, Joshi UN, Chhabra AK. 2014. Evaluation of Avena species for yield, quality attributes and disease reaction. Forage Research. 39(4):179–184.
- Charupriya C, Singh SK. 2019. Genetic variability, heritability and genetic advance studies in oat (Avena sativa L.). Int J Chem Stud. 7(1):992–994.
- Comstock RE, Robinson HF. 1952. Estimation of average dominance of genes. In: Heterosis. Ames: Iowa State College Press; p. 494–516.
- Direba H. 2012. Survival reproductive and productive performance of pure jersey cattle at Adea Berga dairy research center in the central highlands of Ethiopia. MSc. thesis. Vienna, Austria: University of Natural Resources and Life Sciences.
- Dreccer MF, Van Herwaarden AF, Chapman SC. 2009. Grain number and grain weight in wheat lines contrasting for stem water soluble carbohydrate concentration. Field Crops Res. 112(1):43–54. doi:10.1016/j.fcr.2009.02.006.
- Esvelt KK, Huang YF, Bekele WA, Obert DE, Babiker E, Beattie AD, Bjørnstad Å, Bonman JM, Carson ML, Chao S. 2016. Population genomics related to adaptation in elite oat germplasm. Plant Genome. 9(2):1–12.
- Falconer DS. 1989. Introduction to quantitative genetics, 3rd ed. London, England: Longman.
- FAO. 2012. Production statistics, food and agriculture organization. Rome, Italy.
- Fekede F. 2004. Evaluation of potential forage production qualities of selected oats (Avena sativa L.) genotypes. M.Sc. Thesis. Ethiopia: Alemaya University of Agriculture.
- Gatti I, Anido FL, Vanina C, Asprelli P. 2005. Country, E. Heritability and expected selection response for yield traits in balanced asparagus. Genet Mol Res. 4(1):67–73.
- Gemechu K. 2012. Genetic potential and limitations of Ethiopian chickpea (Cicer arietinum L.) Germplasm for improving attributes of symbiotic nitrogen fixation, phosphorus uptake and Use efficiency, and adzuki bean beetle (Callosobruchus chinensis L.) Resistance. PhD thesis, Addis Ababa, University.
- Getachew A. 2017. Biochar, compost and biochar-compost: effects on crop performance, soil quality and greenhouse Gas emissions in tropical agricultural soils. Ph.D. dissertation. Cairns, Australia: James Cook University.
- Getnet A. 1999. Feed resource assessment and evaluation of forage yield, quality and intake of oats and vetches grown in the highlands of Ethiopia. M.Sc. Thesis. Uppsala: Swedish University of Agricultural Science.
- Getnet A, Fekede F, Abreham G, Muluneh M. 2004. Characterization of selected oats varieties for their important production traits in the highlands of Ethiopia. In Proceedings of farm animal biodiversity in Ethiopia: status and prospects, Addis Ababa, Ethiopia, August 28–30, 2003.
- Gezahagn K, Mulisa F, Fekede F, Kedir M, Getnet A, Diriba G, Muluneh M, Mesfin D, Mengistu A, Alemayehu M, et al. 2021. Yield and nutritional quality of Oat (Avena sativa) genotypes under vertisols conditions in the central highlands of Ethiopia. J Agric Environ Sci. 6(2):1–16.
- Gomez KA, Gomez AA. 1984. Statistical procedure for agricultural research, 2nd ed. International Rice Research Institute. John Wiley and Sons Inc.
- Habte J. 2018. Analyses of phenotypic and molecular diversity, genotype by environment interaction and food-feed traits in tef [Eragrostis tef (Zucc.) Trotter]. PhD. Thesis. Ethiopia: Addis Ababa University.
- Habte J, Kebebew A, Zerihun T. 2015. Grain yield variation and association of major traits in brown-seeded genotypes of tef [Eragrostis tef (Zucc.) Trotter]. Agricult Food Security. L4:7.
- Harshita N. 2018. Morphological characterization, evaluation and seed quality assessment of oat germplasm. MSc thesis. Uttarakhand, India: G.B. Plant University of Agriculture and Technology.
- Hartley HO. 1950. The maximum F-ratio as a short cut test for heterogeneity of variances. Biometrika. 37:308–312.
- Irfan M, Ansar M, Sher A, Wasaya A, Sattar A. 2016. Improving forage yield and morphology of oat varieties through various row spacing and nitrogen application. Journal of Animal & Plant Sciences. 26(6):1718–1724.
- Johnson HW, Robinson HF, Comstock RE. 1955. Estimates of genetic and environmental variability in soybeans. Agron J. 47:314–318. doi:10.2134/agronj1955.00021962004700070009x.
- Kapoor R, Bajaj RK, Navjot S, Simarjit K. 2011. Correlation and path coefficient analysis in oat. Int J Plant Breeding. 5(2):133–137.
- Khan A, Kabir MV, Alam MM. 2009. Variability, correlation and path analysis of yield and yield components of pointed gourd. J Agricult Rural Develop. 7(1):93–98.
- Kumar P, Phogat DS, Bhukkar A. 2016. Genetic diversity analysis in oat. Forage Res. 42(2):96–100.
- Kumar SR, Arumugam T, Anandakumar CR, Permalakshmi V. 2013. Genetic variability for quantitative and qualitative characters in Brinjal (Solanum melongena L.). Afri J Agric Res. 8(39):4956–4959.
- Ladizinsky G. 2012. Studies in Oat evolution: Oat morphology and taxonomy. London, England: Springer.
- Lynch P, Frey K. 1993. Genetic improvement in agronomic and physiological traits of oat since 1914. Crop Sci. 33:984–988. doi:10.2135/cropsci1993.0011183X003300050022x.
- Martinez MF, Arelovich HM, Wehrhahne LN. 2010. Grain yield, nutrient content and lipid profile of oat genotypes grown in a semiarid environment. Field Crops Res. 116:92–100. doi:10.1016/j.fcr.2009.11.018.
- MoA. 2019. Ministry of Agriculture. Plant variety release, protection and seed quality control directorate. Crop Variety Register, Issue No. 22, 2019. Addis Ababa, Ethiopia.
- Moghaddam MJ, Pourdad SS. 2009. Comparison of parametric and non-parametric methods for analysing genotype×environment interactions in safflower (Carthamus tinctorius L.). J Agric Sci. 147:601–612. doi:10.1017/S0021859609990050.
- Monica JK, Mehta AK, Bilaiya SK, Prakarti P. 2017. Estimation of genetic diversity among genotypes of fodder oat based on principal component analysis. Int J Bio-Resource Stress Manage. 8(6):807–810.
- Muluneh M, Getnet A, Fekede F, Gezahagn K, Tadesse T. 2012. Strengthening forage seed supply through farmers-based seed production. In proceedings of forage seed research and development in Ethiopia, Addis Ababa, Ethiopia, May 12–14, 2011.
- Mussa J. 2017. Genetic improvement of adapted Ethiopian chickpea (Cicer arietinum L.) cultivar for drought tolerance through conventional and marker assisted backcross breeding methods. PhD. Thesis. Ethiopia: Addis Ababa University.
- Peltonen-Sainio P. 1999. Growth and development of Oat with special reference to source-sink interaction and productivity. In: Smith D., Hamel C., editor. Crop yield, physiology and processes. Berlin Heidelberg: Springer-Verlag.
- Peterson DM, Wesenberg DM, Burrup DE, Erickson CA. 2005. Relationships among agronomic traits and grain composition in oat genotypes grown in different environments. Crop Sci. 45(4):1249–1255. doi:10.2135/cropsci2004.0063.
- Reynolds M, Foulkes MJ, Slafer GA, Berry P, Parry MA, Snape JW, Angus WJ. 2009. Raising yield potential in wheat. J Exp Bot. 60:1899–1918. doi:10.1093/jxb/erp016.
- Rosmaina S, Hasrol YF, Juliyanti Z. 2016. Estimation of variability, heritability, and genetic advance among local chili pepper genotypes cultivated in peat lands. Bulgarian J. Agric Sci Agric Acad. 22(3):431–436.
- Ruwali Y, Verma JS, Kumar L. 2013. Comparative genetic diversity analysis of oat (Avena sativa L.) by microsatellite markers and morphological rainfed expressions. Afr J Biotechnol. 12(22):3414–3424.
- Sandhu SS, Brar PS, Dhall RK. 2015. Variability of agronomic and quality characteristics of garlic (Allium sativum L.) ecotypes. J Genet Plant Breeding. 47(2):133–142.
- SAS (Statistical Analysis System). 2012. SAS/STAT guide for personal computers. version 9.4 editions. Cary, NC, USA: SAS Institute Inc.
- Shariatipour N, Heidari B, Shams Z, Richards C. 2022. Assessing the potential of native ecotypes of Poa pratensis L. for forage yield and phytochemical compositions under water deficit conditions. Sci Rep. 12:1121. doi:10.1038/s41598-022-05024-1.
- Siloriya PN, Rathi GS, Meena VD. 2014. Relative performance of oat (Avena sativa L.) varieties for their growth and seed yield. African J Agricult Res. 9(3):425–431. doi:10.5897/AJAR2013.8165.
- Singh BD. 1993. Plant breeding. 5th ed. Ludhiana: Kalyani Publishers; p. 104.
- Singh BD. 2000. Plant breeding: Principles and methods. New Delhi: Kalyani Publishers.
- Singh BD. 2001. Plant breeding: Principles and methods. New Delhi: Kalyani Publishers.
- Singh JM. 1999. Variability, heritability and genetic advance in oat (Avena sativa L.). Environ ECO. 17(4):1011–1012.
- Singh RK, Chaudhary BD. 1977. Biometrical methods in quantitative genetic analysis. Biometrical methods in quantitative genetic analysis. New Delhi: Kalyani Publishers; p. 215–218.
- Singh SB, Singh AK. 2009. Genetic variability, character association and path analysis for green fodder yield and its component characters in oat (Avena sativa). Progres Res. 4:159–162.
- Singh SB, Singh AK. 2011. Genetic variability and divergence analysis in oat (Avena sativa) under rainfed environment of intermediate Himalayan Hills. Indian J Plant Genetic Resour. 24(1):56–61.
- Sobhaninan N, Heidari B, Tahmasebi S, Dadkhodaie A, Lynne CM. 2019. Response of quantitative and physiological traits to drought stress in the SeriM82/Babax wheat population. Euphytica. 215:32. doi:10.1007/s10681-019-2357-x.
- Steiner JL. 1986. Dryland grain sorghum water Use, light interception, and growth responses to planting geometry. Agron J. 78:720–726. doi:10.2134/agronj1986.00021962007800040032x.
- Stevens EJ, Armstrong KW, Bezar HJ, Griffin WB, Hampton JB. 2004. Fodder oats: an overview. In: Fodder oat. A World Overview, Plant Production and Protection, FOA, Rome, Italy, Series No 33; p. 11–18.
- Surje DT, De DK. 2014. Correlation coefficient study in oat (Avena sativa L.) genotypes for fodder and grain yield characters. J Agricult Sci Technol. 1(1):89–93.
- Tahmasebi S, Heidari B, Pakniyat H, Reza MJK. 2014. Independent and combined effects of heat and drought stress in the Seri M82×Babax bread wheat population. Plant Breed. 133. doi:10.1111/pbr.12214.
- Tanvi K. 2016. Evaluation and characterization of oat genotypes (Avena Spp.) for morphological, fodder and grain yield traits. MSc thesis. Haryana, India: College of Agriculture.
- Tao F, Yue X, Yong-He Z, Ning C, Xin-Tan Z, Yi J, Neil CT, Feng-Min L. 2021. Reduced vegetative growth increases grain yield in spring wheat genotypes in the dryland farming region of North-West China. Agronomy. 11:663. doi:10.3390/agronomy11040663.
- Temesgen D, Behailu M, Teklehaimanot H, Mulatu G, Kassahun T. 2022. Phenotypic variability, heritability and associations of agronomic and quality traits in cultivated Ethiopian Durum wheat (Triticum turgidum L. spp.) (Durum, Desf.). Agronomy. 12:1714.
- Tessema A, Getinet K. 2020. Evaluation of oats (Avena sativa) genotypes for seed yield and yield components in the highlands of Gamo, southern Ethiopia. Ethiop J Agric Sci. 30(3):15–23.
- Wagh VR. 2018. Genetic Diversity and path coefficient analysis in oat (Avena sativa L.). MSc thesis. Maharashtra, India: Department of agricultural botany.
- Wondimu F, Firew M, Berhane L, Bettina IG. 2023. Genotype × environment interaction and yield stability in barley (Hordeum vulgare L.) genotypes in the central highland of Ethiopia. J Crop Sci Biotechnol. doi:10.1007/s12892-022-00166-0.
- Yadav RK. 2000. Studies on genetic variability for some quantitative characters in rice (Oryza sativa L.). Advances in Agricultural Research. 13:205–207.