
Abstract
Hypertension (HT) is a major cause of intracerebral hemorrhage (ICH), and hypertensive cerebral hemorrhage (HCH) has a serious impact on life quality of patients and gives society a heavy burden. This study investigated the key genes involved in HT and HCH. Three patients with HT, three with HCH, and three healthy individuals were recruited in the present study. Shared and specific differentially expressed genes (DEGs) in HT and HCH were identified using RNA sequencing and bioinformatics analysis. Functional annotation and protein–protein interaction (PPI) network construction of HT- and HCH-specific DEGs were conducted. Estimation of cell infiltration, drug prediction, and real-time qPCR (RT-qPCR) validation were performed. Compared with the controls, 502 and 1649 DEGs were identified in the HT and HCH groups, respectively. Among them, 378 DEGs were HT-specific and 633 DEGs were HCH-specific, and a total of 1771 DEGs were identified between HT and HCH. In addition, there were fewer immune cell types that differed significantly among the three groups. The RT-qPCR validation results in human subjects and cell models were generally consistent with the sequencing results. Our study may make a contribution for the understanding of the specific mechanisms of HT and HCH.
Highlights
Hypertension (HT) is a major cause of intracerebral hemorrhage (ICH), and hypertensive cerebral hemorrhage (HCH) has a serious impact on life quality of patients.
A total of 502 and 1649 DEGs were obtained in HT and HCH, and 1771 DEGs were obtained between HT and HCH. Doxycycline, fasudil and propylthiouracil were predicted as potential drugs for HT and HCH.
Our study may make a contribution for the understanding of the specific mechanisms of HT and HCH and representing a potential novel strategy for HT and HCH treatment.
Introduction
Stroke is a major cause of mortality and disability in China and many other developed countries worldwide (Tian et al. Citation2016). Intracerebral hemorrhage (ICH), the second most common subtype of stroke after ischemic stroke, accounts for a large proportion of strokes, with high incidence, high mortality, and poor clinical outcome (Feigin et al. Citation2009; Ding et al. Citation2017). Although ICH is a catastrophic disease, our understanding of the underlying molecular mechanisms remain limited. ICH progression involves complex multistep processes and many environmental and genetic factors, including hypertension (HT), which is the most prominent cause of ICH (Maslehaty et al. Citation2012). Hypertensive cerebral hemorrhage (HCH) is outlined to cerebral parenchymatous hemorrhage caused by the rupture of an arteriole in the brain due to HT, with high mortality, high disability rate, fast onset and serious disease condition (Sun et al. Citation2018). The first study on the mouse model of spontaneous hemorrhagic stroke suggested a potential role of oxidative stress and matrix metalloproteinases (MMPs) in the pathogenesis of spontaneous ICH (Iida et al. Citation2005; Wakisaka et al. Citation2010a, Citation2010b). However, only sporadic microbleeding and microscopic infarcts were observed in an angiotensin II-induced HT mouse model (Meissner et al. Citation2017). The best clinical management of HCH remains unclear since the current application of therapies, including conservative treatment, surgery, and minimally invasive hematoma evacuation, has certain limitations (Ding et al. Citation2018). As HT is an important risk factor for ICH, understanding the specific genes and mechanisms involved in HT and HCH can potentially contribute to improving patient outcomes and reducing the social burden associated with these disorders.
Transcriptome analysis has been widely used in integrated analysis studies (Lei and Guo Citation2019). A new approach to studying transcriptomes has been developed with advances in high-throughput sequencing technologies, such as massively parallel sequencing of short reads derived from mRNAs (RNA-Seq). RNA-Seq, with high accuracy for quantifying expression levels and high reproducibility, has been demonstrated (Wang et al. Citation2015; Li et al. Citation2016). Recently, RNA-Seq has been shown to be an effective tool for investigating the pathogenesis of various diseases. Cerebrospinal fluid (CSF) has been proven to be an ideal source of information for the detection and measurement of biochemical abnormalities within the brain (Leuzy et al. Citation2022). However, compared with CSF-based biomarkers, blood-based biomarkers are an important development direction for the diagnosis and treatment of neurological diseases due to their advantages of less invasiveness and lower costly collection approach (Xiang et al. Citation2020). Therefore, blood-based biomarkers are an attractive alternative for neurological diseases.
In the current study, differentially expressed genes (DEGs) in HT and HCH compared with controls were obtained by RNA-sequencing, respectively. In addition, both shared and specific DEGs in HT and HCH were obtained. Functional annotation and protein–protein interaction (PPI) network construction of HT- and HCH-specific DEGs were conducted to further investigate the molecular mechanisms underlying HT and HCH. Hopefully, our study will represent a new avenue for the specific mechanism for HT and HCH, and making a contribution to understanding the pathological process in the development of HCH.
Materials and methods
Patients and samples
The cohort, comprising three patients with HT, three patients with HCH, and three healthy individuals in the 980st Hospital of the PLA Joint Logistics Support Force, was subjected to RNA-Seq. The inclusion criteria of HT patients were as follows: (1) blood pressure above 140/90 mmHg or prior HT and current use of antihypertensive medication; (2) 50–70 years of age; (3) with clear awareness and verbal communication skills. The exclusion criteria of HT patients were as follows: (1) patients with serious primary diseases of the heart, cerebrovascular, liver, kidney and hematopoietic system; (2) patients with acute medical or surgical diseases; (3) patients with mental illness or intellectual disability. The diagnosis of HCH was confirmed based on HT history, computed tomography (CT) scans, and/or brain magnetic resonance imaging (MRI). Patients with secondary HCH due to trauma, brain tumors, cerebral infarction, vascular malformations, and other causes were excluded. The patients were diagnosed by clinicians and clinical experience. Inclusion criteria for healthy individuals were as follows: age and gender matched with the disease group, no history of HT, and normal results on physical examination. Table describes the characteristics of all the participants. The present study was approved by the ethics committee of the 980st Hospital of the PLA Joint Logistics Support Force (2020-KY-79) and was performed in accordance with the principles of the Declaration of Helsinki. Written informed consent was obtained from each patient for the use of these samples. Peripheral whole blood (2.5 mL) was drawn from each patient and each control subject, and was collected in PAXgene® RNA blood tubes (PreAnalytiX GmbH, Hombrechtikon, Switzerland) and stored at −80°C prior to processing.
Table 1. Patient characteristics.
RNA sequencing and identification of DEGs
Total RNA was isolated from the samples using the PAXgene Blood RNA Kit (BD, USA). With QiaQuick PCR Purification Kit, the mRNA library was prepared. Adapter ligation and reverse transcription polymerase chain reaction (PCR) was performed to generate the cDNA by using TruseqTM Small RNA Sample Prep Kit. Agilent 2100 Bioanaylzer and ABI StepOnePlus Real-Time PCR System were used in quantification and qualification of the sample library. Sequencing was performed based on HiSeq x-ten platform (Illumina) PE50. To obtain clean reads from RNA-sequencing results, sequences with low quality including adapter sequences, sequences with quality score < 20, sequences with N base rate of raw reads >10% and sequences less than 25 bp were removed. Clean reads with the human reference genome were aligned, and mRNA expression was normalized and outputted. With DESeq2 (http://bioconductor.org/packages/DESeq2/) in R version 3.3.3, DEGs were identified. Compared with controls, the DEGs in HT and HCH were defined with p-value <0.05, and |log2 Fold Change| > 1. The shared DEGs in both HT and HCH were further obtained using Venny 2.1.0 (http://bioinfogp.cnb.csic.es/tools/venny/). Compared with the controls, HT-specific DEGs (DEGs in HT but no differences in HCH) and HCH-specific DEGs (DEGs in HCH but no differences in HT) were further identified using Venny 2.1.0 as well. DEGs between HT and HCH were obtained with p-value <0.05, and |log2 Fold Change| > 1 as well. In addition, shared DEGs in both HT and HCH compared with controls were overlapped with DEGs between HT and HCH by applying Venny 2.1.0. Hierarchical clustering analysis of the DEGs was performed with the R package ‘pheatmap'.
Functional enrichment analysis and PPI networks construction of HT- and HCH-specific DEGs
GeneCoDis3 (http://genecodis.cnb.csic.es/analysis) was applied to perform gene ontology (GO), and Kyoto Encyclopedia of Genes and Genomes (KEGG) pathway enrichment analysis for HT- and HCH-specific DEGs, respectively. FDR <0.05 was considered statistically significant. Online database STRING (https://string-db.org) was employed to analyze the PPI networks.
Estimation of immune microenvironment (IME) cell infiltration and drug prediction
The ssGSEA algorithm was applied to quantify the relative abundance of each cell infiltration in the IME of HT and HCH. The gene set for marking each IME infiltration immune cell type was acquired from a previous study. The enrichment scores calculated by ssGSEA analysis were used to represent the relative abundance of each IME infiltrating cell in each sample. Student's t-test was used to compare the differences in immune cell infiltration among the normal controls, HT, and HCH groups. Drug-Gene Interaction Database (DGIdb) is an open-source project that help users mine existing resources and generate assumptions about how genes are therapeutically targeted or prioritized for drug development (Wagner et al. Citation2016). Potential candidate drugs were predicted using the DGIbd database (https://dgidb.org) to offer novel insights into disease diagnosis, treatment, and research.
Construction of oxygen-glucose deprivation/reperfusion (OGD/R) cell model
Oxygen and glucose deprivation (OGD) has been widely known as a risk factor of neuronal cell death in ICH. During an ICH, blood rapidly enters the surrounding brain tissue, resulting in a decrease in regional cerebral blood flow, causing neuronal ischemia and hypoxia, which in turn triggers brain injury. Hence, an OGD/R cell model was constructed to mimic cerebral hemorrhage (Huang et al. Citation2018). HMC-3 cells were cultured in modified Eagle’s medium (MEM) supplemented with 10% fetal bovine serum (FBS) and 0.5% penicillin/streptomycin. The cells were maintained in a humidified incubator at 37°C and 5% CO2. Cells were cultured in MEM complete medium and passaged every 3 days. The complete medium was replaced with MEM basal medium and the cells were placed in an anoxic incubator with 1% O2, 5% CO2 and 94 N2 for 4 h at 37°C. Next, the MEM basal medium was replaced with MEM complete medium and the cells were cultured in an incubator at 37°C for 24 h. Normoxic controls were maintained at 37°C, 5% CO2 and atmospheric pressure.
Real-time qPCR (RT-qPCR) validation in human subjects and cell model
Five patients with HT, seven with HCH, and six healthy individuals were enrolled in this study. We obtained the written informed consent and the approval of the ethics committee of the 980st Hospital of the PLA Joint Logistics Support Force (2020-KY-79). Following the manufacturer’s protocol, total RNA was isolated from blood samples (2.5 mL) with the RNAliquid reagent (Beijing HT-biotech Co., Ltd., Beijing, China) and cells with TRIzol reagent (Thermo Fisher Scientific, Inc., Waltham, MA, USA). RNA quantity and quality were evaluated by Nano Drop ND-1000 spectrophotometer (Nano Drop Thermo, Wilmington, DE) and RNA integrity was assessed by agarose gel electrophoresis. RT-qPCR was performed in an ABI 7300 Real-time PCR Detection System with SuperReal PreMix Plus (SYBR Green) (TIANGEN, Beijing). In the EP tube, 0.75 mL of RNAzol LS Reagent was added to every 0.25 mL sample. The mixture was shaken continuously for 30 s and incubated at 15–30°C for 10 min to completely decompose the ribosomes. The mixture was added with 0.2 mL of chloroform, shaken vigorously for 15s, and placed at room temperature for 5 min. After centrifugation at 12,000 rpm at 4°C for 10 min, the aqueous phase was transferred to the new tube. After adding 70% ethanol, the mixed solution was centrifuged at 12,000 rpm for 45 s, and the waste solution was discarded. A total of 0.5 mL of deproteinizing solution and rinsing solution was respectively added and centrifuged at 12,000 rpm for 45 s, and the waste solution was discarded. The adsorption column was put back into the well collection tube and centrifuged at 13,000 rpm for 2 min to remove the rinsing solution as far as possible. The adsorption column was removed and placed in an RNase free centrifuge tube. RNase free water (30–50 µL) was added to the middle part of the adsorption membrane, placed at room temperature for 2 min, and centrifuged at 12,000 rpm for 1 min. FastKing cDNA First Strand Synthesis Kit was used for mRNA reverse transcription. PCR was performed in 10 µL reaction volume, including 2 µL of cDNA, 2 µL 50×ROX Reference Dye△, 0.6 µL of Forward Primer (10 µM), 0.6 µL of Reverse Primer (10 µM) and 4.8 µL of double distilled water. The reaction was set at 95°C for 15 min for pre-denaturation, then at 95°C for 10 s, at 55°C for 30 s, and 72°C for 32 s repeating 40 cycles. Relative gene expression was analyzed by 2–ΔΔCT method. GAPDH and ACTB were used as endogenous controls. Comparison between two groups was analyzed by the Student’s t-test. The characteristics of the individuals were presented in Table S1. The sequence of primers used in RT-qPCR was displayed in Table S2.
Results
Identification of DEGs
Compared with the controls, 502 (282 up- and 220 down-regulated) DEGs were identified in the HT group. A heatmap of the top 100 up- and down-regulated DEGs was shown in Figure (A). A total of 378 HT-specific DEGs were derived from these 502 DEGs, among which SLC45A3 and STAG3 were the most up- and down-regulated genes, respectively (Table ). Compared with the controls, 1649 (1034 up- and 615 down-regulated) DEGs were identified in HCH. A heatmap of the top 100 up- and down-regulated DEGs was exhibited in Figure (B). A total of 633 HCH-specific DEGs were derived from these 1649 DEGs, among which AP005329.1 and IPO5P1 were the most up- and down-regulated genes, respectively (Table ). A total of 1771 DEGs (1067 up- and 704 down-regulated) were identified between HT and HCH. A heatmap of the top 100 up- and down-regulated DEGs was displayed in Figure (C). In addition, 866 shared DEGs were obtained in both the HT and HCH groups compared with controls.
Figure 1. Identification of DEGs: (A) Hierarchical clustering analysis of top 100 DEGs between HT and controls; (B) Hierarchical clustering analysis of top 100 DEGs between HCH and controls; (C) Hierarchical clustering analysis of top 100 DEGs between HT and HCH; row and column represented DEGs and samples, respectively. The color scale represented the expression levels. (D) Venn diagram of up-regulated DEGs in HT and HCH. (E) Venn diagram of down-regulated DEGs in HT and HCH. Purple represented DEGs between HT and controls; yellow represented DEGs between HCH and controls; green represented DEGs between HT and HCH.
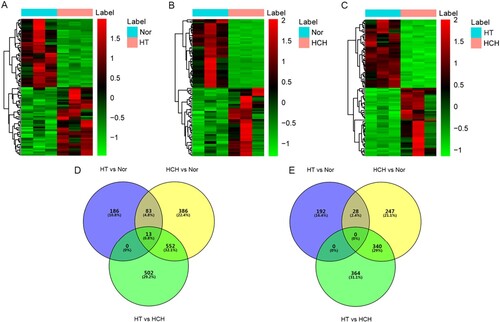
Table 2. Top 10 up- and down-regulated HT-specific DEGs.
Table 3. Top 10 up- and down-regulated HCH-specific DEGs.
Functional annotation of HT-specific DEGs
GO analysis indicated that HT-specific DEGs were significantly enriched in defense response to fungus (FDR = 9.07E-04), defense response to bacterium (FDR = 1.42E-03), extracellular region (FDR = 2.36E-07), metallopeptidase activity (FDR = 6.79E-03), and adenylate cyclase binding (FDR = 2.72E-02) (Figure S1A–C). According to KEGG pathway enrichment analysis, several pathways, including oxidative phosphorylation (FDR = 4.92E-07), Parkinson's disease (FDR = 9.13E-07), and asthma (FDR = 4.87E-04) were significantly enriched (Figure S1D).
Functional annotation of HCH-specific DEGs
GO analysis indicated that HCH-specific DEGs were significantly enriched in viral transcription (FDR = 4.61E-07), translational termination (FDR = 4.67E-07), cytoplasm (FDR = 6.76E-17), metal ion binding (FDR = 2.22E-09), and protein binding (FDR = 6.66E-09) (Figure S2A–C). According to KEGG pathway enrichment analysis, several pathways, including ribosome (FDR = 1.16E-07), ECM-receptor interaction (FDR = 3.98E-07), and small cell lung cancer (FDR = 3.98E-07) (Figure S2D), were significantly enriched.
HT-specific and HCH-specific PPI networks
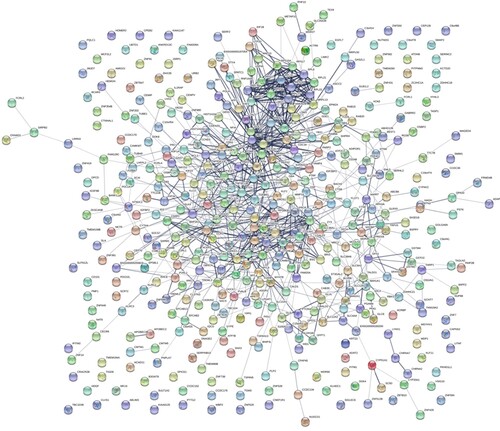
PPI networks were constructed using the STRING online database and Cytoscape software. HT-specific PPI networks included 232 proteins, which consisted of two subgroups: 141 proteins with strong connections with others and 91 separated proteins. Among them, ELANE (degree = 21) and MPO (degree = 18) were the two hub proteins of the HT-specific PPI networks (Figure ). The HCH-specific PPI networks included 448 proteins, which consisted of two subgroups: 351 proteins with strong connections with others and 97 separated proteins. Among them, UBC (degree = 52), UBB (degree = 50), and FN1 (degree = 36) were the three hub proteins of the HCH-specific PPI networks (Figure ).
Figure 2. HT-specific PPI networks. Each node represents a protein, while each edge represents one protein–protein association.
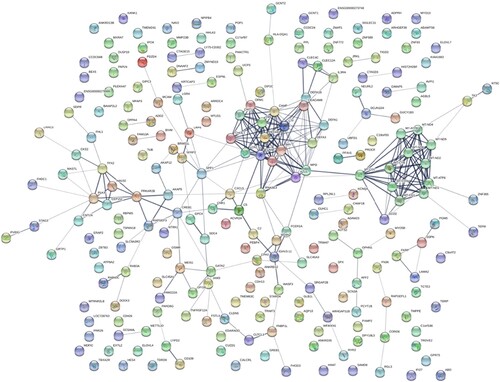
Figure 3. HCH-specific PPI networks. Each node represents a protein, while each edge represents one protein–protein association.
The difference of immune cell infiltration among three groups and drug prediction
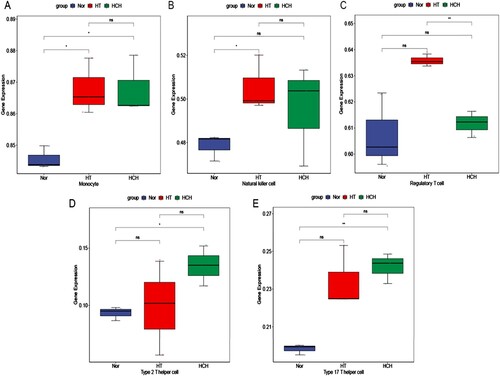
Cell infiltration in the IME of HT and HCH was investigated for the first time in this study. Unexpectedly, there were fewer immune cell types that differed significantly among the three groups, possibly because of the small sample size for RNA-seq. The results showed that compared with the control group, HT group had a higher level of infiltrated monocytes and natural killer cells, while HCH group had a higher level of infiltrated monocytes, regulatory T cells, type 2 T helper cells, and type 17 T helper cells (Figure ). In addition, the potential drugs of GATA2, MPO, HP, ORM1 and AP005329.1 were analyzed with the DGIbd database. The results exhibited that 25 potential drugs were identified to target three genes (GATA2, MPO, and HP), such as doxycycline, fasudil, and propylthiouracil (Figure S3).
Figure 4. Immune cell types that differed significantly among HT, HCH control groups: (A) Monocyte, (B) Natural killer cell, (C) Regulatory T cell, (D) Type 2 T helper cell, (E) Type 17 T helper cell. * indicates p < 0.05, ** indicates p < 0.01, ns indicates not significant.
RT-qPCR validation in human subjects and cell model
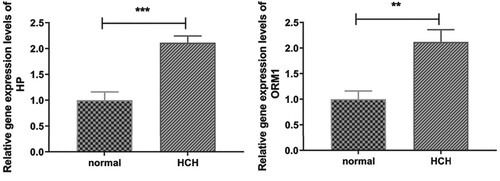
A total of four DEGs, including HP, ORM1, STAG3, and AP005329.1, were selected for RT-qPCR validation. Based on our RNA-seq results, HP and ORM1 were down-regulated in HT while up-regulated in HCH compared with controls, STAG3 was down-regulated in HT, and AP005329.1 was up-regulated in HCH, respectively. As shown in Figure , except the expression level of ORM1 in HT group, the expression tendencies of these four DEGs in RT-qPCR were in agreement with the RNA-seq results. Additionally, the expression levels of HP and ORM1 were validated in the OGD/R cell model. The results indicated that both HP and ORM1 were significantly up-regulated in HCH (OGD/R cell model) compared with controls, which was consistent with the RNA-seq results (Figure ).
Figure 5. The RT-qPCR results of DEGs in human subjects. * indicates p < 0.05, ns indicates not significant.
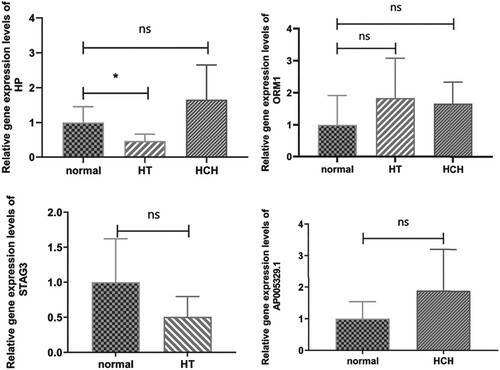
Figure 6. The RT-qPCR results of DEGs in cell model. ** indicates p < 0.01, *** indicates p < 0.001.
Discussion
HCH is a common occurrence in neurosurgical emergency wards and is a potentially life-threatening cerebrovascular disease with high mortality (Feng et al. Citation2016). It has a serious impact on the quality of life of patients and imposes a heavy burden on society (Sun et al. Citation2018). Jin et al., identified 340 DEGs between hypertensive spontaneous ICH (n = 4) and vascular risk factor controls (n = 4) with p < 0.05 and |fold change| > 1.5 by microarray analysis (Jin et al. Citation2021). Among them, four candidate mRNAs (C3AR1, PAWR, ARNTL2, and LDLRAD4) may play important roles in ICH through neuroinflammation, cell apoptosis, and pyroptosis (Jin et al. Citation2021). In the present study, we identified 502 and 1649 DEGs in HT (n = 3) and HCH (n = 3) compared with controls (n = 3) with p-value <0.05, and |log2 Fold Change| > 1. The sample size, control group, and screening criteria were all different, which resulted in different genes screened in the present study and the study by Jin F et al. In addition, we focused on shared and specific DEGs in HT and HCH. The function and PPI networks of the HT- and HCH-specific DEGs were also analyzed.
To a large extent, the formation and development of blood cells rely on cell-restricted TFs, such as the GATA-binding protein family (Muiya et al. Citation2014). GATA2, one of six GATA-binding factors, binds to the DNA motif GATA and other transcription factors to regulate gene expression via two zinc finger domains (Orkin Citation2000; Bresnick et al. Citation2010; Rodrigues et al. Citation2012). GATA2 is located at 21.3 of the long arm of human chromosome 3, and its expression is regulated at multiple levels (Collin et al. Citation2015). GATA2 is essential for hematopoietic stem cell survival and self-renewal, and interacting with a complex network of transcription factors during adult hematopoiesis (Dore et al. Citation2012; Beck et al. Citation2013; May et al. Citation2013). In hematopoietic stem cells, GATA2 is especially important for the genesis and function of hematopoietic stem, including proliferative capacity of early hematopoietic cells as well as the establishment and maintenance of adult hematopoiesis (Tsai et al. Citation1994). In murine models, GATA2 haploinsufficiency disturbs normal hematopoietic stem cell homeostasis (Rodrigues et al. Citation2005). In our study, significant up-regulation of GATA2 was detected in HT, which may indicate the important role of GATA2 in HT.
Myeloperoxidase (MPO) is a member of the superfamily of heme peroxidases, encoded by MPO, and situated on the long arm of chromosome 17 (Ndrepepa Citation2019). It is an inflammatory and oxidative enzyme secreted by activated polymorphonuclear neutrophils (PMN), monocytes, microglia, and macrophages, which plays an important role both in the process of oxidative stress and inflammation (Khine et al. Citation2017; Kim et al. Citation2018). A growing body of research links HT with Alzheimer’s disease (AD). Kruyer et al. suggested that HT significantly influences the onset and progression of AD pathology (Kruyer et al. Citation2015). Moonga et al. demonstrated that HT is related to worse cognitive function and hippocampal hypometabolism in AD (Moonga et al. Citation2017). Besides, Ji et al. reported that MPO polymorphisms in the promoter region are closely correlated with AD risk by regulating MPO expression levels in the Chinese Han population (Ji and Zhang Citation2017). In the current study, MPO was detected to be a significantly down-regulated HT-specific DEG, which was a hub gene in HT-specific PPI. These findings may remind us to focus on the role of MPO in HT.
An increasing number of studies have linked HT with neurodegenerative diseases (Lennon et al. Citation2021; Ungvari et al. Citation2021; Youwakim and Girouard Citation2021). Parkinson's disease (PD), Huntington's disease (HD), and AD were the three significantly enriched pathways for HT-specific DEGs, highlighting the close association between HT and neurodegenerative diseases. In addition, TGF-beta signaling pathway and regulation of the actin cytoskeleton were significantly enriched pathways for HCH-specific DEGs. It was found that TGF-β signaling in endothelial cells was essential for cerebral vascular development (Nguyen et al. Citation2011). The regulation of the actin cytoskeleton was found to be involved in the process of smooth muscle cell contraction, proliferation, and migration (Tang Citation2018). Pathologically in HT, early arteriolar proliferation of smooth muscle is followed later by smooth muscle cell death and collagen deposition, leading to ectasia of arterioles that may eventually result in possible ICH (Sutherland and Auer Citation2006).
Haptoglobin (HP) is a plasma protein that tightly captures hemoglobin (Hb) in the human hemolysis process, which is among the predominant plasma proteins next to the very abundant albumin and immunoglobulins (Andersen et al. Citation2017). HP is expressed as a single polypeptide chain including an 18 amino acid signal peptide, which is cleaved off in the endoplasmic reticulum (Hanley et al. Citation1983). Decreased HP level was detected in pulmonary arterial hypertension (PAH) patients (Nakamura et al. Citation2017). Compared with patients with HP 1-1, patients with the HP 2 allele (2-1 and 2-2) phenotypes showed worse functional outcomes in ICH (Murthy et al. Citation2015). It is worth mentioning that HP was down-regulated in HT while up-regulated in HCH compared with controls. Hence, we speculated that HP may be involved in the development of HCH.
Human orosomucoid (ORM), also called as α1-acid glycoprotein (AGP), is controlled by two closely linked loci, ORM1 and ORM2, and two tandem genes, AGP1 and AGP2, encoding the proteins produced by the two loci (Yuasa et al. Citation1997). ORM1 is classified as an acute-phase reactant because of its increase owing to acute inflammation, which is predominantly produced in the liver (Kushner and Mackiewicz Citation1987). In a rat model of septic stroke, up-regulated ORM1 gene expression level is detected in Staphylococcus aureus infected embolic stroke (Astrup et al. Citation2019). ORM1 has been identified as a novel gene that controls thrombin generation potential, based on a meta-analysis of genome-wide association studies (GWAS) (Rocanin-Arjo et al. Citation2014). Intriguingly, ORM1 was down-regulated in HT while up-regulated in HCH compared with controls, which implied the key role in the progression from HT to HCH.
As for potential drugs, 25 predicted drugs were identified to target three genes, such as doxycycline, fasudil, and propylthiouracil. Doxycycline is a broad-spectrum antibiotic belonging to the tetracycline family, with antioxidant and anti-inflammatory properties (Hadzic et al. Citation2021). Doxycycline could decrease systemic blood pressure in spontaneously hypertensive rats (Antonio et al. Citation2014). Doxycycline, acting as a matrix metalloproteinase (MMP) inhibitor, could prevent vascular alterations in systemic HT (Castro et al. Citation2011). Fasudil, a first generation Rho-kinase (ROCK) inhibitor, has been widely explored in the treatment of pulmonary hypertension (PH) (Raja Citation2012;Odagiri and Watanabe Citation2015). Clinically, fasudil has been proven to have short-term efficacy and safety in the treatment of PH (Zhang and Wu Citation2017). Propylthiouracil, a widely used drug for hyperthyroidism, could attenuate experimental PH (Lai et al. Citation2015). These findings may suggest a potential novel strategy for HT and HCH treatment.
Conclusion
A total of 378 HT- and 633 HCH-specific DEGs were obtained, respectively. Among them, GATA2 and MPO were significantly dysregulated HT-specific DEGs, which might exert important roles in HT. In addition, neurodegenerative diseases, including PD, HD, and AD, have been indicated to be related to HT. Both HP and ORM1, which were down-regulated in HT while up-regulated in HCH compared with controls, may exert important roles in the development process of HCH. However, our study had some limitations. First, the sample size in the RNA sequencing and RT-qPCR was small, and a larger number of samples were needed. Second, the potential molecular mechanism of the identified DEGs in HT and HCH needs to be investigated in in vitro experiments. Not only the identification of mRNA expression levels of the candidate genes by RT-qPCR in independent cohorts, but also the investigation of protein expression levels would be necessary to examine using western blot (WB), immunohistochemistry, immunofluorescence assays and so on, to deepen our understanding of the molecular mechanisms of HCH. The expression and clinical value of the candidate genes would be analyzed in our further research.
Ethical approval
The present study was approved by the ethics committee of the 980st Hospital of the PLA Joint Logistics Support Force (2020-KY-79) and was performed in accordance with the principles of the Declaration of Helsinki. Written informed consent was obtained from each participant for the use of these samples.
Supplemental Figures and Tables
Download MS Word (13.7 MB)Acknowledgements
MQ, YL, WZ, LZ, and HG performed the experiments, analyzed and interpreted the data. HQ and MQ were major contributors to writing the manuscript. HQ designed the project. All authors have read and approved the final manuscript.
Disclosure statement
No potential conflict of interest was reported by the author(s).
Data availability statement
The RNA-seq data has been deposited in the BioProject database (BioProject ID: PRJNA941949, https://www.ncbi.nlm.nih.gov/bioproject/941949). The raw data of RT-qPCR has been deposited in the Harvard Dataverse database (https://dataverse.harvard.edu/dataset.xhtml?persistentId = doi:10.7910/DVN/N1CH3Y).
Additional information
Funding
References
- Andersen CBF, Stodkilde K, Saederup KL, Kuhlee A, Raunser S, Graversen JH, et al. 2017. Haptoglobin. Antioxid Redox Signal. 26:814–831. doi:10.1089/ars.2016.6793.
- Antonio RC, Ceron CS, Rizzi E, Coelho EB, Tanus-Santos JE, Gerlach RF. 2014. Antioxidant effect of doxycycline decreases MMP activity and blood pressure in SHR. Mol Cell Biochem. 386:99–105. doi:10.1007/s11010-013-1848-7.
- Astrup LB, Skovgaard K, Rasmussen RS, Iburg TM, Agerholm JS, Aalbæk B, et al. 2019. Staphylococcus aureus infected embolic stroke upregulates Orm1 and Cxcl2 in a rat model of septic stroke pathology. Neurol Res. 41:399–412. doi:10.1080/01616412.2019.1573455.
- Beck D, Thoms JA, Perera D, Schutte J, Unnikrishnan A, Knezevic K, et al. 2013. Genome-wide analysis of transcriptional regulators in human HSPCs reveals a densely interconnected network of coding and noncoding genes. Blood. 122:e12–e22. doi:10.1182/blood-2013-03-490425.
- Bresnick EH, Lee HY, Fujiwara T, Johnson KD, Keles S. 2010. GATA switches as developmental drivers. J Biol Chem. 285:31087–31093. doi:10.1074/jbc.R110.159079.
- Castro MM, Tanus-Santos JE, Gerlach RF. 2011. Matrix metalloproteinases: targets for doxycycline to prevent the vascular alterations of hypertension. Pharmacol Res. 64:567–572. doi:10.1016/j.phrs.2011.04.002.
- Collin M, Dickinson R, Bigley V. 2015. Haematopoietic and immune defects associated with GATA2 mutation. Br J Haematol. 169:173–187. doi:10.1111/bjh.13317.
- Ding R, Lin C, Wei S, Zhang N, Tang L, Lin Y, et al. 2017. Therapeutic benefits of mesenchymal stromal cells in a rat model of hemoglobin-induced hypertensive intracerebral hemorrhage. Mol Cells. 40:133–142. doi:10.14348/molcells.2017.2251.
- Ding W, Gu Z, Song D, Liu J, Zheng G, Tu C. 2018. Development and validation of the hypertensive intracerebral hemorrhage prognosis models. Medicine. 97:e12446. doi:10.1097/md.0000000000012446.
- Dore LC, Chlon TM, Brown CD, White KP, Crispino JD. 2012. Chromatin occupancy analysis reveals genome-wide GATA factor switching during hematopoiesis. Blood. 119:3724–3733. doi:10.1182/blood-2011-09-380634.
- Feigin VL, Lawes CM, Bennett DA, Barker-Collo SL, Parag V. 2009. Worldwide stroke incidence and early case fatality reported in 56 population-based studies: a systematic review. Lancet Neurol. 8:355–369. doi:10.1016/s1474-4422(09)70025-0.
- Feng Y, He J, Liu B, Yang L, Wang Y. 2016. Endoscope-assisted keyhole technique for hypertensive cerebral hemorrhage in elderly patients: a randomized controlled study in 184 patients. Turk Neurosurg. 26:84–89. doi:10.5137/1019-5149.jtn.12669-14.0.
- Hadzic S, Wu CY, Gredic M, Kojonazarov B, Pak O, Kraut S, et al. 2021. The effect of long-term doxycycline treatment in a mouse model of cigarette smoke-induced emphysema and pulmonary hypertension. Am J Physiol Lung Cell Mol Physiol. 320:L903–l915. doi:10.1152/ajplung.00048.2021.
- Hanley JM, Haugen TH, Heath EC. 1983. Biosynthesis and processing of rat haptoglobin. J Biol Chem. 258:7858–7869. doi:10.1016/S0021-9258(18)32258-0.
- Huang Q, Lan T, Lu J, Zhang H, Zhang D, Lou T, et al. 2018. DiDang tang inhibits endoplasmic reticulum stress-mediated apoptosis induced by oxygen glucose deprivation and intracerebral hemorrhage through blockade of the GRP78-IRE1/PERK pathways. Front Pharmacol. 9:1423. doi:10.3389/fphar.2018.01423.
- Iida S, Baumbach GL, Lavoie JL, Faraci FM, Sigmund CD, Heistad DD. 2005. Spontaneous stroke in a genetic model of hypertension in mice. Stroke. 36:1253–1258. doi:10.1161/01.str.0000167694.58419.a2.
- Ji W, Zhang Y. 2017. The association of MPO gene promoter polymorphisms with Alzheimer's disease risk in Chinese Han population. Oncotarget. 8:107870–107876. doi:10.18632/oncotarget.22330.
- Jin F, Li L, Hao Y, Tang L, Wang Y, He Z. 2021. Identification of candidate blood mRNA biomarkers in intracerebral hemorrhage using integrated microarray and weighted gene co-expression network analysis. Front Genet. 12:707713. doi:10.3389/fgene.2021.707713.
- Khine HW, Teiber JF, Haley RW, Khera A, Ayers CR, Rohatgi A. 2017. Association of the serum myeloperoxidase/high-density lipoprotein particle ratio and incident cardiovascular events in a multi-ethnic population: observations from the Dallas Heart Study. Atherosclerosis. 263:156–162. doi:10.1016/j.atherosclerosis.2017.06.007.
- Kim HJ, Wei Y, Wojtkiewicz GR, Lee JY, Moskowitz MA, Chen JW. 2018. Reducing myeloperoxidase activity decreases inflammation and increases cellular protection in ischemic stroke. J Cereb Blood Flow Metab. 39:1864–1877. doi:10.1177/0271678X18771978.
- Kruyer A, Soplop N, Strickland S, Norris EH. 2015. Chronic hypertension leads to neurodegeneration in the TgSwDI mouse model of Alzheimer's disease. Hypertension. 66:175–182. doi:10.1161/hypertensionaha.115.05524.
- Kushner I, Mackiewicz A. 1987. Acute phase proteins as disease markers. Dis Markers. 5:1–11.
- Lai YJ, Chang GJ, Yeh YH, Pang JH, Huang CC, Chen WJ. 2015. Propylthiouracil attenuates experimental pulmonary hypertension via suppression of pen-2, a key component of gamma-secretase. PLoS One. 10:e0137426. doi:10.1371/journal.pone.0137426.
- Lei Y, Guo P. 2019. Identification of differentially expressed miRNAs and mRNAs in vestibular schwannoma by integrated analysis. BioMed Res Int. 2019:7267816. doi:10.1155/2019/7267816.
- Lennon MJ, Koncz R, Sachdev PS. 2021. Hypertension and Alzheimer's disease: Is the picture any clearer? Curr Opin Psychiatry. 34:142–148. doi:10.1097/yco.0000000000000684.
- Leuzy A, Mattsson-Carlgren N, Palmqvist S, Janelidze S, Dage JL, Hansson O. 2022. Blood-based biomarkers for Alzheimer's disease. EMBO Mol Med. 14:e14408. doi:10.15252/emmm.202114408.
- Li TT, Li XY, Jia LX, Zhang J, Zhang WM, Li YL, et al. 2016. Whole transcriptome analysis of hypertension induced cardiac injury using deep sequencing. Cell Physiol Biochem. 38:670–682. doi:10.1159/000438659.
- Maslehaty H, Petridis AK, Barth H, Doukas A, Mehdorn HM. 2012. Treatment of 817 patients with spontaneous supratentorial intracerebral hemorrhage: characteristics, predictive factors and outcome. Clin Pract. 2:e56. doi:10.4081/cp.2012.e56.
- May G, Soneji S, Tipping AJ, Teles J, McGowan SJ, Wu M, et al. 2013. Dynamic analysis of gene expression and genome-wide transcription factor binding during lineage specification of multipotent progenitors. Cell Stem Cell. 13:754–768. doi:10.1016/j.stem.2013.09.003.
- Meissner A, Minnerup J, Soria G, Planas AM. 2017. Structural and functional brain alterations in a murine model of Angiotensin II-induced hypertension. J Neurochem. 140:509–521. doi:10.1111/jnc.13905.
- Moonga I, Niccolini F, Wilson H, Pagano G, Politis M. 2017. Hypertension is associated with worse cognitive function and hippocampal hypometabolism in Alzheimer's disease. Eur J Neurol. 24:1173–1182. doi:10.1111/ene.13374.
- Muiya NP, Wakil S, Al-Najai M, Tahir AI, Baz B, Andres E, et al. 2014. A study of the role of GATA2 gene polymorphism in coronary artery disease risk traits. Gene. 544:152–158. doi:10.1016/j.gene.2014.04.064.
- Murthy SB, Levy AP, Duckworth J, Schneider EB, Shalom H, Hanley DF, et al. 2015. Presence of haptoglobin-2 allele is associated with worse functional outcomes after spontaneous intracerebral hemorrhage. World Neurosurg. 83:583–587. doi:10.1016/j.wneu.2014.12.013.
- Nakamura H, Kato M, Nakaya T, Kono M, Tanimura S, Sato T, et al. 2017. Decreased haptoglobin levels inversely correlated with pulmonary artery pressure in patients with pulmonary arterial hypertension: a cross-sectional study. Medicine. 96:e8349. doi:10.1097/md.0000000000008349.
- Ndrepepa G. 2019. Myeloperoxidase – a bridge linking inflammation and oxidative stress with cardiovascular disease. Clin Chim Acta. 493:36–51. doi:10.1016/j.cca.2019.02.022.
- Nguyen HL, Lee YJ, Shin J, Lee E, Park SO, McCarty JH, et al. 2011. TGF-β signaling in endothelial cells, but not neuroepithelial cells, is essential for cerebral vascular development. Lab Invest. 91:1554–1563. doi:10.1038/labinvest.2011.124.
- Odagiri K, Watanabe H. 2015. Effects of the Rho-kinase inhibitor, fasudil, on pulmonary hypertension. Circ J. 79:1213–1214. doi:10.1253/circj.CJ-15-0443.
- Orkin SH. 2000. Diversification of haematopoietic stem cells to specific lineages. Nat Rev Genet. 1:57–64. doi:10.1038/35049577.
- Raja SG. 2012. Evaluation of clinical efficacy of fasudil for the treatment of pulmonary arterial hypertension. Recent Pat Cardiovasc Drug Discov. 7:100–104. doi:10.2174/157489012801227238.
- Rocanin-Arjo A, Cohen W, Carcaillon L, Frere C, Saut N, Letenneur L, et al. 2014. A meta-analysis of genome-wide association studies identifies ORM1 as a novel gene controlling thrombin generation potential. Blood. 123:777–785. doi:10.1182/blood-2013-10-529628.
- Rodrigues NP, Janzen V, Forkert R, Dombkowski DM, Boyd AS, Orkin SH, et al. 2005. Haploinsufficiency of GATA-2 perturbs adult hematopoietic stem-cell homeostasis. Blood. 106:477–484. doi:10.1182/blood-2004-08-2989.
- Rodrigues NP, Tipping AJ, Wang Z, Enver T. 2012. GATA-2 mediated regulation of normal hematopoietic stem/progenitor cell function, myelodysplasia and myeloid leukemia. Int J Biochem Cell Biol. 44:457–460. doi:10.1016/j.biocel.2011.12.004.
- Sun Y, Xu B, Zhang Q. 2018. Nerve growth factor in combination with Oxiracetam in the treatment of Hypertensive Cerebral Hemorrhage. Pak J Med Sci. 34:73–77. doi:10.12669/pjms.341.13395.
- Sutherland GR, Auer RN. 2006. Primary intracerebral hemorrhage. J Clin Neurosci. 13:511–517. doi:10.1016/j.jocn.2004.12.012.
- Tang DD. 2018. The dynamic actin cytoskeleton in smooth muscle. Adv Pharmacol. 81:1–38. doi:10.1016/bs.apha.2017.06.001.
- Tian DZ, Wei W, Dong YJ. 2016. Influence of COL1A2 gene variants on the incidence of hypertensive intracerebral hemorrhage in a Chinese population. Genet Mol Res. 15:15017369. doi:10.4238/gmr.15017369.
- Tsai FY, Keller G, Kuo FC, Weiss M, Chen J, Rosenblatt M, et al. 1994. An early haematopoietic defect in mice lacking the transcription factor GATA-2. Nature. 371:221–226. doi:10.1038/371221a0.
- Ungvari Z, Toth P, Tarantini S, Prodan CI, Sorond F, Merkely B, et al. 2021. Hypertension-induced cognitive impairment: from pathophysiology to public health. Nat Rev Nephrol. 17:639–654. doi:10.1038/s41581-021-00430-6.
- Wagner AH, Coffman AC, Ainscough BJ, Spies NC, Skidmore ZL, Campbell KM, et al. 2016. DGIdb 2.0: mining clinically relevant drug-gene interactions. Nucleic Acids Res. 44:D1036–D1044. doi:10.1093/nar/gkv1165.
- Wakisaka Y, Chu Y, Miller JD, Rosenberg GA, Heistad DD. 2010a. Critical role for copper/zinc-superoxide dismutase in preventing spontaneous intracerebral hemorrhage during acute and chronic hypertension in mice. Stroke. 41:790–797. doi:10.1161/strokeaha.109.569616.
- Wakisaka Y, Chu Y, Miller JD, Rosenberg GA, Heistad DD. 2010b. Spontaneous intracerebral hemorrhage during acute and chronic hypertension in mice. J Cereb Blood Flow Metab. 30:56–69. doi:10.1038/jcbfm.2009.183.
- Wang Y, Wu N, Liu J, Wu Z, Dong D. 2015. FusionCancer: a database of cancer fusion genes derived from RNA-seq data. Diagn Pathol. 10:131. doi:10.1186/s13000-015-0310-4.
- Xiang Y, Xin J, Le W, Yang Y. 2020. Neurogranin: a potential biomarker of neurological and mental diseases. Front Aging Neurosci. 12:584743. doi:10.3389/fnagi.2020.584743.
- Youwakim J, Girouard H. 2021. Inflammation: a mediator between hypertension and neurodegenerative diseases. Am J Hypertens. 34:1014–1030. doi:10.1093/ajh/hpab094.
- Yuasa I, Umetsu K, Vogt U, Nakamura H, Nanba E, Tamaki N, et al. 1997. Human orosomucoid polymorphism: molecular basis of the three common ORM1 alleles, ORM1*F1, ORM1*F2, and ORM1*S. Hum Genet. 99:393–398. doi:10.1007/s004390050378.
- Zhang Y, Wu S. 2017. Effects of fasudil on pulmonary hypertension in clinical practice. Pulm Pharmacol Ther. 46:54–63. doi:10.1016/j.pupt.2017.08.002.