 ?Mathematical formulae have been encoded as MathML and are displayed in this HTML version using MathJax in order to improve their display. Uncheck the box to turn MathJax off. This feature requires Javascript. Click on a formula to zoom.
ABSTRACT
Data science is collaborative and its students should learn teamwork and collaboration. Yet it can be a challenge to fit the teaching of such skills into the data science curriculum. Team-Based Learning (TBL) is a pedagogical strategy that can help educators teach data science better by flipping the classroom to employ small-group collaborative learning to actively engage students in doing data science. A consequence of this teaching method is helping students achieve the workforce-relevant data science learning goals of effective communication, teamwork, and collaboration. We describe the essential elements of TBL: accountability structures and feedback mechanisms to support students collaborating within permanent teams on well-designed application exercises to do data science. The results of our case study of using TBL to teach a modern, introductory data science course indicate that the course effectively taught reproducible data science workflows, beginning R programming, and communication and collaboration. Students also reported much room for improvement in their learning of statistical thinking and advanced R concepts. To help the data science education community adopt this appealing pedagogical strategy, we outline steps for deciding on using TBL, preparing and planning for it, and overcoming potential pitfalls when using TBL to teach data science.
1 Introduction
Data science is a complex field and data scientists need to know and be able to do many things. According to Harris et al. (Citation2013), who conducted a study of more than 250 data scientists from around the world, the most successful data scientists have substantial, deep experience in at least one technical aspect of data science and enough broad skills to be able to intelligently collaborate with or lead others on data science teams. Consequently, data science education must encompass many topics as exemplified by the long lists and Venn diagrams of essential learning goals for undergraduates (see, e.g., De Veaux et al. 2017; Hardin et al. Citation2015; Nolan and Lang Citation2010; National Academies of Sciences, Engineering, and Medicine Citation2018). In the many undergraduate data science programs recently created by statisticians, students are expected to know almost as much statistics as traditional statistics majors while also knowing more about computation.
On top of statistics and computation, the National Academies of Science, Engineering, and Medicine (2018, pp. 28–29) reported on Data Science for Undergraduates adds teamwork and collaboration to its list of key concepts for data science students to learn, concluding:
The ability to work well in multidisciplinary teams is a key component of data science education that is highly valued by industry, as teams of individuals with particular skill sets each play a critical role in producing data products. Multidisciplinary collaboration provides students with the opportunity to use creative problem solving and to refine leadership skills, both of which are essential for future project organization and management experiences in the workplace. Multidisciplinary teamwork also emphasizes inclusion and encourages diversity of thought in approaching data science problems.
However, this consensus report does not suggest how data science educators might teach teamwork and collaboration nor how to fit teaching these skills into an already packed curriculum.
Data science is a collaborative enterprise, both in how it combines elements and characteristics from other fields and in how it is practiced. It is our assertion that if we teach teamwork and collaboration, our students will excel without knowing all that a data scientist could know because they will have the skills and experience collaborating with others to fill whatever gaps they may have. As Roseth et al. (Citation2008, p. 1) state: “Collaboration is not just an end goal of statistics instruction but also a means to help students learn statistics.” This paper endorses this assertion as a key part of data science education: collaboration should be an end goal of data science education (in a capstone course) and also a means to help students learn data science throughout the curriculum.
Data science educators have explicitly taught collaboration within capstone courses (Vance et al. Citation2020; Vance and Smith Citation2019). Sharp et al. (Citation2021) described 10 short videos of mock collaboration sessions that can be useful in such courses. Alternatively, the teaching of collaboration could be deferred until graduate school; examples of teaching collaboration in biostatistics at the graduate level include Thabane et al. (Citation2008) and Davidson et al. (Citation2019). Kolaczyk et al. (Citation2021) described integrating data science practice throughout their master’s program.
Garfield (Citation1993) and Roseth et al. (Citation2008) make the case that educators can teach teamwork and collaboration skills throughout the curriculum by using small-group cooperative learning, a constructivist pedagogy that also helps students learn statistics better. Roseth et al. (Citation2008, p. 9) argue:
Using these [collaborative learning] methods, students learn statistics in ways that not only enhance their statistical reasoning and communication skills, but also give them practice in working collaboratively, which models the collaborative nature of real statistical work. Cooperative learning groups also enhance critical thinking, conceptual understanding, and other higher order skills.
Team-based learning (TBL) is a highly structured version of the small group cooperative learning exemplars promoted by Garfield (Citation1993) and Roseth et al. (Citation2008) that flips the classroom and results in students actively engaging with their peers to apply course content to actually do data science to solve problems. TBL has been used successfully in a modified form by St. Clair and Chihara (Citation2012) to teach a statistical literacy course and by Vance (Citation2013, Citation2015) to teach a statistics and data science capstone course since 2012 and an introductory data science course since 2018. TBL has also been successfully used to teach mathematical thinking (Paterson and Sneddon Citation2011) and computer science (Lasserre and Szostak Citation2011). The present work describes a case study in how to use TBL to teach introductory data science. The goal of this paper is to popularize TBL within the statistics and data science education community. Section 2 summarizes the pedagogical strategies of TBL. Section 3 describes our specific use of TBL to teach an introductory, first-year data science course at the University of Colorado Boulder and Section 4 presents results of teaching this course for three semesters. We describe next steps for educators to teach with TBL, barriers to implementation, and mitigation strategies in Section 5. We conclude in Section 6.
2 TBL Pedagogical Strategy
2.1 A General Overview of What TBL Is
TBL is a highly structured, flipped classroom teaching strategy that fosters small-group cooperative learning for students to apply course content to solve problems. It is an active, learner-centered pedagogy that holds students accountable for their preparation for in-class activities and requires them to apply knowledge to solve authentic problems (Parmelee et al. Citation2012). It was developed by Michaelsen in the 1970s (Michaelsen et al. Citation2004) and has a canonical implementation (Haidet et al. Citation2012; Parmelee et al. Citation2012) shown to work exceedingly well in a variety of educational contexts (Burgess et al. Citation2014; Thomas and Bowen Citation2011). As Haidet et al. (Citation2012) summarized: when TBL is used as the organizing structure for an entire course, students master content through repeated iterations of a three-step process that consists of (i) pre-class preparation, (ii) assurance of readiness to apply learned concepts, and (iii) application of content through team problem-solving activities. TBL has attracted particular interest in the health sciences because it is a teaching strategy that develops learners’ ability to use principles and skills wisely to solve problems and because it helps address a growing need to cultivate learners’ leadership, communication, and teamwork skills (Haidet et al. Citation2012).
We have been using TBL pedagogy since 2012 for 17 iterations of four courses in statistics and data science. First deployed in an interdisciplinary collaboration course, TBL was a natural fit that helped us transform the course from one based on class discussions of topics related to collaboration to an activity-based course in which students actively collaborated with each other. Instead of just one student at a time discussing a topic, with TBL, n students were discussing within the k teams simultaneously. Using an analogy to ANOVA, with TBL students first discuss and debate a topic within their team, revealing within-team variation of thought processes, opinions, and conclusions. Then one person per team will—simultaneously—state or reveal their team’s consensus conclusion, allowing opportunity for the whole class to explore between-team variation of thought processes and conclusions.
Michaelsen and Sweet (Citation2008) described four essential elements of TBL:
Teams must be properly formed and managed.
Students must be accountable for the quality of their individual and team work.
Students must receive frequent and immediate feedback.
Team assignments must promote both learning and team development.
2.1.1 Teams
The instructor must choose the teams in a transparently fair way to balance the student characteristics and intellectual resources among the teams and provide enough time for teams to coalesce. In other words, students must never self-select their teams and teams should be permanent and balanced on relevant characteristics (e.g., gender, ethnicity, major, experience with data science). Only when students work together over time can their groups become cohesive enough to evolve into self-managed and truly effective learning teams (Michaelsen and Sweet Citation2008). Michaelsen et al. (Citation2004) recommend forming teams of 5–7 members. We have found that permanent teams of four or five students formed during the second week of class work well in data science.
2.1.2 Accountability
TBL requires individuals to be accountable to the instructor and their teammates and for teams to be held accountable for their work as a unit. TBL also requires individual students to come to class prepared and to contribute to their team (Michaelsen and Sweet Citation2008). Accountability for individual pre-class preparation is assessed through an individual Readiness Assurance Test (iRAT) at the beginning of each TBL module. Accountability to the team is assessed by team members during the team Readiness Assurance Tests (tRATs) and via peer evaluations. During in-class team application exercises, each team member is responsible for justifying to the instructor and the whole class their team’s answer, making such teamwork an example of cooperative learning based on social interdependence theory (Roseth et al. Citation2008).
2.1.3 Feedback
In TBL, tests and application exercises are designed to provide teams immediate feedback on their answer choices. Such feedback improves student learning and promotes team development by developing confidence in the team’s ability to capture the intellectual resources of all their members (Michaelsen and Sweet Citation2008). Section 3 describes specific ways in which data science students receive feedback within the TBL structure.
2.1.4 Assignment Design
Team assignments generate a high level of group interaction if they require teams to apply course concepts to make decisions that involve a complex set of issues and enable teams to report their decisions in a simple form. When assignments emphasize making decisions and reporting them simply (e.g., selecting the best answer choice from a list of multiple options), most students complete the task by engaging each other in a give-and-take content-related discussion (Michaelsen and Sweet Citation2008). Similar to how a great question asked of the domain expert in a statistics or data science collaboration both elicits information useful for addressing the project’s goals AND strengthens the relationship with the domain expert (Vance and Smith Citation2019), a great team assignment motivates students to apply course content to solve a problem and also promotes team development and cohesion. Assignments that promote both learning and team development motivate students to challenge others’ ideas for the good of the team (Michaelsen and Sweet Citation2008). A recommended way to design assignments is to follow “the four S’s” principle to make the assignments address a Significant problem, have teams work on the Same problem, require teams to make a Specific answer choice, and report their answers Simultaneously (Sibley and Spiridonoff Citation2014).
Haidet et al. (Citation2012) expanded these four essential elements of TBL to seven core elements: team formation, readiness assurance, immediate feedback, sequencing of in-class problem solving, “four S’s,” incentive structure, and peer review. These core elements of TBL will be described in Section 3 in the context of a case study of teaching an introductory data science course.
2.2 Reasons TBL Should be Considered in Data Science Education
Garfield (Citation1993) discussed several reasons small-group cooperative learning should be adopted for teaching statistics, all of which apply to TBL and all of which transfer to the teaching of data science. Garfield’s reasons not included below are that small-group cooperative learning leads to better group activity, improved attitudes, and increased achievement (Garfield and BenZvi Citation2007) and is especially suited for statistics education. We believe TBL is well-suited for data science education because of the additional five reasons detailed below.
Reason #1: TBL is active pedagogy to help students learn to do data science better. As Cobb (Citation1992, pp. 10–11) concluded many years ago in, Heeding the Call for Change, statistics educators must foster active learning: “As a rule, teachers of statistics should rely much less on lecturing and much more on alternatives such as group problem-solving and discussion, lab exercises, class demonstrations, activities, written and oral presentations, and projects.” The exigency for students to be actively engaged in statistics classrooms is grounded in the constructivist theory of learning (Kalaian and Kasim Citation2014), which views students as active learners engaged in constructing and restructuring their own newly learned concepts based on previously learned material (Cooperstein and KocevarWeidinger Citation2004; Fosnot Citation2013).
Flipped classrooms, in which students participate in passive aspects of learning at home and active aspects of learning in class with guidance and support from peer mentors and instructors, have the potential to increase performance in introductory statistics for nonmath majors (Farmus et al. Citation2020; Winquist and Carlson Citation2014). In a meta-analysis, Kalaian and Kasim (Citation2014) found that the academic achievement of college statistics students can be improved through the collaborative and cooperative scientific inquiry and active learning that prevail in flipped classrooms.
If we want our students to be able to tidy a real dataset, we should have them tidy real data in class. If we want them to know how to distinguish between designed experiments and observational studies, then they should be distinguishing between designed experiments and observational studies in class. Rather than spending the majority of class time lecturing or working through example code, TBL compels instructors to think about what they want students to be able to do with data and then design preparation materials (content) and application exercises so that students will do those things—in class, where they can get timely support and feedback from their peers and the instructor.
Reason #2: TBL helps data science students develop their communication and teamwork skills. Garfield (Citation1993, p. 3) wrote, Businesses are increasingly looking for employees who are able to work collaboratively on projects and to solve problems as a team. Therefore, it is important to give students practice in developing these skills by working cooperatively on a variety of activities. This type of experience will not only build collaborative problem-solving skills, but will also help students learn to respect other viewpoints, other approaches to solving a problem, and other learning styles.
More recently, the GAISE College Report (Carver et al. Citation2016, p. 18) concluded:
Using active learning methods in class allows students to discover, construct, and understand important statistical ideas as well as to engage in statistical thinking. Other benefits include the practice students get communicating in statistical language and learning to work in teams to solve problems (emphasis added).
Our students will work in teams in the workforce. They will collaborate as data scientists. Within the structure of TBL, students work in teams every class period and—if the instructor desires—outside of class on projects and/or weekly lab assignments. We assert that such recurrent teamwork experience is helpful for students to answer job interview questions (e.g., “Tell me about a time in which your group work worked well, poorly? Why? What lessons did you learn?”) and that their teamwork skills will help them succeed in the workforce.
Reason #3: TBL is highly structured to avoid many of the pitfalls of other pedagogical strategies. Farmus, et al. (Citation2020) report finding much heterogeneity and methodological diversity in implementing flipped classroom pedagogy in statistics education, and that aligns with our experience. There are many ways to flip a classroom and incorporate active, small group, cooperative learning. TBL builds in accountability for individuals to come to class prepared and to contribute to teamwork. TBL exercises are designed to provide immediate feedback to teams so they can assess and reassess what cooperative processes work for them and where they need to improve (Michaelsen and Sweet Citation2008). Having permanent teams means that social loafing students (i.e., “slackers”) cannot be passed or rotated from group to group. Permanent teams learn to deal with conflict and find ways for all members to contribute when team exercises are designed to ensure individual accountability, motivate intensive team interaction (not delegation), facilitate external performance feedback (e.g., comparisons between teams), and reward team success (Michaelsen et al. Citation1997).
Reason #4: TBL enables rich assessments of student learning. While walking around the classroom (or jumping into online breakout rooms) and observing students as they work in teams, the instructor is able to hear students express their understanding of what they have learned, which provides instructors with an ongoing, informal assessment of how well students are learning and understanding (Garfield Citation1993). When teams simultaneously report their answers for a team application exercise, they and the instructor can immediately assess which teams grasp the concept and which do not. Randomly calling on a team member to explain their team’s reasoning underlying incorrect or suboptimal answers reveals potential misconceptions about the subject matter and provides “teaching moment” opportunities for the instructor to address these misconceptions.
Reason #5: TBL has the potential to help make data science more inclusive. TBL has been shown to improve overall student achievement in many settings, including calculus in both large and small classes (Peters et al. Citation2020). TBL especially helps lower performing students (as measured prior to a TBL course) improve performance on post-course and final examinations (Collins et al. Citation2019; Koles et al. Citation2010). Because peers teach other, students with less content mastery at the start of a TBL session benefit from this peer interaction, while well-prepared students also benefit by clarifying and solidifying their own knowledge (Koles et al. Citation2010). Collins (Citation2019) found that females with higher participation in a TBL course had higher course performance, indicating that preparation and confidence leads females toward higher participation, whereas males’ participation in team discussions was uncorrelated with their performance. This suggests that TBL, when implemented well, could help females succeed in data science courses. Hettler (Citation2015) found a small, statistically significant improvement in learning outcomes for low-income and minority students compared to other students in TBL economics courses, also indicating the potential for TBL to make data science more inclusive.
Ultimately these reasons can be summarized thusly: TBL can help instructors teach data science better and students learn data science better, including “hard-to-teach” skills of communication and teamwork.
3 Case Study: Teaching Introductory Data Science with TBL
We developed and taught an introductory data science course three times from 2018–2019 using TBL. Following the reporting guidelines of Haidet et al. (Citation2012), this section describes the scope and motivation for the course, how the seven core elements of TBL were implemented, and our deviations from the standard implementation. The intent for this section is to serve as a practical guide for educators to implement TBL to teach data science. The course syllabus, class notes, readings, team application exercises, weekly lab assignments, and data and code from our case study are published on a public repository in the Open Science Framework to encourage more instructors to use TBL to teach data science (Vance Citation2021).
Scope and Motivation. We implemented TBL in the first three offerings of a newly developed “Introduction to Data Science” course at the University of Colorado Boulder in Spring 2018, Spring 2019, and Fall 2019. The course, which required a prerequisite of Calculus 1 (even though no calculus was used in the course), was created to be the first within-major course for second-semester first-year students in a newly developed Statistics and Data Science major. The course was four credits, with 150 min total in-class time per week (i.e., two or three class periods of 75 or 50 min each) and 50 min once per week in a recitation/lab section (except for in Spring 2018 when the course was 3 credits without the recitation/lab section). Over these three semesters, enrollment was 17, 48, and 45 students, respectively. The population of students shifted from primarily applied mathematics and computer science majors to having a mode of second-year statistics and data science majors. None of the students reported having had prior experience with TBL. The instructor had previous experience using TBL to teach capstone statistical collaboration courses and strived to implement the canonical version of TBL in this introductory data science course throughout the entire 15-week semesters.
The course was designed to excite students about statistics and data science, to develop their technical and professional skills to do it, and hopefully to develop data acumen. The course content included learning about and using reproducible workflows, learning beginning and advanced concepts in R (R Core Team Citation2021), becoming familiar with statistical thinking concepts in the context of doing interesting things with data, and doing all of this in a setting promoting the learning of communication, teamwork, and collaboration skills while considering and incorporating discussion of ethics. The course is similar in spirit to the one described by Çetinkaya-Rundel and Ellison (Citation2021).
The book R for Data Science (R4DS) (Wickham and Grolemund Citation2016) was used to teach Beginning R programming skills (Chapters 1–12) such as data visualization, transforming data, Exploratory Data Analysis, tibbles, importing, and tidying data; Advanced R skills (chapters 13–25) such as joins, strings, factors, dates and times, pipes, functions, vectors and lists, iteration, model building, and mapping to many models; and Workflow skills (Chapters 26–27, 29–30) of RStudio (RStudio Team 2021), R Markdown (Allaire et al. Citation2021), Open Science Framework, and GitHub. Students used GitHub to work within teams and posted their weekly lab assignment reports to the Open Science Framework (Foster and Deardorff Citation2017).
Statistical thinking concepts were added into team application exercises, weekly lab assignments, or mini-lectures. These concepts included understanding the differences between designed experiments and observational studies, correlation v. causation, confounding variables, sampling, calculating probabilities and percentiles, comparing groups or values, Simpson’s paradox, and finally testing hypotheses via simulation/bootstrapping.
An explicit design feature of this course was to use TBL so that students would be communicating and collaborating with their teammates on a daily basis. The ethics of doing data science was never explicitly taught, but was sprinkled into discussions of team application exercises and weekly lab assignments. Students were frequently responsible for answering: “Who would most benefit from this analysis and your conclusions and recommendations? Who might be most harmed?”
After determining what the students were expected to be able to do by the end of the course (i.e., determining learning goals and objectives), the next step for using TBL to teach it was to partition the course into seven modules, with each module following the same TBL pattern of pre-class readings assignments (typically four chapters from R4DS), the readiness assurance process, formative in-class team application exercises, and summative weekly team lab assignments.
1. Team formation. We formed teams of 4–5 students on the third day of class, typically the first day of the second week to partially account for the typical early flux of students adding or dropping the course. To distribute experience in statistics and computer science among the teams, students physically lined up in decreasing order of how many statistics or data science courses they had taken in college. The first tie-breaker was the number of statistics and data science courses for which they were currently enrolled. The second tie-breaker was the number of computer science courses they had taken. The third tie-breaker was the number of computer science courses for which they were currently enrolled. This resulted in the most experienced students on one end of the classroom and the least experienced at the other end. Then the instructor calculated how many teams were needed to maximize the number of four-person teams with remainders creating five-person teams and counted off students using a “snake draft” format (e.g., 1-2-3-…k – k…-3-2-1-1…to create k teams). Students then clustered by number and began introducing themselves. However, before finalizing the teams, the instructor revealed a gender balancing rule that no team could have an isolated gender (i.e., only one female or male on a team). After a few swaps, the resulting teams became permanent teams for the rest of the semester. We have since developed a function within an R package in development to automate this process, which would be especially useful for large classes (Kopf et al. Citation2019). It may be advisable to also cluster by race/ethnicity to prevent the isolation of minority students on teams (Macke et al. Citation2019).
2. Readiness assurance. At the beginning of each module, students took an individual test (iRAT) consisting of 10 multiple choice questions based on the main concepts of the readings, which were comprised of chapters from R4DS, except for the first module, which also included readings on TBL (Michaelsen and Sweet Citation2008; Sibley and Spiridonoff Citation2014), the course syllabus, notes on giving effective and helpful feedback, and a short tutorial about GitHub. An example iRAT/tRAT for Module 2 is included in Appendix A. As soon as every team member completed their iRAT, one team member handed in all the team’s iRATs in exchange for a copy of the team test (tRAT) and the team answer sheet. Both tests were closed book. Teams getting a question wrong could appeal the question by submitting a written (open book) appeal to the instructor during or shortly after class. The instructor concluded each readiness assurance process by conducting a very short mini-lecture (0–10 min) to clarify concepts teams may have found confusing. The topics of the mini-lecture were determined on the spot based on observing the test questions individuals and teams missed, overhearing team discussions, or simply asking students what they would like clarified. Prior teaching experience also informed the mini-lecture topics. A feature of TBL is that the instructor only lectures on material the students need help learning, not material they can learn on their own or from their teammates.
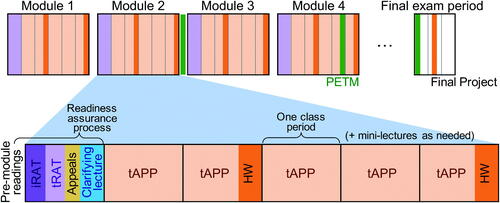
The readiness assurance process typically took around 45 min, which filled nearly the entire class period for 50-minute classes. During the semester in which classes were 75-min long, a short team application exercise (tAPP) followed the readiness assurance process. shows a timeline for implementing TBL during a 15-week semester with three class periods per week. The timeline can be easily adapted for courses meeting more or less frequently per week and for more or fewer weeks (e.g., for a 10- or 6-week term).
Fig. 1 TBL timeline for a 15-week semester course meeting three times per week. Weekly team lab homework assignments (HW) and three peer evaluation and team maintenance surveys (PETM) are indicated by their due date. Note that for all but the first class period of each module, in-class time is comprised solely of tAPPs and occasional mini-lectures. Students typically do the pre-module readings the week or weekend before the start of each module.
3. Immediate feedback. We used the Immediate Feedback Assessment Technique (IF-AT) scratch off answer forms (Epstein et al. Citation2002) to provide immediate feedback to teams on the tRATs and provide multiple opportunities for teams to arrive at the correct answer. This process enables students to make immediate corrections in their thinking and in their teamwork processes. Besides being a fun, high-energy activity, the use of IF-AT forms allows misunderstandings of the course content to be clarified before they become entrenched, continually reinforces the expectation that teams will work together effectively, and provides a disincentive for poor team communication behaviors (e.g., poor listening, overassertiveness, underassertiveness) (Haidet et al. Citation2012).
4. Sequencing of in-class problem solving. For all but the first class sessions of each module, teams engage in team application exercises (tAPP). Typically, the first several (1–5) questions of the tAPP were “warm-up” exercises for individuals to complete on their own before discussing with their team members. These warm-up questions sometimes led to discussion and clarifications (e.g., see Appendix B), but usually did not generate much between team discussion as they were usually designed to have only one possible correct answer and were meant to familiarize students with the dataset or the statistics/programming concepts before working on more complex exercises (see ).
Fig. 2 An example team application exercise is shown with warm-up exercises (question 1), scaffolding exercises (2–5), and final exercises (6–7).
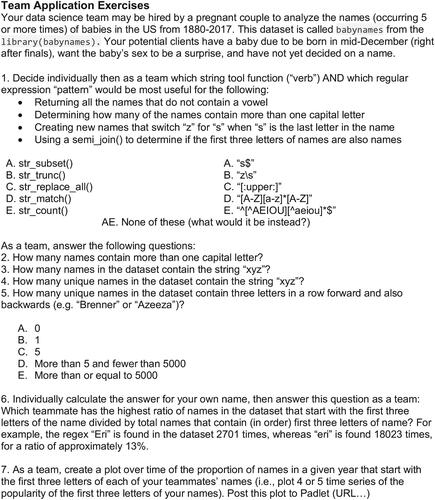
Warm-ups usually took 8–15 min. Teams disclosed their answers to the warm-ups in a rapid-fire sequence of simultaneously raising laminated placards revealing their multiple-choice answer to everyone in the classroom. The rest of the class period was typically left for teams to engage in the 3–8 additional tAPPs. The tAPP questions were structured to scaffold up to the final, often complex data science tAPP, which was often a plot posted to a digital wall (i.e., Padlet, see www.padlet.com) summarizing the team’s data science analysis. Typically, teams would reveal answer choices and engage in inter-team discussion at one intermediate time point and after the final exercise. The best tAPPs are those that immediately cause the students (and instructor) to ask why that answer was chosen (Michaelsen et al. Citation1997). An example tAPP is shown in . Question 1 and its four subquestions was the warm-up. Questions 2–5 scaffolded up to the final two, more personally significant exercises. Teams revealed their answers to the warm-up (via the laminated placards) and then later to question 5, followed by some inter-team discussion. Questions 6 and 7 became inputs into the teams’ weekly lab assignment and did not generate inter-team discussion as every team’s answer was different.
5. The four S’s. tAPPs were created with an attempt to scaffold up to each team engaging in a significant data science problem applying the coding and statistical thinking skills learned up to that point. All teams worked in class on the same problems. Possible answers were specific multiple-choice answers (A–E) revealed by simultaneous use of laminated placards and followed by inter-team discussion, open-ended answers without inter-team discussion, or the result of an analysis summarized by a specific plot posted to Padlet. The Padlet digital wall did not allow students to see other submissions until the instructor released all posts simultaneously. The intent was to incorporate simultaneous reporting of the final answers to the tAPPs. However, in practice, this seldom happened because teams usually ran out of class time to post their final analysis and conduct inter-team discussion. The overall intent of tAPPs was to implement the GAISE College Report’s recommendation #3: “Integrate real data with a context and a purpose” (Carver et al. Citation2016, p. 3).
6. Incentive structure. Letter grades were earned based on three components: 40% Individual Performance (including iRATs and individual components of the weekly lab assignments and final project), 40% Team Performance (based on tRATs and team components of the weekly lab assignments and final project), and 20% Peer Evaluation and Team Maintenance (PETM) (described below). Students did not have any influence on these relative weights. tAPPs were not assessed as part of the course grade, though elements of the tAPPs (e.g., a plot summarizing a team’s analysis) were often required and assessed components of the weekly lab assignments.
7. Peer review. A hefty 20% of a student’s grade was determined by the average of quantitative scores received from peers via the PETM, which occurred three times per semester. Students allocated 10 x (n-1) points in whole numbers among their n-1 teammates (e.g., in a team of four students, each student allocated 30 points to their three teammates), with a maximum score of 15 and a range of points of at least two (e.g., 11, 10, 9 but not 10, 10, 10 to compel students to make decisions (Michaelsen and Fink Citation2002)). In addition, students provided qualitative feedback to each team member and engaged in self-reflection by answering the following questions: “What does this student [or self] do well to positively impact your team’s performance?” and “What could this student [or self] do differently to increase his/her contribution to the team?” We used the PETM function in the tbltools package (Kopf et al. Citation2019) to deploy and manage the PETMs. Three PETMs were deployed during weeks five, 10, and 15, with the weighting of each PETM being 3.33%, 6.67%, and 10% of the overall course grade, respectively. Students generally provided helpful feedback to each other and critically evaluated their own contributions to the team and their opportunities for improvement. We recommend instructors be aware of the potential for biased evaluations and consider actions to mitigate this risk (Stonewall et al. Citation2018).
Deviations from the standard TBL implementation. The more one learns about and experiences TBL, the more one realizes how much more there is to discover and improve about how to use TBL in the classroom. Instructors will also be tempted to modify the standard TBL implementation. Our deviations involved the tAPPs. Our tAPP warm-up exercises were not significant problems. We assigned them to “load” the concepts the students were to use for the rest of the tAPPs, analogously to how loading an R package makes specific functions ready to use. Also, rather than working on one or two significant tAPPs per classroom session, we essentially broke the problems down into smaller chunks, scaffolding a progression of how to arrive at the final analyses. Finally, we found it difficult to manage a simultaneous reporting of a final data analysis visualization, as students would often run out of time during class periods to reveal and discuss the final tAPP. Consequently, the tAPP analyses often became components of teams’ lab assignments due at the end of each week. Rather than providing students with multiple options of final visualizations from which to make a specific choice, we preferred the open-ended choice of producing a visualization or analysis. We did not want students to discuss plots and visualizations; rather, we wanted them to create visualizations and then debate the pros and cons of the plots they produced. However, this debate rarely happened because of time constraints or the nature of the simultaneous reveal of the analyses and visualizations, which was not conducive to discussions about why teams made the choices they made.
4 Results of a Three-Year Experiment Using TBL to Teach Data Science
Research questions. We considered our educational efforts to be a three-times-repeated experiment of using TBL to teach Intro to Data Science. Throughout this experiment, we wanted to know whether we should continue using TBL to teach the course, whether we should recommend TBL to others, and if so, what would be the next steps for an instructor new to TBL to adopt the TBL pedagogical strategies for data science. Specifically, we set out to answer four main research questions:
RQ1: What is the instructor’s perception of how well the course achieved its goals of teaching reproducible data science workflows, beginning and advanced R programming, statistical thinking, and communication and collaboration?
RQ2: What are the students’ perceptions of how well they achieved the 31 student learning outcomes (SLO) listed in Section 3 and ?
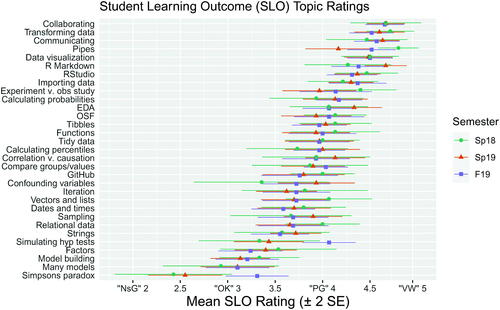
Fig. 3 Mean scores of students’ self-evaluation of how well they learned each SLO. SLO labels have been shortened for clarity.
RQ2b: Specifically, how well did students report learning communication and collaboration, relative to other topics?
RQ2c: Did students report learn beginning R concepts better than advanced R concepts?
RQ3: How did student perceptions change from Year 1 to Year 2 and Year 3?
RQ4: Qualitatively, how did the course impact the students?
RQ5: What do we recommend for other instructors curious about using TBL to teach data science?
Methods. After each semester of teaching the course, the instructor reflected on what went well and what could be improved to answer RQ1 and RQ5. The results of RQ1 are in this section; the results of RQ5 are in Section 5. For RQ4, students were asked in Lab 2 (Week 2) to reflect on their goals for six months after graduation and five years after that, what they hope their greatest career accomplishment will be, and—given these hopes and goals—what they are hoping to learn/accomplish/do in this course. Then in Lab 15 (Week 15 Final Project) they were asked to write a paragraph reflecting on how their six-month or five-year goals have changed, what they learned/accomplished in this course, and what advice they would have given themselves at the beginning of the semester.
We did not implement a formal quantitative assessment of how well students achieved the SLOs. Instead, to answer RQ2 and RQ3, we asked students on the last day of class to anonymously rate how well they think they learned 31 topics on a scale from “Not at all (1),” “Not so good (2),” “OK (3),” “Pretty good (4),” to “Very Well (5).” Out of 110 students over three semesters, 74 responded, for a response rate of 67%.
RQ2: Student perceptions of achievement of SLOs. shows, for each semester, the mean score ( 15,
30,
29 for the Spring 2018, Spring 2019, and Fall 2019 semesters) of how well students reported they achieved the 31 SLOs, ordered from highest to lowest. Error bars of ±2 standard errors are included to show variability around each mean. The three highest-rated SLOs were “Collaborating with teammates,” “Transforming data” (filter, select, etc. from the tidyverse suite of packages (Wickham et al. Citation2019)),” and “Communicating findings and recommendations.” The three lowest-rated SLOs were “Model building” using the modelr package (Wickham Citation2020), “Many models” using the purrr package (Henry and Wickham Citation2020) and “Simpson’s paradox.”
The mean evaluation was 3.94, just under a “Pretty Good (4)” score. In general, the topics students engaged in repeatedly from the beginning of the semester, such as data visualization and RStudio, unsurprisingly scored higher than topics first encountered near the end of the semester, such as testing hypotheses via permutations/simulations and building linear models.
RQ2b: Learning of communication and collaboration. The 31 SLOs were categorized into five overall learning goals: Workflow, Beginning R, Advanced R, Statistical Thinking, and Communication/Collaboration. shows the mean for each category each semester, with error bars of ±2 standard errors. Communication/Collaboration—consisting of only two SLOs “Collaborating with teammates” and “Communicating findings and recommendations,” was consistently the highest rated learning goal category, with average ratings a little closer to “Very Well (5)” than “Pretty Good (4).” The Beginning R category (consisting of six SLOs from Chapters 1–12 of R4DS) and Workflow—consisting of the SLOs “RStudio,” “R Markdown,” “OSF (Open Science Framework),” and “GitHub”—were the next highest ranked categories in each semester, with average scores somewhat better than “Pretty Good (4).” The lowest ranked categories were Statistical Thinking and Advanced R (SLOs from Chapters 13–25 in R4DS). The nine Statistical Thinking SLOs had an overall average rating of 3.79, somewhat worse than “Pretty Good (4).” The ten Advanced R SLOs had the lowest rating of 3.66, somewhat closer on average to “Pretty Good (4)” than “OK (3).”
Fig. 4 Mean self-evaluation scores (±2 SEs) by semester per overall learning goal category.
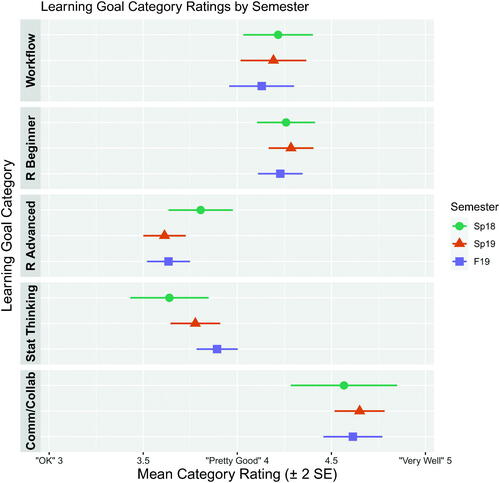
Our answer to RQ2b is that students reported learning communication and collaboration very well, which is partial validation of our choice to use TBL to emphasize the collaborative aspects of data science. The learning goals with the most room for improvement were Advanced R programming skills and Statistical Thinking.
RQ2c: Students learned beginning R concepts better than advanced R concepts. As can be seen in and , R topics covered earlier in the semester had higher student self-evaluation ratings than the more advanced R topics, even though the advanced programming skills were more recently learned. A simple t-test comparing the overall mean ratings between the two learning goals shows that students rated beginning R topics higher by an average of 0.60 points, with a 95% confidence interval of (0.50, 0.70). Since the beginning R topics were foundational skills used throughout the course, it is unsurprising that students reported that they learned them better.
RQ3: We noticed subtle differences in perceptions of learning from semester to semester. The overall SLO mean scores for each semester were 3.95 (n457 ratings, SE
0.05), 3.93 (n
924, SE
0.03), and 3.95 (n
895, SE
0.03) for the Fall 2018, Spring 2019, and Fall 2019 semesters, just under the “Pretty Good (4)” rating and remarkably consistent. As seen in , Statistical Thinking showed a positive trend by semester. In fact, the instructor specifically focused more time and attention in tAPPs on these skills in later semesters, perhaps at the expense of time and focus on Advanced R programming skills. Specifically, the tAPPs related to Simpson’s paradox (see Appendix B) were improved from Spring 2018 to Fall 2019, and average ratings on that topic increased from 2.43 to 3.31, qualitatively moving from a little closer to “Not so good (2)” to somewhat closer to “OK (3)” than “Pretty Good (4).” The testing of hypotheses using permutation tests and simulation/bootstrapping was the focus of two, 50-minute-long lab recitation sessions led by teaching assistants in Spring 2019 and Fall 2019 (there was no lab section in Spring 2018), and this extra instruction and practice seemed to be effective in helping students learn this topic. Average ratings increased from 3.33 to 4.07, qualitatively shifting from somewhat closer to “OK (3)” than “Pretty Good (4)” in Spring 2018 to slightly better than “Pretty Good (4)” in Fall 2019.
RQ4: Qualitatively, the course impacted students positively. The qualitative responses from students at the end of the semester were notable for their richness, diversity, and complexity and are not fully described here. Below are three quotes representative of students who received grades of A, B, and C.
Student A: I think that for my six months and five-year goals, my attitude has changed toward what I plan to be doing. I want to find a way I can apply statistics and programming in some socially responsible way. I feel like I understand much better what it means to do statistical programming because of this course, and see many areas where it could be applied but has not yet. Mostly what I learned in this class was ways to deal with data, and ways to answer questions I have about that data. One thing that I think that is especially valuable that I learned was how to explore the data, and see what kind of questions I should be asking. As I move forward, I will learn different ways of answering these questions, but it will always be important to figure out exactly what questions to ask. I would tell myself to keep starting projects early, stop spending as much time on formatting/fine details, and start finishing class exercises at home.
Student B: My goals since the beginning of the semester have become more defined. For instance, now, 6 months after graduation, I hope to have a full-time internship as a Data Scientist/Analyst while 5 years from now, I hope to be a senior Data Scientist/Analyst. I had taken 1 programming class before with Python and struggled with it but this class helped me learn a new programming language and how to work with data. If I could give myself advice, I would say to start doing the readings earlier so you have time to do the exercises in the book and to more actively do the team exercises. I would say to keep learning to collaboratively work with and communicate with a team because you’ll need those skills for the rest of your life. Finally, I would tell myself that struggling is OK and to learn to drop what I’m doing and come back to the problem later if I’m getting too frustrated at the problem and that it is OK to fail sometimes. The Goal is to keep working hard and keep learning whether from failures or successes.
Student C: My goals have not changed as my goals require me to graduate from college. In this course I have gained a good understanding of R and new statistical functions. One thing I could’ve done more is reading the course book as it contains a lot of useful examples for R.
RQ1: Synthesis of results. Synthesizing the quantitative and qualitative data with personal reflections to answer RQ1 results in our conclusion that the course did well in teaching reproducible data science workflows, beginning R programming, and communication and collaboration. Student teams were 100% successful in submitting 13 weekly data science lab reports knitted in R Markdown, only occasionally submitting their reports a few minutes or hours past the deadlines. By the end of the course, every student could perform basic tasks in R such as filtering, selecting, plotting with ggplot2 (Wickham Citation2016). Of the 25 teams over the three semesters, only one required mild intervention by the instructor to reassure the high performing student that his grade would not suffer due to social loafing of two of his teammates, who were successfully encouraged by the instructor to increase their involvement in team activities. The remaining 24 teams consistently worked well together.
Work still needs to be done to better integrate Statistical Thinking concepts into the learning of R and the doing of data science. In future iterations of the course, the instructor may use more videos, assign extra readings, or create more mini-lectures on statistical thinking topics. For example, integrating short videos from “Skew the Script” (Young-Saver Citation2021) into the pre-class reading assignments or in-class mini-lectures could better prepare students to apply these concepts in their tAPPs and weekly lab assignments. Finally, advanced R concepts could be taught better by teaching fewer of them. Instead of trying to teach everything in Chapters 13–25 of R4DS, the instructor could let students choose which topics to focus on to apply in their weekly lab assignments or final project. For example, rather than focusing on all aspects of Chapters 14–16 (strings, factors, and dates and times), the instructor could provide teams with the option to choose just one of those topics to apply in a weekly lab assignment. That would provide more time to apply material from Chapters 23–25 on building (linear) models and using the map function (Henry and Wickham Citation2020) to iterate through many models, which consistently felt rushed at the end of the semester.
5 Next Steps for and Discussion on Using TBL to Teach Data Science
Data science is a 21st-century discipline that deserves a 21st-century pedagogy. We feel that we owe it to our students to be innovative and to teach data science in a way similar to how it is practiced in industry. TBL is such a pedagogy. Ultimately, we believe that TBL helps students learn data science better, helps them learn valuable teamwork and collaboration skills, and helps them have more fun in the process. TBL is also more fun for the instructor who gets to observe students code, debate, and collaborate and experience students constructing their own knowledge rather than being lectured or “coded at.” Therefore, we recommend that all data science educators consider using TBL. For those whose interest has been piqued by this paper, this section briefly describes a process for deciding whether or not to use TBL, preparing and planning to teach with TBL, and implementing TBL in the data science classroom.
5.1 Next Steps: Decide, Prepare, Plan, Implement
5.1.1 Decide
We invite the reader to consider three options for your teaching: continue to teach with your current pedagogical strategies, increase the active learning components of your courses, or fully adopt TBL.
Michaelsen and Richards (Citation2005) had noted the dangers of partial adoption of the TBL methodology, which include settling for incremental gains when more gains are possible from a complete adoption. TBL is like a three-legged stool; it could fail because counterproductive practices are included or an element necessary for the support of other elements is missing. For example, requiring group work without the individual accountability assured from the iRAT or the team accountability inspired by peer evaluations may invite social loafing. Therefore, we recommend that if the reader decides to teach with TBL, you jump in with both feet. There is no “partial TBL.”
That said, for those who may want to dabble with TBL before deciding to fully adopting it, one could consider converting one or more lectures into reading assignments to deliver the content and tAPPs for students to practice applying that content in class. Beware that temporary teams might lack the cohesion actual TBL teams develop, and individuals might miss the motivation to do the readings provided by the iRATs/tRATs and the social pressure of TBL. Other ways to improve the teaching and learning of data science without making the significant move to TBL may include simply increasing other active learning components of your current data science course by incorporating group activities described in Roseth et al. (Citation2008) and the GAISE College Report (Carver et al. Citation2016). Even introducing an occasional activity in which one student explains a concept to a second student, and that second student provides feedback on the explanation can improve the teaching and learning of data science.
We think it is useful to consider three stages of questions to help one decide to fully adopt TBL. The first stage is to decide if you want to do it. Are you willing? First, watch a 12-minute introductory video (Faculty Innovation Center 2012). Next, read a four-page handout on TBL (Sibley and Spiridonoff Citation2014) and Michaelsen and Sweet’s introductory paper (2008). Then answer this question: Are you not just personally willing to teach with TBL but excited to do so?
The second stage is to decide if you are able to teach with TBL. It is hard work to convert a lecture-based course into a TBL course. Can you commit to reading more about TBL pedagogy or attending a TBL workshop? Will you be able to convey the course content to students via readings and videos rather than lectures? Can you commit to transforming examples from old lectures into team application exercises that adhere to the “four S’s?” We believe that every educator can learn the skills to teach with TBL; the relevant question is if one is practically capable of committing the time and effort to learn about and implement a new pedagogical strategy.
The third stage is to assess if your environment is supportive of teaching with TBL. Do you have the autonomy to restructure a course? Do you have and/or need support from senior faculty to change the way you teach? Will your department be supportive of your efforts to change your method of teaching? We believe that enrolling other faculty members in your decision to fully implement TBL can help create a supportive environment for TBL.
If you answer these questions in the affirmative, then we believe you are ready to commit to teaching with TBL and progressing to the next phases of preparing, planning, and implementing TBL in the data science (or statistics) classroom.
5.1.2 Prepare
In TBL, we ask students to prepare before engaging with their peers in the material. Instructors using TBL should do the same. Read more about TBL pedagogy, attend a TBL conference or workshop, and find a mentor. The Team-Based Learning Collaborative (TBLC) (www.teambasedlearning.org) lists resources for further reading, upcoming conferences and workshops (both in-person and online), and TBLC consultants and members who could become mentors. Few data science instructors have experienced TBL as a student. At a workshop, one can experience TBL from the perspective of a student, which is an invaluable experience. A colleague who has taught with TBL and is willing to answer questions can smooth your path through TBL.
5.1.3 Plan
Our advice for creating a TBL data science course builds on the step-by-step instructions for medical educators in Parmelee et al. (Citation2012). We recommend six steps guided by three questions:
What do I want my students to be able to do?
How will I know if they are able to do it?
What do they need to know to be able to do the things I want them to do?
The first two steps are to identify the course learning goals and to divide the course syllabus into units or modules. For a 15-week course, 4–7 modules seems appropriate, with each module following the rhythm of TBL: out-of-class advance assignment (readings/videos), an in-class iRAT and tRAT (assessment of key concepts from readings), clarification review as appropriate (mini-lecture), and several tAPPs. One can sequence the modules so that course learning goals are achieved within one module or built up over several modules. For example, in the introductory data science course described above, we split the material into seven modules (see the course overview and schedule in Appendix C). Our course goal for students to learn reproducible data science workflows was concentrated in Module 1 and reinforced in every subsequent module, whereas learning to model data was only covered in the final Module 7.
The third step is to create tAPPs to induce students to do the things you want them to be able to do and produce a result that will demonstrate to both the instructor and the students that they are able to do it (or not). For example, one of the goals of the tAPP shown in Appendix B was for students to demonstrate that they could distinguish between designed experiments and observational studies. The rapid-fire warm-up tAPP #1 had students do exactly that for six examples. Some of the examples could be either choice depending on how the experiment/study was conducted. When teams had divergent answer choices for those examples, the instructor probed for the reasoning behind a sample of teams’ answer choices, which revealed the different assumptions each team used to answer the question, which further helped students distinguish between designed experiments and observational studies. In the same tAPP, another learning goal was for students to learn about Simpson’s paradox and to be able to recognize situations in which this concept obscured the interpretation of the underlying data. The tAPP was not particularly effective in achieving that goal and was incrementally improved between the first and third iteration of the course. There remains much room for improving that tAPP.
The fourth step is to identify the readings, videos, etc. that will help your students learn the things they need to know to be able to do the things you want them to do. These should be compiled into an advance assignment for each module that indicates the specific learning goals and the level of requisite mastery (Parmelee et al. Citation2012). For example, our advance assignments are primarily chapters from R4DS, contain a brief description of the key concepts/learning goals for each chapter, and indicate that the level of mastery is such that the student is able to complete the exercises in the book. In future iterations of the course we will consider adding short videos (3–8 min) of “scaffolding lectures” to preface the reading assignments to identify the key concepts of the readings and show the students how they will be expected to apply them, as recommended by Parmelee, et al. (Citation2012).
The fifth step is to write the Readiness Assurance Tests (i.e., the iRAT and tRAT for each module) to assess how well students understand the key concepts from the advance assignment. If they understand the big ideas, they are prepared to learn the details when they make decisions in the tAPPs. Our iRATs and tRATs are closed book, no-computer, 10-question multiple choice tests (including some True/False questions).
The final step for planning a TBL course is to begin preparing clarification reviews, which are 0–10-minute mini-lectures or coding demonstrations from the instructor. These could be generated on-the-spot after the tRAT to clarify common misconceptions or could be prepared beforehand, anticipating the concepts students will struggle with on the tRAT that are necessary to complete the subsequent tAPPs. The clarification review becomes a symbol of TBL in that the instructor only lectures on material the students need help understanding.
5.1.4 Implement
Steps one and two (determining course learning goals and dividing the course into modules) must be completed well before the term begins. Additionally, the number and schedule for peer evaluations should be included in the course syllabus. Before classes start, we recommend proceeding through steps 3–6 for at least the first two modules and for all modules occurring before the first peer evaluation. Ideally the instructor will develop all parts of every module before the term begins. On the other hand, instructors should be open to modifying later modules based on their experience with the beginning ones. Fully developing at least the first few modules allows for adequate preparation and flexibility to develop or improve modules later in the term.
Another aspect of implementing TBL, and one especially important for those new to this teaching strategy, is for the instructor to create feedback loops from students and colleagues. To collect informal feedback from students, we occasionally add three quick questions to the end of iRATs or tAPPs: “What is one thing the professor should keep doing? Start doing? Stop doing?” Such feedback can help the instructor make beneficial and timely course corrections. Another source of feedback is from peer instructors. We recommend inviting colleagues to observe class sessions and share with you their observations. Ask colleagues to review some tAPPs or iRATs. Receiving peer feedback could help you improve your instruction and could potentially build support in your department for teaching with TBL.
5.2 Potential Barriers and Mitigation Strategies
5.2.1 Novelty of TBL
On many campuses and in many departments, TBL is new, and in general, people resist change. When an instructor decides to teach with TBL and has planned their course, we recommend committing to seeing it through to completion, recognizing that there will be obstacles to overcome and that the journey—not just the end result—will be worthwhile. A strategy for overcoming the newness of this pedagogy is to embrace the rhythm and structure of TBL. Every module follows the same pattern of starting with the readiness assurance process and then applying course content on tAPPs. Each tAPP has the same rhythm: individual thinking, intrateam discussion, simultaneous reveal of answers, inter-team discussion. Another strategy is to provide clear expectations for students. Their responsibility is to learn data science by doing the reading assignments, engaging with their teammates on tRATs and tAPPs, collaborating on out-of-class assignments, and providing feedback to their teammates.
5.2.2 Difficulty Developing tAPPs
It is challenging to develop good team application exercises that adhere to the “four S’s” principle. Keeping this principle in mind, the design of every tAPP should start by answering the questions: “What SLO do I want my students to achieve? What would convince me that they know how to do it?” Then scaffold their experience toward achieving the SLO. The final, simultaneous reveal of their specific answers (to the same questions) is evidence of whether they know how to do it correctly. Pooling resources from a community can help overcome the challenge of developing significant tAPPs with specific answer choices. “Data Science in a Box” is an example of one group sharing their resources for teaching data science (Çetinkaya-Rundel Citation2021). As a start toward pooling community resources for using TBL to teach data science, we have published our course notes, structure, schedule, tAPPs, and weekly lab assignments online at www.osf.io/569qy. Note that our tAPPs and lab assignments still have much room for improvement.
5.2.3 Students Might Resist TBL
Teaching with TBL requires a shift in attitudes and relationships. The instructor’s responsibility becomes to structure, facilitate, and provide wisdom. The student’s responsibility is to learn, apply the material, and work well with teammates. The instructor becomes more of a guide or mentor to students. Students learn from and collaborate with their peers and therefore must develop strong relationships with their teammates. Initial tAPPs or out-of-class assignments focusing on team building are crucial for helping to build these relationships. In our experience, when groups achieve early success by working on interesting and challenging exercises or assignments that utilize all of their intellectual assets, they unite as a team. Such early wins preempt future breakdowns in team relationships. The initial shift in mindset can be achieved by having students read about TBL; we assign Michaelsen and Sweet (Citation2008) and Sibley and Spiridonoff (Citation2014) as readings in the first module. In our experience, students become eager to try it, and when teams begin with early wins, they embrace TBL throughout the term. Providing opportunities for students to communicate feedback to the instructor throughout the term—such as asking what the instructor should keep, start, and stop doing—sustains the positive energy surrounding TBL.
5.2.4 Colleagues or Administrators Might Resist TBL
Because the lecture mentality of the “sage on the stage” is so common, it might be disconcerting for other faculty or administrators to observe such a different teaching strategy. They too might need a shift in mindset to appreciate the value of TBL for teaching data science. A reason that may be compelling to them (and to students) is that the collaborative learning style of TBL is more similar to what data scientists will actually do in the workforce than the traditional lecture-based course. In some teaching environments, it will not be necessary to convince colleagues that you should be able to use TBL. You can just do it and then communicate your successes with them. In other environments it may be necessary to receive the sanction or endorsement from senior colleagues or administrators. One way to enroll them in using TBL to teach data science is to pilot a tAPP with a group of three or four faculty who are prepared to engage in the exercise (i.e., they have the content knowledge to be able to do the things you want them to do). This trial team of faculty will experience the intrateam discussion of a real tAPP but will miss the excitement of a simultaneous reveal of answer choices and subsequent inter-team discussion of why teams chose their specific answers. Their feedback can help the instructor improve future tAPPs, and the experience might lead to support for your use of TBL to teach data science.
6 Conclusion
TBL is an exciting pedagogical strategy that can help educators teach data science better by flipping the classroom to employ small-group collaborative learning to actively engage students in doing data science. TBL can also help achieve the workforce-relevant data science learning goals of effective communication, teamwork, and collaboration by going well beyond helping students solve merge conflicts in GitHub. The goal of this paper is to popularize TBL within the data science education community. To that purpose, we have provided an overview of the TBL pedagogical strategy and reasons it works well, results from a case study implementing TBL to teach an introductory data science course, and next steps for educators to adopt TBL and overcome potential barriers to implementation. We think that the time is right for data science educators to embrace TBL and conclude with a quote attributed to Leonardo da Vinci: “I have been impressed with the urgency of doing. Knowing is not enough; we must apply. Being willing is not enough; we must do.”
Acknowledgments
The author thanks his original TBL mentors Jarad Niemi and Sandra Stinnett and his students. He appreciates the work of Sebastian Kopf and Johnny Tamanaha in developing the tbltools package, Ethan Schacht for a preliminary analysis of the case study data, and his colleagues Nathan Pieplow and David Glimp as well as two editors and two anonymous reviewers for their helpful comments on the manuscript.
Additional information
Funding
References
- Allaire, J. J., Xie, Y., McPherson, J., Luraschi, J., Ushey, K., Atkins, A., Wickham, H., Cheng, J., Chang, W., and Iannone, R. (2021), rmarkdown: Dynamic Documents for R.
- Burgess, A. W., McGregor, D. M., and Mellis, C. M. (2014), “Applying Established Guidelines to Team-Based Learning Programs in Medical Schools: A Systematic Review,” Academic Medicine, 89, 678–688. DOI: https://doi.org/10.1097/ACM.0000000000000162.
- Carver, R., Everson, M., Gabrosek, J., Horton, N., Lock, R., Mocko, M., Rossman, A., Roswell, G., Velleman, P., Witmer, J., and Wood, B. (2016), “Guidelines for Assessment and Instruction in Statistics Education (GAISE) College Report 2016,” Guidelines for Assessment and Instruction in Statistics Education (GAISE) College Report 2016.
- Çetinkaya-Rundel, M. (2021), “Data Science in a Box,” Data Science in a Box. Available at https://datasciencebox.org/.
- Çetinkaya-Rundel, M., and Ellison, V. (2021), “A Fresh Look at Introductory Data Science,” Journal of Statistics and Data Science Education, 29, S16–S26. DOI: https://doi.org/10.1080/10691898.2020.1804497.
- Cobb, G. (1992), “Teaching Statistics,” in Heeding the Call for Change: Suggestions for Curricular Action, MAA Notes No. 22, Washington, DC, pp. 3–43.
- Collins, C. M., Carrasco, G. A., and Lopez, O. J. (2019), “Participation in Active Learning Correlates to Higher Female Performance in a Pipeline Course for Underrepresented Students in Medicine,” Medical Science Educator, 29, 1175–1178. DOI: https://doi.org/10.1007/s40670-019-00794-2.
- Cooperstein, S. E., and KocevarWeidinger, E. (2004), “Beyond Active Learning: A Constructivist Approach to Learning,” Reference Services Review, 32, 141–148. DOI: https://doi.org/10.1108/00907320410537658.
- Davidson, M. A., Dewey, C. M., and Fleming, A. E. (2019), “Teaching Communication in a Statistical Collaboration Course: A Feasible, Project-Based, Multimodal Curriculum,” The American Statistician, 73, 61–69. DOI: https://doi.org/10.1080/00031305.2018.1448890.
- De Veaux, R. D., Agarwal, M., Averett, M., Baumer, B. S., Bray, A., Bressoud, T. C., Bryant, L., Cheng, L. Z., Francis, A., Gould, R., Kim, A. Y., Kretchmar, M., Lu, Q., Moskol, A., Nolan, D., Pelayo, R., Raleigh, S., Sethi, R. J., Sondjaja, M., Tiruviluamala, N., Uhlig, P. X., Washington, T. M., Wesley, C. L., White, D., and Ye, P. (2017), “Curriculum Guidelines for Undergraduate Programs in Data Science,” Annual Review of Statistics and Its Application, 4, 15–30. DOI: https://doi.org/10.1146/annurev-statistics-060116-053930.
- Epstein, M. L., Lazarus, A. D., Calvano, T. B., Matthews, K. A., Hendel, R. A., Epstein, B. B., and Brosvic, G. M. (2002), “Immediate Feedback Assessment Technique Promotes Learning and Corrects Inaccurate First Responses,” The Psychological Record, 52, 187–201. DOI: https://doi.org/10.1007/BF03395423.
- Faculty Innovation Center. (2012), Team-Based Learning: Group Work That Works, Team-Based Learning, The University of Texas at Austin.
- Farmus, L., Cribbie, R. A., and Rotondi, M. A. (2020), “The Flipped Classroom in Introductory Statistics: Early Evidence From a Systematic Review and Meta-Analysis,” Journal of Statistics Education, 28, 316–325. DOI: https://doi.org/10.1080/10691898.2020.1834475.
- Fosnot, C. T. (2013), Constructivism: Theory, Perspectives, and Practice (2nd ed.), Teachers College Press.
- Foster, E. D., and Deardorff, A. (2017), “Open Science Framework (OSF),” Journal of the Medical Library Association, 105, 203–206. DOI: https://doi.org/10.5195/jmla.2017.88.
- Garfield, J. (1993), “Teaching Statistics Using Small-Group Cooperative Learning,” Journal of Statistics Education, 1, 1–9. DOI: https://doi.org/10.1080/10691898.1993.11910455.
- Garfield, J., and BenZvi, D. (2007), “How Students Learn Statistics Revisited: A Current Review of Research on Teaching and Learning Statistics,” International Statistical Review, 75, 372–396. DOI: https://doi.org/10.1111/j.1751-5823.2007.00029.x.
- Haidet, P., Levine, R. E., Parmelee, D. X., Crow, S., Kennedy, F., Kelly, P. A., Perkowski, L., Michaelsen, L., and Richards, B. F. (2012), “Perspective: Guidelines for Reporting Team-Based Learning Activities in the Medical and Health Sciences Education Literature,” Academic Medicine, 87, 292–299. DOI: https://doi.org/10.1097/ACM.0b013e318244759e.
- Hardin, J., Hoerl, R., Horton, N. J., Nolan, D., Baumer, B., Hall-Holt, O., Murrell, P., Peng, R., Roback, P., Lang, D. T., and Ward, M. D. (2015), “Data Science in Statistics Curricula: Preparing Students to ‘Think with Data,”’ The American Statistician, 69, 343–353. DOI: https://doi.org/10.1080/00031305.2015.1077729.
- Harris, H., Murphy, S., and Vaisman, M. (2013), Analyzing the Analyzers: An Introspective Survey of Data Scientists and Their Work, Sepastopol, CA: O’Reilly Media, Inc.
- Henry, L., and Wickham, H. (2020), purrr: Functional Programming Tools. R package version 0.3.4. Available at https://CRAN.R-project.org/package=purrr
- Hettler, P. L. (2015), “Student Demographics and the Impact of Team-Based Learning,” International Advances in Economic Research, 21, 413–422. DOI: https://doi.org/10.1007/s11294-015-9539-7.
- Kalaian, S. A., and Kasim, R. M. (2014), “A Meta-Analytic Review of Studies of the Effectiveness of Small-Group Learning Methods on Statistics Achievement,” Journal of Statistics Education, 22, null. DOI: https://doi.org/10.1080/10691898.2014.11889691.
- Kolaczyk, E. D., Wright, H., and Yajima, M. (2021), “Statistics Practicum: Placing ‘Practice’ at the Center of Data Science Education,” Harvard Data Science Review. DOI: https://doi.org/10.1162/99608f92.2d65fc70.
- Koles, P. G., Stolfi, A., Borges, N. J., Nelson, S., and Parmelee, D. X. (2010), “The Impact of Team-Based Learning on Medical Students’ Academic Performance,” Academic Medicine, 85, 1739–1745. DOI: https://doi.org/10.1097/ACM.0b013e3181f52bed.
- Kopf, S., Tamanaha, J., and Vance, E. (2019), tbltools, R, Kopf Lab at the University of Colorado Boulder.
- Lasserre, P., and Szostak, C. (2011), “Effects of Team-Based Learning on a CS1 Course,” in Proceedings of the 16th annual joint conference on Innovation and Technology in Computer Science Education (ITiCSE ’11), New York, NY, USA: Association for Computing Machinery, pp. 133–137. DOI: https://doi.org/10.1145/1999747.1999787.
- Macke, C., Canfield, J., Tapp, K., and Hunn, V. (2019), “Outcomes for Black Students in Team-Based Learning Courses,” Journal of Black Studies, 50, 66–86. DOI: https://doi.org/10.1177/0021934718810124.
- Michaelsen, L. K., and Fink, L. D. (2002), “Calculating peer evaluation scores,” in Team-Based Learning: A Transformative Use of Small Groups, Westport, Conn: Praeger, pp. 233–244.
- Michaelsen, L. K., Fink, L. D., and Knight, A. (1997), “Designing Effective Group Activities: Lessons for Classroom Teaching and Faculty Development,” To Improve the Academy, 16, 373–397. DOI: https://doi.org/10.1002/j.2334-4822.1997.tb00335.x.
- Michaelsen, L. K., Knight, A. B., and Fink, L. D. (2004), Team-Based Learning: A Transformative Use of Small Groups in College Teaching, Sterling, VA: Stylus.
- Michaelsen, L. K., and Sweet, M. (2008), “The Essential Elements of Team-Based Learning,” New Directions for Teaching and Learning, 2008, 7–27. DOI: https://doi.org/10.1002/tl.330.
- Michaelsen, L., and Richards, B. (2005), “COMMENTARY: Drawing Conclusions from the Team-Learning Literature in Health-Sciences Education: A Commentary,” Teaching and Learning in Medicine, 17, 85–88. DOI: https://doi.org/10.1207/s15328015tlm1701_15.
- National Academies of Sciences, Engineering, and Medicine. (2018), Data Science for Undergraduates: Opportunities and Options, Washington, DC: The National Academies Press.
- Nolan, D., and Lang, D. T. (2010), “Computing in the Statistics Curricula,” The American Statistician, 64, 97–107. DOI: https://doi.org/10.1198/tast.2010.09132.
- Parmelee, D., Michaelsen, L. K., Cook, S., and Hudes, P. D. (2012), “Team-based learning: A practical guide: AMEE Guide No. 65,” Medical Teacher, 34, e275–e287. DOI: https://doi.org/10.3109/0142159X.2012.651179.
- Paterson, J., and Sneddon, J. (2011), “Conversations About Curriculum Change: Mathematical Thinking and Team-Based Learning in a Discrete Mathematics Course,” International Journal of Mathematical Education in Science and Technology, 42, 879–889. DOI: https://doi.org/10.1080/0020739X.2011.613487.
- Peters, T., Johnston, E., Bolles, H., Ogilvie, C., Knaub, A., and Holme, T. (2020), “Benefits to Students of Team-Based Learning in Large Enrollment Calculus,” PRIMUS, 30, 211–229. DOI: https://doi.org/10.1080/10511970.2018.1542417.
- R Core Team. (2021), R: A Language and Environment for Statistical Computing, Vienna, Austria: R Foundation for Statistical Computing.
- Roseth, C. J., Garfield, J. B., and Ben-Zvi, D. (2008), “Collaboration in Learning and Teaching Statistics,” Journal of Statistics Education, 16, 1–15. DOI: https://doi.org/10.1080/10691898.2008.11889557.
- RStudio Team. (2021), RStudio: Integrated Development Environment for R, Boston, MA: RStudio, PBC.
- Sharp, J. L., Griffith, E. H., and Higgs, M. D. (2021), “Setting the Stage: Statistical Collaboration Videos for Training the Next Generation of Applied Statisticians,” Journal of Statistics and Data Science Education, 29, 165–170. DOI: https://doi.org/10.1080/26939169.2021.1934202.
- Sibley, J., and Spiridonoff, S. (2014), Introduction to Team-Based Learning, Vancouver, BC: University of British Columbia Faculty of Applied Science: Centre for Instructional Support.
- St. Clair, K., and Chihara, L. (2012), “Team-Based Learning in a Statistical Literacy Class,” Journal of Statistics Education, 20. DOI: https://doi.org/10.1080/10691898.2012.11889633.
- Stonewall, J., Dorneich, M., Dorius, C., and Rongerude, J. (2018), “A Review of Bias in Peer Assessment,” in Paper presented at 2018 CoNECD - The Collaborative Network for Engineering and Computing Diversity Conference, Crystal City, Virginia. Available at https://peer.asee.org/29510.
- Thabane, L., Walter, S. D., Hanna, S., Goldsmith, C. H., and Pullenayegum, E. (2008), “Developing a Biostatistical Collaboration Course in a Health Science Research Methodology Program,” Journal of Statistics Education, 16, 1–16. DOI: https://doi.org/10.1080/10691898.2008.11889564.
- Thomas, P. A., and Bowen, C. W. (2011), “A Controlled Trial of Team-Based Learning in an Ambulatory Medicine Clerkship for Medical Students,” Teaching and Learning in Medicine, 23, 31–36. DOI: https://doi.org/10.1080/10401334.2011.536888.
- Vance, E. (2013), “Using Team-Based Learning to Teach Effective Communication and Collaboration,” in 5th Annual Conference on Higher Education Pedagogy, Blacksburg, VA: Virginia Tech’s Center for Instructional Development and Educational Research, pp. 296–297.
- Vance, E. A. (2015), “Recent Developments and Their Implications for the Future of Academic Statistical Consulting Centers,” The American Statistician, 69, 127–137. DOI: https://doi.org/10.1080/00031305.2015.1033990.
- Vance, E. A. (2021), “Teaching Introductory Data Science with TBL,” Open Science Framework. Available at https://osf.io/569qy/.
- Vance, E. A., Alzen, J. L., and Seref, M. M. H. (2020), “Assessing Statistical Consultations and Collaborations,” in JSM Proceedings, Alexandria, VA: American Statistical Association: Statistical Consulting Section, pp. 161–169.
- Vance, E. A., and Smith, H. S. (2019), “The ASCCR Frame for Learning Essential Collaboration Skills,” Journal of Statistics Education, 27, 265–274. DOI: https://doi.org/10.1080/10691898.2019.1687370.
- Wickham, H. (2016), ggplot2: Elegant Graphics for Data Analysis, New York: Springer-Verlag.
- Wickham, H. (2020), modelr: Modelling Functions that Work with the Pipe. R package version 0.1.8. Available at https://CRAN.R-project.org/package=modelr.
- Wickham, H., Averick, M., Bryan, J., Chang, W., McGowan, L. D., François, R., Grolemund, G., Hayes, A., Henry, L., Hester, J., Kuhn, M., Pedersen, T. L., Miller, E., Bache, S. M., Müller, K., Ooms, J., Robinson, D., Seidel, D. P., Spinu, V., Takahashi, K., Vaughan, D., Wilke, C., Woo, K., and Yutani, H. (2019), “Welcome to the tidyverse,” Journal of Open Source Software, 4, 1686. DOI: https://doi.org/10.21105/joss.01686.
- Wickham, H., and Grolemund, G. (2016), R for Data Science: Import, Tidy, Transform, Visualize, and Model Data, Sebastopol, CA: O’Reilly Media, Inc.
- Winquist, J. R., and Carlson, K. A. (2014), “Flipped Statistics Class Results: Better Performance Than Lecture Over One Year Later,” Journal of Statistics Education, 22, 1–10. DOI: https://doi.org/10.1080/10691898.2014.11889717.
- Young-Saver, D. (2021), “Skew The Script: A Website Offering Socially Relevant Math Lessons,” Statistics Teacher, Available at https://www.statisticsteacher.org/2021/04/12/skew-the-script/.
Appendix A:
An Example iRAT/tRAT for Module 2
This iRAT occurred on the first day of Week 3 and was based on the reading assignment for Module 2, which was Chapters 2–4 from R4DS (r4ds.had.co.nz). Students were explicitly assigned to read all three chapters and do all of the exercises to prepare for Module 2. These iRAT questions are either extensions of examples from R4DS or are based on the book’s exercises. The average score was around 6 out of 10. Students who read the chapters and did the exercises found the test straightforward and often end up teaching some of these concepts to their teammates during the tRAT (which is the exact same 10 questions). Students who read the chapter but did not do the exercises often learned the key concepts while participating in the tRAT discussion and hopefully learned to do the book exercises in the future. Students who did not read the chapter failed this iRAT and learned to do the readings and exercises for future modules. The last three questions were nongraded feedback for the instructor.
11. Which code would produce the following plot?
Table
12. An aesthetic is a visual property of the objects in your plot. Which of the following is NOT an aesthetic of the data points in the above plot?
Shape
Color
Location
Size
All of these are aesthetics of the points
13. In the code that generated the plot above (the correct answer for #11), which aesthetic was explicitly coded (i.e., was not determined by the default of the geom function used)?
Shape
Color
Location
Size
All of the these were explicitly coded
14. Ignoring the color aesthetic and the legend, which code would produce the following plot?
Table
15. Which change in the code from above (#14) would have produced the exact plot above (i.e., which code addition would add the color and the legend)?
ggplot(data
mpg, mapping
geom_point(aes(x
geom_point(aes(x
None of these
facet_grid(class ˜drv, aes(color
16. This code will create which plot?
Table
17. Which code would generate plot 16e above?ggplot(datampg) +
geom_point(aes(x
geom_point(aes(x
geom_point(aes(x
geom_point(aes(x
geom_point(aes(x
18. A. True or B. False: The following two snippets of code will NOT produce the same plot.
Table
19. Which of the following code would create the sequence 2 4 6 8?
seq[2, 8, by
seq(2, 8, by
seq[2, 8]
seq[2, 4, 6, 8]
seq(2, 8, length.out
20. Why is geom_jitter() useful when plotting a scatter plot of points on the x and y axes?
It makes outliers (very high values and very low values in the data) a different color
It makes the plot quicker to produce because not as many points must be plotted
It prevents overplotting, so values in the data don’t get hidden behind each other
All of the above
None of the above
What is one thing you think the professor should KEEP doing?
One thing he should STOP doing?
One thing he should START doing?
Appendix B:
Example Team Application Exercises
Students received paper handouts of Team Application Exercises (tAPPs) at the beginning of each class. Below is a set of tAPPs for Spring 2018 on the topics of “Observational study v. Designed experiments” and “Simpson’s Paradox.” Text in bold and the figure on Simpson’s paradox from Wikipedia was added to the tAPP in Fall 2019. Self-evaluation scores on the SLO of Simpson’s paradox increased from 2.43 in Spring 2018 to 3.31in Fall 2019, perhaps based on this added material.
Team Application Exercises: “Observational study v. Designed experiments” and “Simpson’s Paradox”
A randomized trial is an example of a designed experiment, which is considered the gold standard for evidence-based research. Such experiments, sometimes called A/B tests, are commonly undertaken to compare the effect of a treatment (e.g., probability of purchasing an item on two different Web pages). By controlling who receives a new intervention and who receives a control (or standard treatment), the investigator ensures that, on average, all other factors are balanced between the two groups. This allows them to conclude that if there are differences in the outcomes measured at the end of the trial, they can be attributed to the application of the treatment.
While they are ideal, randomized trials and other designed experiments are not practical in many settings. It is unethical to randomize some children to smoke and the others not to smoke to determine whether cigarettes cause lung cancer. It is not practical to randomize adults to either drink coffee or abstain to determine whether coffee has long-term health impacts. Data from observational studies may be the only feasible way to answer important questions.
A confounding variable is an “extra” variable not accounted for in a study that affects the relationship between two other “main” variables.
1. (Warm-up) Quickly decide individually then as a team which of the following is an example of an Observational study (A), Designed experiment (B), or (C) none of these.
Google selects a random group to see a different font on their search page—does the font affect search behavior?
Toyota tests varieties of spark plugs to see which provide better engine performance
A marketing survey to understand which Super Bowl ads were most effective
Determining long-term trends in climate to understand effects of CO2 in the air
Study of how dust on solar panels reduces efficiency
DNA ancestry testing company determining which genes may influence if a person sneezes while eating chocolate What are other examples?
Simpson’s paradox (from Wikipedia) is a phenomenon in probability and statistics, in which a trend appears in several different groups of data but disappears or reverses when these groups are combined.
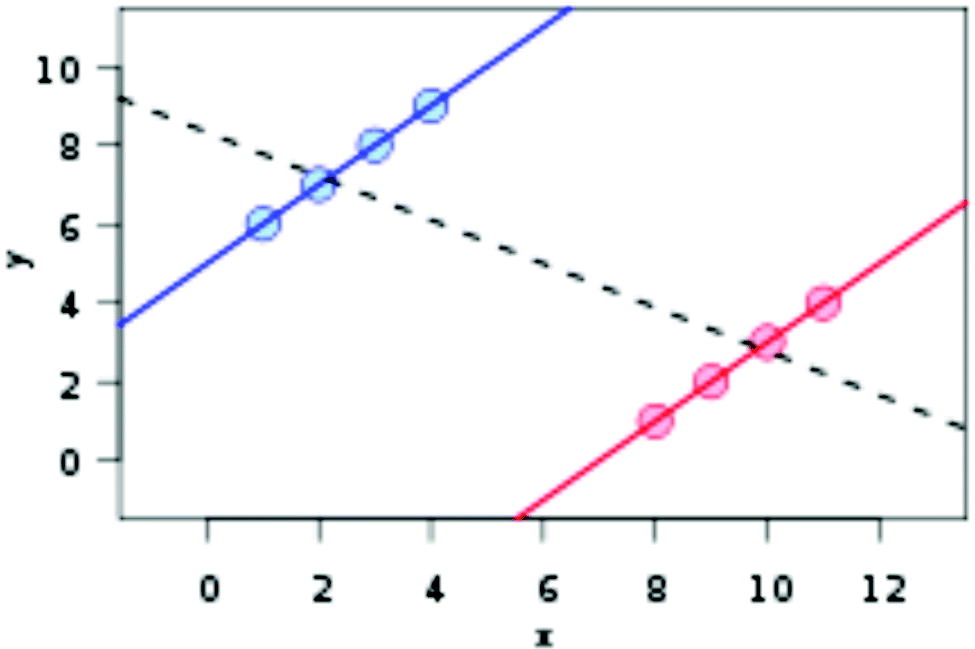
Simpson’s paradox for quantitative data: a positive trend () appears for two separate groups, whereas a negative trend (—-) appears when the groups are combined.
2. Which drug (A or B) is more effective at curing the disease? Which would you take?
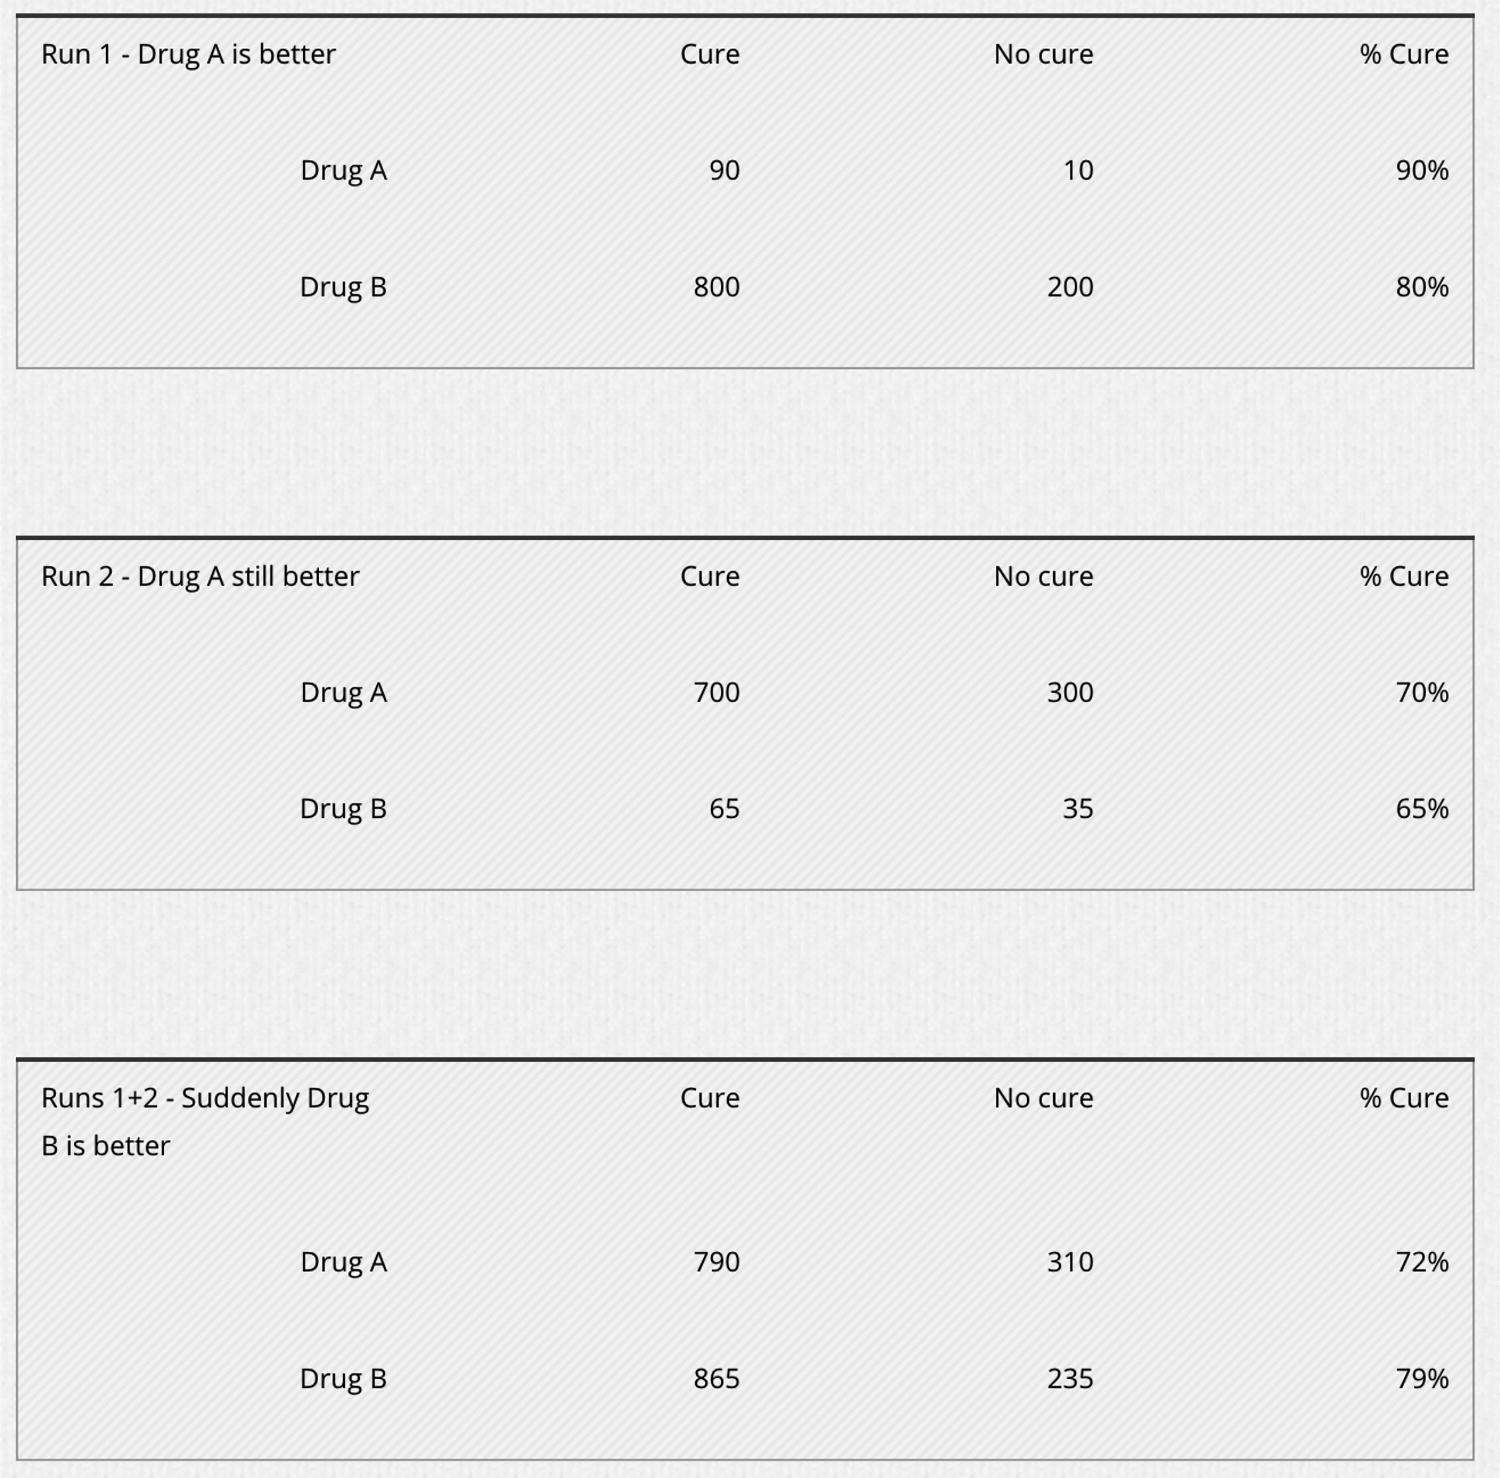
3. What if the context is Run 1 Boulder, CO, Run 2
Birmingham, Alabama?
4. What if the context is random assignment to Run 1 and Run 2?
5. What if the context is Run 1 males, Run 2
females?
3/6. Who had a higher batting average (hits/at bats) in 1923? A. Babe Ruth B. Lou Gehrig
Table 6. Yankee Teammates Ruth and Gehrig, 1923–1925.
4/7. Who had a higher batting average in 1924?
5/8. 1925?
6/9. Overall, who was the better batter, in terms of batting average?
A. Babe Ruth B. Lou Gehrig
7/10. What do you think of these results? Does it seem unusual to you? Can you think of another example of this effect in real life?
Appendix C:
Course Overview and Schedule
Overview
This course introduces importing, tidying, exploring, visualizing, summarizing, and modeling data and then communicating the results of these analyses to answer relevant questions and make decisions. Students will learn how to program in R using reproducible workflows. During weekly lab assignments students will collaborate with their teammates to pose and answer questions using real-world datasets.
Learning Objectives
To develop technical and professional skills necessary to analyze data as a member of a team. This includes:
Understanding fundamental statistical concepts
Visualizing and exploring data
Importing and tidying datasets
Programming effectively in R
Building basic statistical models
Collaborating with teammates to discover and communicate interesting findings and recommendations based on data.
Mastering reproducible statistical workflows.
In other words, to learn R to do interesting and useful things with data.
Statistical Concepts Introduced
Difference between designed experiments and observational studies
Correlation v. causation & confounding variables
Calculating probabilities, Simpson’s Paradox, Bayes Rule, conditional probabilities
Sampling, populations, and inference from samples about populations
Calculating percentiles, measures of variability, and comparing groups or values
That statistics and data science are useful for description, inference, and prediction
Hypothesis testing via permutation tests
Modules and Chapter Readings from R4DS (Wickham and Grollemund)
The course content is divided into the following seven modules with individual and team tests based on the readings. Readings from www.r4ds.had.co.nz listed below:
Intro: Power of collaboration in data science; Lessons from last year’s students
Module 1—Workflows: Syllabus; Team-based Learning; OSF; RStudio; R Markdown; GitHub (Ch. 1, 26, 27, and 30)
Module 2—Data visualization: using ggplot2 in R to visualize data (Ch. 2–4)
Module 3—Exploratory Data Analysis (EDA): transforming data and EDA (Ch. 5–8)
Module 4—Importing and tidying data: Using readr; tibbles; tidying data (Ch. 9–12)
Module 5—Working with various types of data: Relational data; strings; factors; dates and times (Ch. 13–16)
Module 6—Programming in R: Pipes; functions; vectors; iteration (Ch. 17–21)
Module 7—Statistical modeling: Building and using models to gain insight into data, answer questions, and solve problems (Ch. 22–25).