 ?Mathematical formulae have been encoded as MathML and are displayed in this HTML version using MathJax in order to improve their display. Uncheck the box to turn MathJax off. This feature requires Javascript. Click on a formula to zoom.
Abstract
Metaphors are well-known tools for teaching statistics to novices. However, educators might overlook metaphor theoretical developments that offer nuanced and testable perspectives on their pedagogical applications. This article introduces the notion of metaphor types—“correspondence” (CO) and “class inclusion” (CI)—as different strategic ways of presenting metaphors and reports an experimental study on their effectiveness in teaching basic regression to language and communication majors. Briefly, CO emphasizes systematic links while CI emphasizes holistic perceptions of similarity between the source and target of a metaphor. Both competency and attitudinal measures were compared in view of the latter’s importance as intended outcomes of the typical introductory course. The results show that while CO outperformed CI in assessments of manual calculations (e.g., SST/SSR/SSE/R2), CI outperformed CO in essay assessments requiring elaboration of general conceptual understanding. CI was also linked to more positive perceptions of the practical utility of regression analysis and its contribution to personal growth. Correlations between performance and attitudes were stronger in CO than CI, which further suggests CO’s greater perceived resemblance to a “rote learning” approach. The attendant implications are discussed in the growing context of general statistics education for nonstatistics majors. Directions for further research are suggested.
1 Introduction
Analogies or metaphors function to depict one concept in terms of another. Educationists see them as cognitive bridges that help learners connect a body of “source” knowledge that is more familiar, vivid, or concrete, with new “target” knowledge that is less so (Duit Citation1991). Classic examples include the flowing water model of electricity and the solar system model of the atom (Gentner and Gentner Citation1983). Though metaphors are by definition approximations, they are especially useful when learners have minimal knowledge (Donnelly and McDaniel Citation2000), or during formative stages when the target knowledge itself is still nebulous (Boyd Citation1993; Holyoak and Thagard Citation1995).
The usefulness of metaphors for novice learners is well-recognized by statistics educators (Behar, Grima, and Marco-Almagro Citation2013; Martin Citation2003). Martin (Citation2003) provided a comprehensive list of metaphors for concepts ranging from probability to regression, concluding that they are imperfect but “enormously helpful” for developing statistical intuition. As implied above, a key reason why metaphors like flowing water for electricity seem to be universally helpful is that they draw from concrete real-world experiences that are familiar to all learners. The influential Conceptual Metaphor Theory (Lakoff and Johnson Citation1999) from the fields of cognitive psychology and linguistics in fact argues that all metaphors that shape our conceptualization of abstract concepts are at some level grounded upon concrete bodily experience (see Tay Citation2014, for a summary). Despite attracting a fair amount of criticism (Anderson Citation2003; Haser Citation2005; McGlone Citation2007), the many subsequent developments of this theory offer nuanced and testable perspectives that are overlooked in statistics education research. An example of a development is the notion of “metaphor types” (Tay Citation2012; Wee Citation2005a), which focuses less on the cognitive processes of source-to-target transfer than how the details of this transfer are constructed and communicated to audiences. The two major metaphor types are known as “correspondence” and “class inclusion.”
This article introduces the two metaphor types as teaching strategies that communicate source-target relations in different strategic ways. It reports a classroom experimental study aimed at comparing these strategies in teaching basic linear regression in an introductory undergraduate statistics course. Such introductory courses are becoming more common for novice learners in different disciplines. They often have learning outcomes that emphasize attitudinal elements like personal growth and appreciation of quantitative thinking in nonquantitative fields (Steen Citation2004; Miller Citation2010). It is therefore important to investigate how different teaching approaches could support the attainment of these diverse outcomes. The present study compares the relative influence of the two metaphor types on outcomes related to computational ability, conceptual understanding, and learner attitudes. The results suggest that each metaphor type has relative (dis)advantages in facilitating different outcomes and demonstrate the pedagogical implications of metaphor theory. The following sections introduce the key features and differences between the two major metaphor types, how they are applied to teach basic regression concepts, and discuss the design, results, and implications of the present study.
2 Correspondence (CO) and Class Inclusion (CI) Metaphor Types
CO and CI are best understood as contrasting strategies for presenting how a source is intended to model a target. They are inspired by opposing theoretical models of how source-target relationships are mentally processed (Gentner Citation1983; Gentner and Bowdle Citation2001; Glucksberg Citation2003). Correspondence models posit that source entities, attributes, and/or logical relations are systematically matched to target counterparts. Research on analogies in scientific education tend to assume correspondence models to apply almost by default (Duit Citation1991; Glynn Citation1995). Class inclusion models, on the other hand, do not posit such systematic matching. As implied by the name, the source instead exemplifies some ad hoc conceptual category that also includes the target. This ad hoc category is often constructed on the fly to express some contextually unique point, and has to be named by a metaphor because no conventional label(s) exist for it. This type of model is much less often discussed in pedagogical research. Nevertheless, metaphor types do not make any claims about metaphor processing, but are instead production strategies that reflect the key properties of these processing models (Wee Citation2005a).
Consider, for instance, a science textbook depicting the structure of an atom as the solar system. This metaphor is most likely to be communicated using the CO strategy. We can expect explicit verbal and/or pictorial depiction of the nucleus corresponding to the sun, electrons orbiting the nucleus to planets orbiting the sun, the electromagnetic force to gravity, and so on. On the other hand, consider the famous line “life is like a box of chocolates” from the movie Forrest Gump. The CO strategy would be ineffective here because the intention is not to systematically compare elements of life with elements of chocolates. Instead, the speaker wants to express the general ad hoc idea that “you never know what you’re going to get,” and uses a box of chocolates to exemplify this punchline in an appealing way. Both the source (chocolates) and target (life) are thus members of this ad hoc conceptual category we might call “unpredictable things.” illustrates the two strategies in schematic visual form.
Fig. 1 Schematic forms of CO and CI.
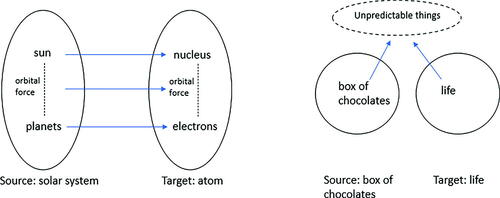
In principle, any metaphor can be communicated via either strategy, since the key difference between the strategies lies with how source-target relations are subjectively construed. The two strategies are however often seen as contrasting prototypes, with examples from popular science texts to counseling interaction preferring either depending on the objectives at hand (Tay Citation2010, Citation2012; Wee Citation2005a). They respectively resemble the notions of “structural” versus “superficial similarity” (Blanchette and Dunbar Citation2000). The former highlights logical relations between entities, while the latter highlights an overall perception of resemblance as key to analogy. Importantly, they redirect attention from metaphor processing to the equally important issue of how pedagogical metaphors could be communicated in different strategic ways. For example, CO’s emphasis on structure implies that the source does not need to be presented as holistically similar to the target as long as structural integrity between relevant components is highlighted. The source as a whole could in fact be fictional or even nonsensical as pointed out by Wee (Citation2005b) in his discussion of Kosslyn and Koenig’s (Citation1992) “rows of octopi” metaphor for connectionist architecture. In this metaphor, readers were first asked to imagine an unreal but vivid scenario where numerous octopi squeezed or tickled one another. They were then told that each octopus corresponded to an information processing unit, and the behavior of the octopi corresponded to different network connections between units. The pedagogical point is thus made even though the octopi source is clearly and intentionally nonsensical. On the other hand, while not insisting on systematic relationships between source and target elements, CI emphasizes some overarching similarity between source and target that is more readily perceived when both are realistic.
These differences bear underexplored implications for designing pedagogical metaphors, especially in cases where learning outcomes are multifaceted. While the two metaphor types have yet to be tested in their presently defined forms, relevant studies suggest that structurally similar metaphors (by implication, the CO strategy) facilitate deeper knowledge development and superficially similar metaphors (CI strategy) facilitate greater recall (Duit Citation1991; Glynn Citation1995; Quilici and Mayer Citation1996). In other words, the former might help in developing a more detailed understanding of concepts, while the latter might make concepts more memorable and thus promote a better grasp of the “big picture.” The contemporary emphasis on ‘statistical thinking’ over rote learning (Garfield et al. Citation2002; Jordan and Haines Citation2006), coupled with the growing role of quantitative literacy in non-STEM programmes (Rodgers Citation2020), provides a useful context for evaluating the strengths, weaknesses, and outcomes of these metaphor types for novice learners in particular. For example, an introductory elective course is likely to focus not just on formulas and computational skills, but also on appreciating the bigger picture of how quantitative analysis is applicable to different settings.
3 Metaphor Types and the Basic Logic of Linear Regression
This article reports a study of the two metaphor types as contrasting strategies for teaching basic linear regression in an introductory course. It was conducted face-to-face before the COVID-19 pandemic, and all ethical guidelines for research involving human subjects were followed. The course is an optional elective in a language and communication degree programme that introduces basic statistical knowledge and their relevance for future careers in teaching, sales and marketing, the media, and so on. Other topics covered in the course include descriptive and inferential statistics, basic hypothesis testing, data visualizations, and writing up quantitative analyses in different contexts such as teaching portfolios, sales reports, and newspapers. There are no prerequisites, and all students are majoring in the aforementioned language and communication degree programme. The study is embedded in a single three-hour session covering the following basic concepts of linear regression.
Ordinary least-square regression applied to one predictor and one outcome variable
The total sum of squares (SST), regression sum of squares (SSR), and error sum of squares (SSE), and their relationship (SST = SSR + SSE)
Manual calculation of SST, SSR, and SSE
The coefficient of determination R2 as a measure of model fit
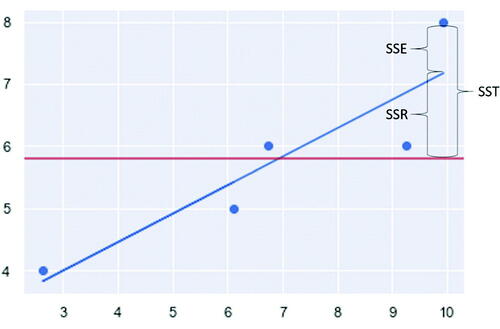
The session is scheduled for the third week of the course, after two weeks on basic descriptive statistics and hypothesis testing. This helps ensure that the outcome measures (see next section) reflect the effects of metaphor types rather than accumulated knowledge over the semester. It begins with an introduction to linear regression using a standard instructional diagram of the scatterplot, regression line, mean of the outcome variable, and SST/R/E ().
Fig. 2 Standard instructional diagram for linear regression.
The students are also introduced to the following formulas and taken through examples of their manual calculation. These examples, each with its own scatterplot, are based on a scenario of predicting students’ English exam scores using the number of study hours. The examples resemble the eventual assessment exercise detailed in the next section and Appendix A. They reflect a key requirement for such elective courses to expose students to the specifics of foundational methods in different disciplines.
It should be noted that from the perspective of conceptual metaphor theory (Lakoff and Johnson Citation1999) as briefly explained in the introduction, the standard instructional diagram in could already be considered as metaphorical. One might object that the “dots” and “distance between each dot and the regression line” are respective symbolic representations of ‘students’ and “residuals,” rather than metaphors in the commonly understood sense. Conceptual metaphor theorists would instead assert that the essence of metaphoricity lies in its conceptualization function. is therefore metaphorical because it helps us understand the meaning of residuals, which are not inherently spatial, using the basic properties of Euclidean space. For example, the larger the distance between dot and line, the greater the residual quantity. However, the pertinent point is that this metaphor is highly conventional, and learning materials therefore seldom explicitly acknowledge it as a metaphor. Learners might therefore not consciously transfer inferences from source to target without explicit instructional cues (Steen Citation2013). In this conventional form, it therefore cannot be considered as an instance of strategic use of a metaphor type. , and the instruction of formulas that follows, thus serve only as an initial introduction for students prior to them experiencing either metaphor type as an elaboration of this basic understanding.
The CO strategy builds upon and the formulae as described above by having the instructor juxtapose source and target elements and highlight their inferential relationships in an explicit way. The following is a summary of the key points delivered by the instructor. Source elements (i.e., spatial descriptions) are italicized and target elements (the topic of the regression analysis) are in bold, illustrating the close correspondences between each pair of elements.
It is helpful to visualize regression analysis in terms of dots and lines in physical space.
Each dot on the scatterplot represents a student. The distance between the dots therefore represents how different their scores and study hours are. The further the distance between dots, the greater the variability among students.
The horizontal line is the mean line. It represents the mean exam scores and divides the territory between the above and below average students. The total distance between the dots and the line is the total variability in exam scores. If the dots are close to the line, there is less variability, and the scores are easier to predict. However, if the dots are scattered far apart, there is more variability, and the scores are harder to predict.
The straight regression line represents our regression model. Each point on the line represents the predicted performance score based on the number of study hours. The vertical distance between each dot and its corresponding point on the line represents the error or residual. The smaller the distance between the line and the dots, the more accurate the prediction is. From another perspective, we can also say that the total distance between points on the regression line and the mean line represents the variability explained by the model. In general, we want to minimize prediction errors and maximize the explained variability. In real life, it is almost impossible to have a model with absolutely no error, because there is always some unknown variability that cannot be explained.
As explained earlier, the CO strategy focuses on “local” correspondences between source and target elements instead of some overarching resemblance between them. There is no sustained attempt to highlight any general similarity between physical space and regression analysis.
The alternative CI strategy, which adopted a radio station analogy from Martin (Citation2003), is summarized below. It likewise aims to build upon basic understanding of and the formulae. However, instead of a systematic juxtaposition of source and target elements, the main aim is to highlight both regression analysis and the radio station/signal as equivalent real-life exemplars of an ad hoc category that might be described as “minimizing error.”
It is helpful to visualize regression analysis in terms of a radio station broadcasting a signal.
Imagine that I am listening to this broadcast from a long distance away. What I hear will not be identical to the original signal, because of some form of interference or signal degradation which we call “noise” in general. In other words, the signal I hear is actually made up of the original signal from the station plus this noise. Engineers will use different techniques and tools to make the signal I hear as close as possible to the original signal, or to reduce the noise. However, it is very difficult to achieve zero noise.
Regression analysis follows the same principle. We are given data on the exam performance and number of study hours for a sample of students, and we want to see if there is a relationship between them, so that we can predict exam performance based on study hours for students not in the sample. This prediction will not be perfectly accurate because there is also “noise” in our data. The number of study hours may partly explain differences in performance, but there are other factors that we did not measure or expect. Just as engineers use different techniques and tools to reduce noise in the radio signal, regression analysts use different techniques and tools to optimize the predictions using the data available. And just as achieving zero signal loss is very difficult, in the most situations it is almost impossible for predictions to have absolutely no error. This is because there is always some unknown variability that cannot be explained.
4 Design and Hypotheses
The intended learning outcomes of the elective course are for students to
apply basic statistical knowledge to describe and make inferences about data
integrate verbal and numerical modes of reasoning to solve real world problems
understand the complementary nature of verbal and numerical literacy in the workplace
develop critical awareness of the applicability of quantitative analysis in language-related professions
Besides basic subject matter knowledge like statistical concepts and computations, these outcomes emphasize a broader appreciation for, and positive attitudes toward, applying statistical analysis to real world problems. As mentioned above, they provide an opportunity to investigate the cognitive as well as motivational and affective roles of metaphors (cf. Tay Citation2020a). The relative effectiveness of the CO and CI metaphor types will thus be evaluated along three aspects that reflect these outcomes. The first two relate to competency and the third to attitudes.
ability to manually compute SSE/SSR/SST/R2
ability to explain how regression can be applied to humanities-related work/research
perceptions of how regression analysis is practically useful, and contributes to students’ personal growth
While it is widely believed that manual calculations are no longer necessary in the age of statistical software and emphasis on “statistical thinking,” a key institutional requirement for elective courses is to introduce elements that impress upon students the foundational logic and concepts underpinning different disciplines, before discussing broader issues. The manual calculation of SSE/R/T/R2 was thus evaluated with an in-class exercise (30 marks), with reference to a specific context relevant to language and communication majors; that is, prediction of English test scores using interest levels of a hypothetical group of students (Appendix A). Calculating the predicted scores, residuals, squared differences between observed scores/predicted scores/residuals, and eventually R2, would give students a step-by-step appreciation of the components leading up to how the optimal regression line is determined under the least-square approach. Nevertheless, they were allowed to use calculators such that basic errors not indicative of lack of understanding would be minimized.
Next, to explain how regression can be applied to their work and research, students completed a 300-word take home essay assignment (30 marks) where they identified a workplace/research question and discussed how regression analysis would add value to its solution. Value-addedness here implies comparison between regression and other conventional means of solving the problem without it. The two equally weighted assessments constitute a holistic assessment strategy in that they collectively address the intended learning outcomes, and allow students majoring in language and communication to demonstrate their knowledge in both new and familiar ways, through calculations and essay writing respectively.
Finally, perceptions of utility and personal growth were measured by a 10-item in-class survey adopted from previous research (Jordan and Haines Citation2006; Korey Citation2000). The original Mathematics Attitude Survey designed and conducted at Dartmouth College targeted students from optional “math and humanities courses” that blended mathematical and humanistic ideas in an inter-disciplinary way. It was therefore deemed appropriate for the present students who are in a similar situation as humanities majors opting for a similar inter-disciplinary elective course. The two constructs of “practical utility” and “personal growth,” each represented by five items, were of particular interest because they align closely with the broad aims of such elective courses—to teach something that can be put to practical use in the students’ current and future professional lives (i.e., practical utilty), and to cultivate lifelong appreciation for and development of knowledge and skills (personal growth). The 10 items were reworded by substituting the word “mathematics” with the more specific “regression analysis.” They were scored on a 5-point Likert scale where 5 = strongly agree and 1 = strongly disagree. Both practical utility (5 items, Cronbach’s ) and personal growth (5 items, Cronbach’s
) attained high scale reliability in the present study. Students were also invited to give optional open-ended comments on how their responses were shaped by their learning experience. See Appendices A–C for the assessment, essay rubrics, and survey items.
All students (N = 50) answered in the negative when asked in the first lecture if they have previously taken a formal course that included linear regression. They were randomly assigned in a between-subjects design to either the CO or CI group (N = 25 each) taught by the same instructor. The session began with an initial common introduction to basic concepts as shown in (60 min), followed by subsequent elaboration with either metaphor type (60 min), and in-class assessment of manual calculations (30 min). A 10-min break was given after each segment. Students were then given three days to submit the essay assignment and completed the in-class survey in the next session. Both assessments were graded anonymously and in random order, such that the grader did not know which group each script belonged to. Based on the theoretical properties of the two metaphor types as reviewed above, it was hypothesized that
Students in the CO group will outperform CI in manual calculations. These calculations are procedural in nature and require close attention to the differences/logical relations between observed, predicted, and mean values for each data point. By construing these logical relations as physical spaces between dots and lines and highlighting “local correspondences” (i.e., the role of each individual dot), the CO metaphor type should capture the logic and processes of these manual calculations better.
Conversely, students in the CI group will outperform CO in the essay, which requires a broader conceptual understanding of linear regression and its applicability to other situations. This outcome should benefit more from CI’s emphasis on the overarching similarity between regression and signal noise reduction, which stimulates thinking about other contexts in which “minimizing error” is the key objective.
Differences are also expected for the survey measures, but our current understanding of the two metaphor types does not allow clear predictions about their relative influence on perceived practical utility and personal growth. Although the CI metaphor type might be generally seen as more “realistic” as suggested above, the CO metaphor type could well be perceived as more “comprehensive,” and either of these attributes could be linked with subjective perceptions of utility and personal development. Besides addressing this comparison in the current study, the relationship between attitudinal ratings and competency measures will also be explored given the general interest in how attitudes and (perceived) performance are related, especially among different sub-groups of students (Depaolo and Mclaren Citation2006; Dowker et al. Citation2019).
5 Results and Discussion
5.1 Competency Measures
shows the boxplots and raw scores of the calculation and essay assessments for the two groups. The lowest score in the CI group for calculation (12 marks) is an outlier as indicated by the diamond shape. The outlier is included in all subsequent calculations. Significance levels for all statistical tests are set at 0.05.
Fig. 3 Performance scores of CO vs. CI metaphor types.
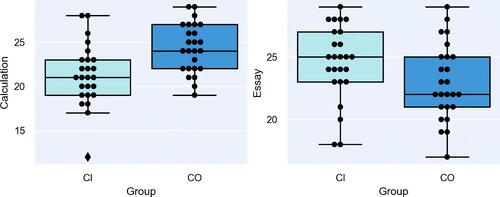
For manual calculations (30 marks), the CO group had a mean score of 24.36(SD = 2.78), 95% CI [23.27–25.45], while the CI group had a mean score of 21.28(SD = 3.48), 95% CI [19.91–22.65]. A two-tailed independent t-test was performed to compare the two groups. Assumptions of normality and homogeneity of variances
were met. The difference was statistically significant,
. The CO group had both a higher maximum (29 marks vs. 28 marks) and minimum (19 marks vs. 12 marks). The results support the first hypothesis, and the idea that presenting a pedagogical metaphor via systematic source-to-target correspondences, thus emphasizing “localized” details over the bigger conceptual picture, benefits assessment tasks like manual calculations that require such a focus. The CI metaphor type, on the other hand, does not impart a clear inferential logic that dovetails with the requirements of the calculations. It would be interesting for follow-up research to discover, using introspective methodologies like semi-structured interviews, if and how the CO metaphor type is actually “activated” in the students’ minds and reasoning processes as they perform the calculations. For example, when computing the residuals for each data point in the third column of the assessment (Appendix A), whether students recall that larger spaces between the dots and regression line translate to higher values, and whether the same inferential logic is sustained in subsequent columns.
For the essay assessment (30 marks), the CO group had a mean score of 22.96(SD = 3.02), 95% CI [21.78–24.14], while the CI group had a mean score of 24.64(SD = 2.81), 95% CI [23.47–25.81]. A two-tailed independent t-test was performed to compare the two groups. Assumptions of normality (W = 0.990, p = 0.849) and homogeneity of variances (F = 0.320, p = 0.576) were met. The difference was statistically significant, , p = 0.046, the CI group outperforming CO this time. Both groups have the same maximum (29 marks), while the CI group had the higher minimum (19 marks vs. 18 marks). The results support the second hypothesis that spotlighting the overarching point in a pedagogical metaphor facilitates outcomes that focus on appreciation and extension of general principles rather than technical details. For example, students were asked to explain how regression adds value to conventional ways of analyzing data in their field. This is a fairly typical “big picture” question that is more effectively answered by explaining how the main ideas of regression analysis apply to the real-life target context in question without needing to go into technical details. The CI metaphor type better prepared them for this task, since the source was selected based on its realism and ability to reflect overarching similarities. An example of a high-grade essay in the CI group discussed how regression could be used to predict voting preferences based on socio-economic measures like income and education. According to the student, regression analysis adds value to more familiar qualitative ways of studying these preferences like focus groups and semi-structured interviews. This is because it “allows a more balanced and representative view, and prevents more influential people from making their opinions louder than others, which is something like a bad model with a lot of noise.” This answer suggests that the student has emulated the radio station analogy in concluding that interview data alone offer poor ‘models’ of voting preferences with a lot of “noise” that regression analysis can help to reduce. The student demonstrates the aforementioned learning outcome of “statistical thinking,” which emphasizes applicability to real-world problems over computation, skills, and compartmentalized knowledge (Garfield et al. Citation2002). Likewise, it would be interesting to conduct follow-up research to investigate if and how the CI metaphor type is actually directly activated in these reasoning processes.
Summarizing the competency measures, the CO metaphor type was associated with better performance in manual and “localized” computations, while the CI metaphor type was associated with a better articulation of “global” principles and applications of regression analysis. We now consider the association of metaphor types with the students’ ratings of practical utility and personal growth as attitudinal measures.
5.2 Attitudinal Measures
The overall ratings of the constructs, differences between the two metaphor types, and correlations between the students’ performance scores and attitudes for both metaphor types will be discussed in turn. First, to compare overall ratings independent of metaphor type, we averaged each student’s ratings for the five items such that each student had an overall rating for each construct. The overall ratings would shed light on how non-STEM students like the present group generally regard the relevance and value of statistics knowledge. Personal growth had a mean score of 3.32(SD = 0.62), 95% CI [3.15–3.49], while practical utility had a mean score of 3.48(SD = 0.65), 95% CI [3.30–3.65]. A nonparametric Wilcoxon signed rank test was conducted to compare the two. The difference was statistically significant, Z = 99.5, p < 0.001, with the practical utility of regression rated higher overall than its contribution to personal growth. The maximum rating for both constructs was 4.80/5.00, while the minimum rating for practical utility was higher (1.40 vs. 1.20). Although non-STEM courses often emphasize broader qualities like critical thinking over the acquisition of specific skill sets or technical knowledge, this result suggests that STEM-related courses would still be appealing to non-STEM students even if their practical value were emphasized instead. Furthermore, both the highest rated items in each construct (U5: “Many situations in the world around me can be modeled by regression analysis” and PG5: “Regression analysis raises interesting new questions about the world”) describe an extended application of classroom concepts to the general world, compared with other items that are more restricted to individual students’ immediate concerns (e.g., other subjects, personal experiences, and my life). This also reflects non-STEM students’ perception of, and positive attitudes toward, the general relevance and use of regression analysis. Additionally, among the optional comments provided by 21 students, none expressed doubt or cynicism about the relevance of a basic statistics course in a language and communication programme. There might however be some bias in this outcome since students who selected the course in the first place might already appreciate its relevance more than those who did not.
Next, we compare how the CO and CI metaphor types were individually rated. shows the distribution of ratings for all personal growth (PG1–PG5) and practical utility (U1–U5) items between the two metaphor types. The number of responses in each category is indicated on the respective bar.
Fig. 4 CO vs. CI ratings of practical utility and personal growth.
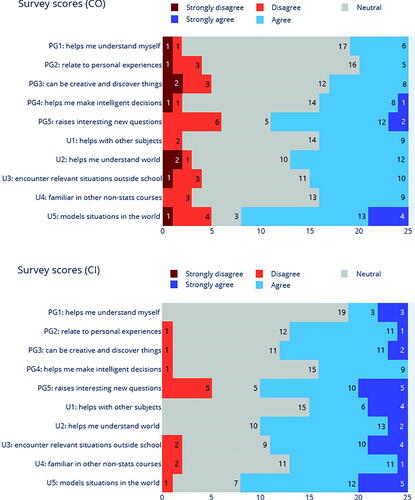
The CO group had a mean personal growth rating of 3.17(SD = 0.66), 95% CI [2.91–3.43], while the CI group had a higher mean of 3.46(SD = 0.54), 95% CI [3.25–3.67]. For practical utility, the mean rating for the CO group was 3.32(SD = 0.68), 95% CI [3.05–3.59], while CI group again had a higher 3.63(SD = 0.58), 95% CI [3.40–3.86]. Nonparametric Mann-Whitney U tests were performed to compare the two groups. No statistically significant differences were found on the whole between the two groups for either personal growth (U = 251.00, p = 0.23) or practical utility (U = 248.00, p = 0.21). However, we see from that the CI group had a larger proportion of students “strongly agreeing” (10.8% vs. 2.8%), and not a single case of “strongly disgreeing” (0% vs. 3.6%). This may suggest that the CI metaphor type is better able to present regression analysis in a way that is more familiar and reassuring to non-STEM students, thus strengthening their beliefs about its practical utility and contribution to personal growth. As described above, the CI metaphor type focuses on the broad characteristics and functions of regression and establishes general parallels with real-life exemplars, and this relative emphasis on “principles” over “rules” is often seen in the students’ primary field of language and communication studies. This observation is partly supported by the optional comments from the 21 students, 12 of whom were in the CI group and 9 in the CO group. Comments from the CI group included “regression is like a general tool used not only in science, but also language, so I think it is worth learning,” and “I think it is interesting that so many different things can be connected by applying regression.” One student in the CO group, on the other hand, commented that “it is difficult to remember what the dots and lines and space mean and I don’t really know what it has to do with language.” This comment alludes to the systematic source-target correspondences of the CO metaphor type, and seems to suggest that they impede memorability and obscure the “big picture” relevance of the subject matter at hand.
Finally, we explore potential relationships between attitudinal ratings and competency measures, and how these relationships might vary by metaphor type. Previous research has generally found positive relationships between attitude and performance measures (Depaolo and Mclaren Citation2006; Dowker et al. Citation2019), but also point out important variation along factors like learners’ age and prior background in the subject area. These factors do not apply in the present study because the students were of similar age and had no prior statistics background, and the limited pool of students precluded the study of systematic variation along other demographic factors. We instead focus on how performance is related to the two main attitudinal dimensions of practical utility and personal growth. A performance score was first computed for each student by averaging their calculation and essay assessment scores. This was then correlated with their mean rating scores for practical utility and personal growth. shows the scatterplots, histograms, and Spearman’s ρ correlation statistics of the three variables, between the two groups. It should be noted that performance scores were not yet available to students at the point of survey completion because time was needed to grade the assessments. However, the instructor shared model answers prior to the survey so students would have had accurate expectations of their eventual performance.
Fig. 5 Correlations between measures for CO vs. CI metaphor types.
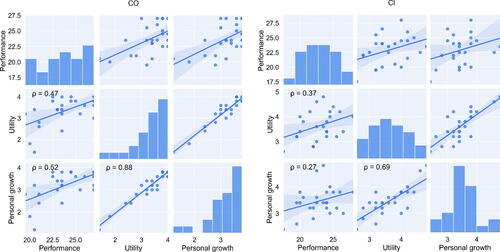
The two attitudinal measures were substantially correlated in both the CO (, p < 0.001) and CI (
, p < 0.001) group. This suggests that regardless of metaphor type, students who value the utilitarian aspects of regression analysis were also likely to perceive its contribution to their personal growth. However, the relationship between attitudinal and performance measures was more evident in the CO group (performance and utility:
, p = 0.017, performance and personal growth:
, p = 0.008). A possible explanation is that although metaphors generally facilitate associative learning, the CO metaphor type is constructed in a way that might be reminiscent of the rote learning approach familiar to students in the present cultural context (Li and Cutting Citation2011). Under this approach, teachers and students alike tend to value memorization of content through repetition, and view performance in examinations as the most relevant and important measure of successful learning. The formulaic instruction that “[source element] represents [target element]” under the CO metaphor type happens to exemplify this feature, and it is therefore more likely for student attitudes to be shaped by their real or expected performance under such a learning mode. On the other hand, the relationship between attitudes and performance was relatively less apparent in the CI group (performance and utility:
, p = 0.069, performance and personal growth:
, p = 0.193). This could be because the CI metaphor type emphasizes broad and principled connections with existing knowledge, with less explicit cues that the material needs to be memorized and tested. Students are therefore more inclined to evaluate utility and contribution to personal growth independently of their performance, reflecting what has been described as “meaningful learning” (Novak Citation2002) rather than rote learning. The earlier quoted comments after could be interpreted as supporting this explanation. While the CI group had comments like “regression…is worth learning” and “…it is interesting that so many different things can be connected by applying regression,” the CO group’s comment that “it is difficult to remember …and I don’t really know what it has to do with language” reflects an implicit assessment-oriented mentality. Two other indicative comments are “I like the idea that regression can solve different problems like what the professor mentioned about the radio signal” (CI group), and “the step-by-step explanation of the dots, lines, and space is good and helps me understand the calculating part” (CO group). Again, the CI comment appears to focus on what regression can generally do outside the classroom, while the CO comment remarks on how the stepwise nature of the CO metaphor type facilitates the assessment task.
6 Conclusion
This article introduced metaphor types as contrasting teaching strategies and investigated their relative effectiveness for both competency and attitudinal-based outcomes in an introductory statistics course for novice learners. Assessment and survey results suggest that (i) the CO metaphor type is better at imparting a clear inferential logic that facilitates the learning of “localized” technical knowledge, (ii) the CI metaphor type is better for developing an appreciation of the “big picture” and the ability to extend general principles to new situations, (iii) the CI metaphor type is marginally more successful in influencing students’ positive perceptions of practical utility and personal growth, and (iv) attitudes were more strongly linked to performance among students in the CO metaphor type group.
The implications of these findings should be considered against the specific context of the present study—teaching statistics to novice learners from a discipline more accustomed to broad conceptual principles than technical knowledge, and less obviously, in a culture used to rote teaching and learning. There are several specific take-away messages for statistics educators. First, teachers need to be aware of the fact that a supposedly general pedagogical strategy like metaphor can be packaged in different forms (as informed by metaphor theory), and these can have varied effects on performance as well as attitudes depending on the intended learning outcomes. While existing research implies that the CO metaphor type is better for explicating concepts because of its systematic and procedural nature, the present findings show that the CI metaphor type can outperform it for tasks that emphasize general argumentation over technical details. The differences in student attitudes toward regression – and statistical analysis in general—as an outcome of differently fine-tuned metaphorical teaching strategies, also emerged as a promising area for more extensive research. Teachers therefore do not need to limit themselves to a specifically prescribed metaphor type, and can select the more strategic one depending on the objective(s) at hand. It is worth reiterating that an important limitation of the present study is the lack of direct evidence on how the CO and CI metaphor types were actually “activated,” or otherwise figured in the cognitive processes involved in the different assessments. Future research could examine introspective and behavioral data from in-depth interviews and psycholinguistic experiments to probe more deeply into how different metaphor types influence reasoning, learning experiences, and attitudinal responses. The glimmer of insight offered by some of the essay and survey responses presented in this study as students engaged with the course contents should offer a useful starting point.
Relatedly, teachers are encouraged to go beyond existing “stock” metaphors in textbooks and other resources, and experiment with (re)constructing and communicating the same metaphor using both the CO and CI strategies. Since the present study was limited to the single example of basic linear regression in one focused session, involving students from only one course, an important future direction is to enlarge the resource pool by designing more usable metaphors that employ multiple modalities (e.g., text, images, and videos), and test them on more diverse student populations. For example, consider the famous metaphor of hypothesis testing as a criminal trial where the null hypothesis/innocence is presumed until sufficient contrary evidence is found. As discussed in (Martin Citation2003, 4) and elsewhere, this metaphor tends to be presented via a CO strategy where source-target relationships (e.g., innocent/guilty defendant →null/alternative hypothesis, and wrongful conviction/acquittal →Type I/II error) are carefully explained. The same metaphor could also be delivered with a CI strategy focusing on informative overarching similarities between criminal trials and hypothesis testing. Possibilities include how both require careful collection and consideration of information, are activities where wrong decisions might be disastrous, abide by socially defined criteria (i.e., different legal systems and significance thresholds), and so on. It is also important for future research to determine the effects of using both metaphor types in combination. This relates to the theoretical question of metaphorical incoherence, or conflicting inferences due to the co-occurrence of different source domains for the same target (Shen and Balaban Citation1999). Incoherence between different ways of elaborating metaphors could also impact teaching and learning, and this should be investigated further.
Last, from a more critical perspective, different student perceptions of the two metaphor types found in the present study are a timely reminder to teachers about the potential drawbacks of metaphor use in statistics education. From the teacher’s perspective, well-known drawbacks include the fact that many metaphors cannot easily capture more complicated concepts like degrees of freedom (Martin Citation2003), or the assumptions that statistical models impose on the data. Less well known, however, are the difficulties or reservations that learners and other “recipients” have about metaphors—a question that has been extensively studied in contexts like advertising and counseling (Burgers et al. Citation2015; Tay Citation2017, Citation2020b), but much less so in statistics education.
References
- Anderson, M. (2003), “Embodied Cognition: A Field Guide,” Artificial Intelligence, 149, 91–130. DOI: https://doi.org/10.1016/S0004-3702(03)00054-7.
- Behar, R., Grima, P., and Marco-Almagro, L. (2013), “Twenty-Five Analogies for Explaining Statistical Concepts,” The American Statistician, 67, 44–48. DOI: https://doi.org/10.1080/00031305.2012.752408.
- Blanchette, I., and Dunbar, K. (2000), “How Analogies Are Generated: The Roles of Structural and Superficial Similarity,” Memory and Cognition, 28, 108–124. DOI: https://doi.org/10.3758/bf03211580.
- Boyd, R. (1993), “Metaphor and Theory Change: What is Metaphor a Metaphor For?” In Metaphor and Thought (2nd ed.), ed. A. Ortony. Cambridge: Cambridge University Press, pp. 481–532.
- Burgers, C., Konijn, E. A., Steen, G. J., and Iepsma, M. A. R. (2015), “Making ads Less Complex, Yet More Creative and Persuasive: The Effects of Conventional Metaphors and Irony in Print Advertising,” International Journal of Advertising, 34, 515–532. DOI: https://doi.org/10.1080/02650487.2014.996200.
- Depaolo, C., and Mclaren, C. (2006), “The Relationship Between Attitudes and Performance in Business Calculus,” Informs Transactions on Education, 6, 8–22. DOI: https://doi.org/10.1287/ited.6.2.8.
- Donnelly, C. M., and McDaniel, M. A. (2000), “Analogy With Knowledgeable Learners: When Analogy Confers Benefits and Exacts Costs,” Psychonomic Bulletin and Review, 7, 537–543. DOI: https://doi.org/10.3758/bf03214368.
- Dowker, A., Cheriton, O., Horton, R., and Mark, W. (2019), “Relationships Between Attitudes and Performance in Young Children’S Mathematics,” Educational Studies in Mathematics, 100, 211–230. DOI: https://doi.org/10.1007/s10649-019-9880-5.
- Duit, R. (1991), “On the Role of Analogies and Metaphors in Learning Science,” Science Education, 75, 649–672. DOI: https://doi.org/10.1002/sce.3730750606.
- Garfield, J., Hogg, B., Schau, C., and Whittinghill, D. (2002), “First Courses in Statistical Science: The Status of Educational Reform Efforts,” Journal of Statistics Education, 10, 1–14.
- Gentner, D. (1983), “Structure-Mapping: A Theoretical Framework for Analogy,” Cognitive Science, 7, 155–170. DOI: https://doi.org/10.1207/s15516709cog0702_3.
- Gentner, D., and Bowdle, B. F. (2001), “Convention, Form, and Figurative Language Processing,” Metaphor & Symbol, 16, 223–247.
- Gentner, D., and Gentner, D. R. (1983), “Flowing Waters or Teeming Crowds: Mental Models of Electricity,” in Mental Models, eds. D. Gentner and A. L. Stevens, Hillsdale, NJ: Lawrence Erlbaum, pp. 99–129.
- Glucksberg, S. (2003), “The Psycholinguistics of Metaphor,” Trends in Cognitive Sciences, 7, 92–96. DOI: https://doi.org/10.1016/S1364-6613(02)00040-2.
- Glynn, S. M. (1995), “Conceptual Bridges. Using Analogies to Explain Scientific Concepts,” Science Teacher, 62, 25–27.
- Haser, V. (2005), Metaphor, Metonymy, and Experientialist Philosophy. Challenging Cognitive Semantics, Berlin: Mouton de Gruyter.
- Holyoak, K. J., and Thagard, P. (1995), Mental Leaps: Analogy in Creative Thought, Cambridge, MA: The MIT Press, p. xiii, 320.
- Jordan, J., and Haines, B. (2006), “The Role of Statistics Educators in the Quantitative Literacy Movement,” Journal of Statistics Education, 14. DOI: https://doi.org/10.1080/10691898.2006.11910583.
- Korey, J. (2000), Dartmouth College of Mathematics Across the Curriculum Evaluation Summary: Mathematics and Humanities Courses, Hanover: Dartmouth College.
- Kosslyn, S. M., and Koenig, O. (1992), Wet Mind: The New Cognitive Neuroscience, New York: Free Press.
- Lakoff, G., and Johnson, M. (1999), Philosophy in the Flesh: The Embodied Mind and its Challenges to Western Thought, New York: Basic Books.
- Li, X., and Cutting, J. (2011), “Rote Learning in Chinese Culture: Reflecting Active Confucian-Based Memory Strategies,” in Researching Chinese Learners: Skills, Perceptions and Intercultural Adaptations, eds. L. Jin and M. Cortazzi. London: Palgrave Macmillan, pp. 21–42.
- Martin, M. A. (2003), “It’s Like…You Know: The Use of Analogies and Heuristics in Teaching Introductory Statistical Methods,” Journal of Statistics Education, 11, 1–28.
- McGlone, M. S. (2007), “What is the Explanatory Value of a Conceptual Metaphor?” Language & Communication, 27, 109–126.
- Miller, J. E. (2010), “Quantitative Literacy Across the Curriculum: Integrating Skills From English Composition, Mathematics, and the Substantive Disciplines,” The Educational Forum, 74, 334–346. Publisher: Routledge _eprint: . DOI: https://doi.org/10.1080/00131725.2010.507100.
- Novak, J. D. (2002), “Meaningful Learning: The Essential Factor for Conceptual Change in Limited or Inappropriate Propositional Hierarchies Leading to Empowerment of Learners,” Science Education, 86, 548–571. _eprint: DOI: https://doi.org/10.1002/sce.10032.
- Quilici, J. L., and Mayer, R. E. (1996), “Role of Examples in How Students Learn to Categorize Statistics Word Problems,” Journal of Educational Psychology, 88, 144–161. DOI: https://doi.org/10.1037/0022-0663.88.1.144.
- Rodgers, J. L. (2020), Teaching Statistics and Quantitative Methods in the 21st Century, New York: Routledge.
- Shen, Y., and Balaban, N. (1999), “Metaphorical (In)Coherence in Discourse,” Discourse Processes, 28, 139–153. DOI: https://doi.org/10.1080/01638539909545077.
- Steen, G. (2013), “Deliberate Metaphor Affords Conscious Metaphorical Cognition,” Journal of Cognitive Semiotics, 5, 179–197. DOI: https://doi.org/10.1515/cogsem.2013.5.12.179.
- Steen, L. A. (2004), Achieving Quantitative Literacy: An Urgent Challenge for Higher Education, Washington, DC: Mathematical Association of America.
- Tay, D. (2010), “Revisiting Metaphor Types as Discourse Strategies: The Case of Psychotherapeutic Discourse,” Text & Talk, 30, 445–463.
- Tay, D. (2012), “Applying the Notion of Metaphor Types to Enhance Counseling Protocols,” Journal of Counseling & Development, 90, 142–149.
- Tay, D. (2014), “Lakoff and the Theory of Conceptual Metaphor,” in Bloomsbury Companion to Cognitive Linguistics, eds. J. R. Taylor and J. Littlemore. London: Bloomsbury, pp. 49–60.
- Tay, D. (2017), “The Nuances of Metaphor Theory for Constructivist Psychotherapy,” Journal of Constructivist Psychology, 30, 165–181.
- Tay, D. (2020a), “Affective Engagement in Metaphorical versus Literal Communication Styles in Counseling,” Discourse Processes, 57, 360– 375.
- Tay, D. (2020b), “Surveying Views of Metaphor vs. Literal Language in Psychotherapy: A Factor Analysis,” Metaphor and the Social World, 10, 273–291.
- Wee, L. (2005a), “Class-Inclusion and Correspondence Models as Discourse Types: A Framework for Approaching Metaphorical Discourse,” Language in Society, 34, 219–238. DOI: https://doi.org/10.1017/S0047404505050098.
- Wee, L. (2005b), “Constructing the Source: Metaphor as a Discourse Strategy,” Discourse Studies, 7, 363–384.
Appendices
A Manual Calculation Assessment
The following is a scatterplot of the interest levels (0–10), measured by a survey, and corresponding English test scores (0–10) of nine students. The red line indicates the mean test score = 6.06. As a teacher, you want to know if students’ interest might influence their performance in English. You fit a regression model (blue line) to see if test scores are predictable from interest levels. The computer programme shows that the best model is test score = 3.12 + 0.56 * (interest), where 3.12 is the y-intercept and 0.56 is the slope of the blue line.

Complete the table below and calculate the value of SST, SSR, SSE, and the model R2. One mark will be deducted for every mistake.
Table
B Essay Question and Rubrics
Identify a realistic question in your future work or research that could be addressed by regression analysis. Explain how regression analysis would apply, and how it adds value to conventional ways of answering the question.
C Survey Items
*Construct names were not shown to students
Practical utility
Regression analysis will help me learn other subjects.
Regression analysis helps me understand the world around me.
I often encounter situations that can be explained by regression outside school.
I often see familiar statistical concepts (e.g., regression) in my other non-statistics courses.
Many situations in the world around me can be modeled by regression analysis.
Personal growth
Doing regression helps me understand myself.
To understand regression, I can think about my personal experiences.
In regression analysis, I can be creative and discover things for yourself.
Regression analysis and logic will help me make intelligent decisions about my life.
Regression analysis raises interesting new questions about the world.
Optional: Please provide comments on how this course has shaped your responses, and/or any other relevant comments.