 ?Mathematical formulae have been encoded as MathML and are displayed in this HTML version using MathJax in order to improve their display. Uncheck the box to turn MathJax off. This feature requires Javascript. Click on a formula to zoom.
Abstract
The recent rise in online learning in statistics has made it essential for instructors to teach effectively in that modality. In this retrospective, we reflect on how online course content was added to an introductory statistics course in a graduate public health program and how it was updated over time based on student feedback and instructor experiences. The impetus for the inclusion of online learning as well as the consequences of specific implementations are discussed for hybrid and fully online class formats. We found that while online learning seemed to be beneficial as a whole for public health students learning health statistics, identifiable differences in the design or implementation of lectures, software demonstrations, online discussion, computer lab activities, active learning, and homework assignments had a substantial effect on learning outcomes and student satisfaction.
1 Introduction
As the fields of statistics and data science gain greater and greater importance, the question of how to best prepare non-statisticians to be savvy consumers and generators of statistics grows more pressing (Oster and Enders Citation2018). At the same time, we have witnessed a broader reorientation of the introductory statistics course from a traditional focus on probability theory and manual calculation of statistics toward a more practical approach to the analysis and interpretation of data (GAISE 2016). While courses adopting a practice-oriented approach may be appropriate for students in nonstatistical disciplines, a traditional lecture-based format can fail to bridge the gap between statistical theory and practice for them. These students may feel overwhelmed as an instructor lectures in the classroom, or they may have a learning style that is less compatible with a lecture-based teaching method (Dawson Citation2017; Lage, Platt, and Treglia Citation2000). Other teaching modalities may be needed to effectively promote learning among students.
One viable approach to this situation is to offer online learning as a replacement or supplement to face-to-face learning in the traditional, lecture-based classroom. Fully or partially online courses have been increasing in popularity over the past decade (Allen and Seaman Citation2014; Allen et al. Citation2016; James, Swan, and Daston Citation2016). Online courses are attractive to institutional leadership as they have lower costs and can increase enrollment by reaching a wider range of students (Twigg Citation2013; Kwak, Menezes, and Sherwood Citation2015; Haughton and Kelly Citation2015). These benefits are realized despite the large amount of resources required to create online courses (Herreid and Schiller Citation2013; Dawson Citation2017) and the subsequent effort needed to keep them updated (Sullivan Citation2019). Necessity has also played a role in the rise of online education: the COVID-19 pandemic made effective use of online tools essential for instructors.
Beyond considerations of public health in a pandemic, there are possible advantages to learning online for students in statistics courses. For example, the format may also allow quiet students a chance to participate more in an asynchronous online forum (i.e., discussion board) where they can take time to formulate a response (Young Citation2002). Studies have found online learning to improve student grades (Dutton and Dutton Citation2005; Means et al. Citation2009; Wilson Citation2013; Touchton Citation2015; Shinaberger Citation2017; Farmus, Cribbie, and Rotondi Citation2020), evaluations (Touchton Citation2015; Dawson Citation2017), performance on standardized tests (Winquist and Carlson Citation2014), and student engagement (Lage, Platt, and Treglia Citation2000; Young Citation2002). However, online learning can be very divisive. Some students enjoy it (Lage, Platt, and Treglia Citation2000; Schwartz, Ajazi, and Monaco Citation2018; Immekus Citation2019) whereas others greatly dislike it (Young Citation2002). When it comes to its effectiveness, some studies have found little difference between online and classroom-based learning (Utts et al. Citation2003; Ward Citation2004; Sami Citation2011; Bowen et al. Citation2012; Haughton and Kelly Citation2015; Hahs-Vaughn et al. Citation2017; Soesmanto and Bonner Citation2019) while other studies have shown lower performance by students in online courses (Carnevale Citation2002; Keefe Citation2003; Scherrer Citation2011). In addition, students may feel that online learning is more work (Utts et al. Citation2003).
One possible reason for this apparent discrepancy in effects is that the above studies were done with widely varying student populations, from different majors at the undergraduate level or different fields and levels of graduate education. Thus, demographic effects may play a large role in the effectiveness of online tools (Billings, Skiba, and Connors Citation2005; Artino and Stephens Citation2009). Moreover, the terms “online learning,” “hybrid learning,” and “flipped classrooms” are broad and can refer to many different types of course content and structure, from recorded lectures and online discussion boards to virtual classrooms. Each of these instructional approaches have their own challenges to successful implementation, and there are likely different styles of implementation at the instructor and design level that can influence how online content is received by students. Consequently, it can be useful to examine how specific pieces of online course content can be implemented and what pitfalls may exist in that process.
The process of switching from a traditional face-to-face lecture format creates challenges and opportunities for student engagement and learning, especially in asynchronous online courses, as the characteristics of interaction can be very different (Immekus Citation2019). Discussion boards can be helpful in that space as can a more interactive viewing platform: online learning should not be seen as directly harmful to engagement but instead requiring a different approach (Rayens and Ellis Citation2018). Active learning (e.g., computer lab time for practicing statistical analyses) is a valuable learning tool for flipped classrooms (Karpiak Citation2011), especially when in small groups (Garfield Citation1993; King Citation1993; Parker Citation2009), but may be challenging to deploy in an online setting. Lastly, it is also important that online students are still receiving sufficient feedback. Although feedback on summative assessment (i.e., exams) may function similarly in an online and in-person space, it may be even more important to continue to provide formative feedback as the student is progressing through the material away from the instructor (Boston Citation2002; Miller Citation2014).
In this article, we will look back at the transition of an introductory health statistics course in a Master’s of Public Health (MPH) program from a traditional lecture-based format to flipped and fully online formats. The online course content used in this course will be discussed in terms of why it was added, which approaches led to positive outcomes, and which ones did not. Prerecorded lectures, asynchronous discussion, hands-on active learning, and formative feedback are the principal areas of attention.
2 Course Description, Data, and Methods
2.1 Course Overview
This study looks at the history of the introductory statistics course titled “PBH 504: Fundamentals of Health Statistics for Research” from Fall 2016 through Summer 2020. It is a required course for the Master of Public Health program within the College of Population Health at Thomas Jefferson University in Philadelphia, PA. The semesters under consideration are given in with the course format, class, size, and number of sections.
Table 1 Course offerings and the timeline of major course changes (highlighted in bold).
This course is the only required statistics course within the program (though advanced electives are available), so it is responsible for providing many of the quantitative competencies required for accreditation by the Council on Education for Public Health. The overall goal of the course is to provide students with the statistical literacy necessary to be effective consumers and producers of public health research as well as the tools to perform standard analyses in this area. The course has no prerequisite. No prior statistics experience is assumed, and calculus and matrix algebra are not required for program admission. The level of theory taught is correspondingly limited.
The modules composing the course are:
basics of data and variable types,
probability theory
hypothesis testing
tests of means (t-tests and ANOVA)
chi-square tests and odds ratios
simple linear regression and correlation
multiple linear regression
moderating relationships
logistic regression
nonparametric statistics
survival analysis
The statistical methods are taught in SPSS due to its relatively user-friendly graphical user interface, its popularity in public health departments, and institutional support.
2.2 Course Delivery
The in-person and hybrid formats met once per week, while the online format was arranged in week-long modules. From Fall 2016–Spring 2018 the semesters were 14 weeks long with 2.75-hour-long meetings, whereas the semesters were 12 weeks long from Fall 2018 on with 3-hour-long meeting for the hybrid sections supplemented by online learning to maintain the requisite number of contact hours. Blackboard Learn was used as the course learning management system (LMS) from Fall 2016 through Fall 2019 while Canvas was used for Summer 2020. There were no differences in course delivery between the two platforms beyond the folder structure.
The course was organized into weekly modules with a standard structure. Each module began with a lecture covering the statistical concepts followed by instruction on how to perform the associated statistical analysis in SPSS. Then, an active learning activity was provided (typically practice problems). Finally, students submitted a weekly homework assignment. A typical week in the LMS is represented in . The semester culminated in a final exam.
Fig. 1 An example from Summer 2020 of a typical week of course content on Canvas in the fully online format.
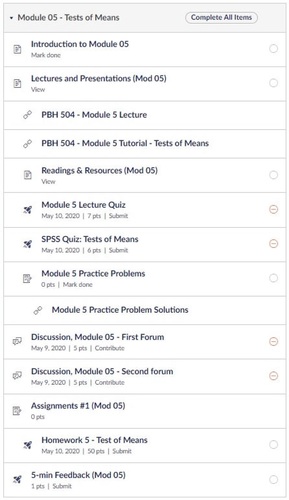
While the structure of course modules remained consistent over the study period, the characteristics of each of those pieces of course content (what they were, how they were implemented and supported) changed greatly over the study period due to student feedback and instructor observations with the intent of providing a higher quality learning experience. The timeline for the changes made to the different parts of the course over the study period is given in ; the rationale behind these changes will be explored throughout the later sections of this paper.
2.3 Data and Analysis
Data for assessing students’ experiences with the course came from multiple sources: course evaluations administered by the institution, internal surveys administered by the instructor, weekly evaluations in the online format, and instructor experiences. All of the evaluations and surveys were submitted anonymously so there was no way to link the sources to each other, though associations could be examined between question responses within a questionnaire. The use of student data was approved by the institutional IRB (#18E.311).
Course evaluations were administered by the institution at the end of each semester, and contained Likert scale questions (e.g., “Rank your satisfaction level with the overall quality of this class.”), multiple choice questions regarding student course load (e.g., number of full-credit courses they took that term and the number of hours spent per week) and free response (e.g., “How could this course be made more effective for students such as yourself?” and “Share any additional feedback you have about the instruction provided.”). These course evaluations were sent to 234 eligible students with 181 submitted for an overall response rate of 77%. On a section-by-section basis, shown in , the median response rate was 76% with a maximum of 100% and a minimum of 58%.
In the in-person and hybrid sections, students were also given a survey by the instructor in the final meeting of the semester that contained free response questions directed at the specific course content and delivery. The questions used in these surveys and the semesters they were asked in are listed in . Altogether, surveys were distributed to 192 students with 146 returned for an overall response rate of 76%. On a section-by-section basis, described in , the median response rate was 82% with a maximum of 100% and a minimum of 35% (6/17 for one of the two Fall 2019 hybrid sections).
Table 2 Questions from the in-class surveys at the end of the semester for in-person and hybrid sections.
The three asynchronous online sections did not have a course survey administered by the instructor, but rather had weekly “5-minute Feedback” with three free response fields regarding the most useful type of course content for that week, the least useful type of course content for that week, and the number of hours spent completing that week’s material.
The free response fields from these data sources were analyzed qualitatively, with coding based on common terms and themes and exact quotes provided when appropriate. Responses from the course evaluations were recorded as ordinal categorical variables (e.g., on a Likert scale) and were tested using nonparametric methods: the Kruskal–Wallis test for testing between groups, and a Spearman correlation when comparing two evaluation questions against one another (Agresti Citation2007). If evidence for a between-format difference was found, post hoc tests using Tukey’s method would have been run.
3 Implementing Didactic Learning Online
3.1 Statistical Software Tutorials
One of the core learning objectives of the course is teaching students how to perform and interpret statistical analyses using statistical software. In Fall 2016, SPSS was taught by live demonstrations during the in-class lecture where the instructor’s screen was visible on a projector in a computer laboratory. Students were provided the data used in the example and encouraged to follow along as the instructor walked through the steps of running the analysis and interpreting the output.
During these demonstrations, the students appeared to be engaged with a positive attitude. However, each step of the demonstration was met with requests to repeat the process; although student questions are encouraged, the frequency and consistency of them suggested that this was not an effective way for students to learn how to use SPSS. The mouse movements to use the graphical user interface were difficult for students to follow along with in real time. This limitation was reinforced on the in-class survey at the end of the semester, where 93% (37/40) of students reported needing to use online tutorials to be able to run analyses, with 83% (33/40) specifically mentioning video tutorials from YouTube. Thus, the in-class demonstrations of SPSS were clearly not providing students with the skills they needed to perform analyses themselves.
Starting in Spring 2017, students were provided with instructor-narrated videos of the SPSS tutorials with screen-capture of the instructor performing an example analysis. These videos were recorded and hosted in the Panopto platform, a widely used lecture capture and online streaming system which allows for bookmarking of recorded sessions by the instructor and students, pausing and fast-forwarding playback of lectures, logs of student viewing, and embedding of quiz questions into the recorded material. Since the deployment of recorded SPSS tutorials in place of those in-class demonstrations, 89 out of 93 students (95.7%) reported on the class surveys that they found the tutorials useful and 72 of those (77.4% of total) added a “very” or other kind of emphasis to “useful” in their written comments. Some examples of their strong reception are:
“Very useful. I would have sunk without them. I watched all of them multiple times”
“I found the SPSS videos to be very useful. I liked be able to pause and work through SPSS with the video.”
The ability for students to pause and rewind to observe small details in the software was a common but substantial benefit cited in their more detailed responses. The few negative reactions to the tutorial videos cited their length (“Very long and tedious. It was easier to use google to explain how to do each step.”) which was also noted in comments that found them useful despite how long they were (“Helpful, but sometimes a little bit long. Somethings could have been explained faster, but understand that not everyone in class is at the same level.”). The different ways students perceive work across classroom formats has been noted elsewhere (Utts et al. Citation2003), and will be discussed later on in the context of this course.
3.2 Promoting Student Use of Recorded Materials
Despite the tutorials being a valuable resource for students when completing the homework assignments, there were initially problems where students did not view the tutorials before class to prepare themselves for doing the practice problems during in-class lab time (which will be detailed later in this paper). Although it was to be expected that students might rewatch selected parts of the video to review how to perform a specific step, there were a small number of students who were noticeably disengaged with the practice session and appeared to be watching the tutorial video in its entirety for the first time. This negatively impacted the student as well as their classmates as unprepared students could not contribute meaningfully to group work and took take substantially longer to complete the problems (an issue that will also be discussed later).
When the students in the Spring 2017 section were asked about this issue on the anonymous survey, they were extremely forthright. None of the five students reported preparing for every session, with responses of “Only once,” “Twice,” and “Not very often” over the 14-week term. Those who prepared most weeks noted having a worse experience in the weeks they did not prepare: “I was sorry (and lost) the times I didn’t,” and that the times the practice problem sessions were not helpful were the same weeks the student did not watch the tutorial beforehand.
In order to remedy this issue, students from Fall 2017 on were required to complete a readiness quiz over the SPSS tutorial before starting the in-class practice problem session. These were short (approximately five questions) multiple-choice quizzes over key features of the week’s SPSS functions, such as where in the menu to find a particular test and what options need to be selected to get the desired output. These quizzes were deployed in the online LMS and automatically graded.
The addition of quizzes largely fixed the problem of preparation and was well-received, with students appreciating an opportunity to easily gain points and one student commenting on how the quizzes kept them on track with the material. Some issues remained, however, requiring tweaks to how the quizzes were deployed. The quizzes were initially set where students had unlimited attempts and only the final score was kept, which allowed for students to brute force the multiple-choice quiz without watching the video. For instance, one Fall 2017 student had eight attempts on one quiz before getting a 100%, and was confirmed via the Panopto viewing logs to have not watched the tutorial video before class. Restricting students to a single attempt created other issues, where on a weekly basis at least one student e-mailed the instructor asking for their quiz to be reset as they had accidentally started it. Regardless of the legitimacy of those claims, the requests created an undesirable burden on the instructor; a change to a two-attempt limit has appeared to successfully eliminate both of the above issues.
3.3 Recorded Lectures, Active Viewing, and the Flipped Classroom
Prior to Fall 2017, work had begun on developing a fully-online version of the course with prerecorded lectures. Although that format was not yet implemented, students in Fall 2017 were given the recorded lectures to view after class for their reference. These were full-length lectures, typically one hour in length. Unfortunately, this led to a rise in absenteeism where some students did not attend class since at that point all of the didactic material for the course was available online at some point in the week. Students skipping class was an immediate concern due to both the small class sizes and how students were expected to spend part of class doing practice problems in a small group, so their absence negatively impacted their group members. To address this, in Spring 2018 the SPSS readiness quizzes were changed to be completed in-class at the beginning of the meeting and made accessible by a password provided in the room.
By Spring 2018, it had become clear that the course format of a single meeting per week was extremely limited and incongruous with the desired module structure of lecture-SPSS tutorial-practice-homework. To accommodate the lecture preceding the SPSS tutorial and the SPSS tutorial preceding the practice session, the course was operating under a staggered format where students were expected to practice one module and listen to a lecture for the next module in a single three hour meeting. This proved confusing for students and frustrating for the instructor to balance how much time each part got during a class meeting. Buoyed by positive feelings of students toward the hybrid format on the Spring 2018 course survey responses, the decision was made to switch the in-person course to a flipped classroom format in Fall 2018.
In this flipped classroom, students were required to watch both the lecture video and the SPSS tutorial video prior to the weekly meeting. Based on prior experience with the SPSS tutorial videos, students were required to complete a readiness quiz over the lecture video prior to class using the same two-attempt LMS-based system as the SPSS quizzes in order to promote their preparation prior to coming to class. During class, students had the opportunity to ask questions about what they had watched, discuss topics of interest, and go through practice problems in small groups. After class, students had to complete the module’s homework assignment and watch the next module’s videos prior to the next week’s meeting.
In order to make the limited attempt readiness quizzes fairer, both the lecture and SPSS tutorial videos had multiple-choice questions embedded in them in Fall 2018. These questions were used to highlight key concepts in lecture and key functions and common technical errors students may make when running analyses in SPSS. Embedded questions paused the video and required the student to select an answer before continuing the video. The questions in the videos did not contribute to a student’s grade but rather serve as self-checks on learning. These embedded questions were the same as the ones comprising the graded readiness quizzes, which students were made aware of, making it so the quizzes rewarded diligent preparation.
Unlike the SPSS tutorial videos, student reception to the lecture videos was mixed. On the positive side, 96% (21/22) of the Fall 2018 students found them helpful, often citing the ability to pause and rewatch sections as needed. On the negative side, half of the students (11/22) expressed concerns about the length of the lecture videos, saying they took too much time and it was difficult to maintain attention for a full hour-long video. For example:
“The lecture videos were very helpful, but they were long. I would almost always put them at 2x speed, and I liked that I could print out the slides and take notes while listening to the lecture.”
Some students also reported needing to watch the lectures several times to grasp the concepts, increasing the weekly workload beyond what was intended. As the videos were of equal length to the in-person lectures, this suggests that there is a more subtle difference in perception for recorded videos. The median number of hours per week from course evaluations was 5–7 for both the flipped (25th–75th percentiles: “5–7” to “11–13”) and in-person (25th–75th percentiles: “5–7” to “8–10”) formats with no clear evidence of a difference in their respective distributions (p = 0.314). One limitation to note for this analysis is that the question was phrased as “On average, the amount of time I put into this course each week was:” so students may count their hours differently depending on the course format (i.e., in-class time not being added in) which may have resulted in an underreporting of hours for some students.
The actual flipping of the classroom was also highly divisive among students. A slight majority of student responses were uniformly positive (12/22, 64%) toward the format, and those who were positive tended to be extremely so. Two such responses are given below:
“Flipped classroom format was excellent. This was the first class I have had that did flipped classroom, it worked way better in facilitating my learning. Watching the lectures at home at my own pace is a much more efficient use of time and allows me to interact with the lectures in more effective ways.”
“I think for this level of statistics it is the only way that this class would work. I like being able to take my time with the material at home and then just practicing the material in class. I always felt like I knew what was going on and then could iron out the kinks with the practice problems.”
The students who disliked the flipped course format felt it was functional but tended to cite a general dislike of online learning in terms of monetary value or the above concern with the length of the recorded videos and time spent on the course out of class.
“I did not like the flipped classroom as first, but it turned out to be alright. I did not appreciate the amount of work that was required at home. As a person who commutes to a full-time job and then takes classes on top of it, it was very difficult getting everything done in one week. It took away time to learn the concepts of the material. …I often thought that I would have preferred to spend time driving to class to be taught the material in the specified time vs. paying to have to learn it on my own at home and then getting to practice it in class.”
On that point, we note that from the course evaluations across all semesters there was no evidence of an association between the reported number of hours per week spent on the class and a student’s perception of overall course quality (Spearman rho ) or instructor quality (Spearman rho
).
4 Implementing Active Learning
4.1 Active Learning in a Hybrid Format
Active learning is a key part of learning statistics and was a part of the course from the beginning of the study period. This typically took the form of practice problem sets where students were given real world data and had to answer a research question with it, going up through the final written interpretation of the results. The initial format of in Fall 2016 had students work individually on the practice problems on their own outside of class; this was not an effective approach as only 25% (10/40) of students reported the practice problems as helpful on the course survey and several explicitly asked for group work in the course evaluations.
To address this issue, starting in Spring 2017 students were asked to work in groups on the practice problems in class with the instructor available to answer questions. At that point, groups were entirely student chosen with no limit on size so they were based on the layout of the computer lab and preexisting social groups. Although this structure led to the practice problems being useful to most students in Spring and Fall 2017 (93%, 57/61), many students expressed concerns about the practice problem sessions going too long. The sessions generally ended when all of the groups finished the problem set (or the meeting time ran out) so the instructor could go over the solutions with the class together. The problem sets were designed to be completed in approximately one hour, though student comfort with the concepts and software greatly influenced the actual time taken. As students uncomfortable with the material could take an hour and a half to two hours to complete the problem set even with instructor guidance, it was not unusual for high-performing students to wait nearly an hour after finishing before reviewing the solutions. That imbalance also caused a tension between time spent on active learning and time spend reviewing the solutions together. For instance, one student noted that the practice sessions were “Very useful, but [took] too much time. [The solutions] [r]eview was too quick.” The cause of this imbalance was clear from the instructor’s perspective: associative grouping where the high-performing students would work together and the students who struggled with the material tended to end up in the same group. A lack of restraint on group size also meant that large groups tended to drift apart and not communicate effectively, which was undesirable as students on the ends of rows were sometimes left out of their group’s discussion.
In Spring 2018, the group structure for practice problems was revised where students were randomly assigned to pairs (plus a trio if the class size is odd) each week to avoid the issues induced by student choice for both group size and skill level. A small group ensured that students had to communicate with their group. Random assignment had the effect of making groups that have, on average, the same level of quantitative skill (though this did not entirely eliminate students having to wait). Randomization on a weekly basis also meant that students would not spend multiple weeks with groupmates who they did not work well with, and the randomization was restricted to attempt to pair students with a new partner each week. Students were also given the opportunity to tell the instructor discretely, with no questions asked, if there was an individual with whom they would not want to work with to avoid unnecessary friction between students.
This change maintained the high proportion of students viewing the practice problem sessions as useful overall (93%, 41/44) although there was some underlying dislike of the approach. When there was a large gap in work speed among group members, from a fast worker being randomly paired with a slower one, both ends could end up dissatisfied. A few of the students reported being dissatisfied at having to teach students who they felt did not understand the material as well (“It is difficult to work with people who are unaware of what is going on in the course,” said one student evaluation), and a few of the students self-identifying as slower workers expressed feeling of intimidation and discouragement in where they were at in the learning process compared to their peers. Some students also expressed dissatisfaction with being randomly assigned partners, especially those who had not prepared sufficiently:
“The in-class practice was perhaps the most helpful materials in this class. I liked everything about them. I Just wished we weren’t always forced to work in groups or that we could choose our partners sometimes. I had some great partners where I felt like we both learn from each other, but most of the time my partners were not interested in doing the work or were totally unprepared to tackle the problems. So, that was frustrating at times.”
“The in-class practice problems were helpful because [the instructor was] available to answer questions as we were working, and because our homework was usually very similar to the in-class problems. Sometimes a partner hadn’t watched the videos beforehand, and I could tell, but that can’t really be helped.”
These comments highlight that while readiness quizzes may have helped in some cases, their implementation allowed for students to skim the videos without absorbing their content. A more rigorous readiness quiz may improve that issue, but that would raise a question of how much mastery needs to be assessed before getting to engage in active learning, which does not have a clear answer.
4.2 Active Learning in an Online Format
For the fully online format launched in Spring 2019, another approach was needed for active learning as online courses in our program are designated to be fully asynchronous with no expectation of schedule coordination at the whole-class level. Heterogeneity of student schedules and locations also discouraged the use of assigned small group meetings. In this format, online students are given the same practice problem sets along with a recorded video of the solutions, but are not given any group requirements for approaching the problems. Initially students were asked to post their solutions to the practice problems in a course forum, but the volume of material being posted and lack of a way (and reason) to engage with it caused this to be removed from the course after a few weeks. Interestingly, unlike the self-guided practice in Fall 2016 (which did lack a prerecorded explanation of the solutions compared to the online format) the practice problems were consistently listed as one the most useful parts of the course in the weekly evaluations, particularly in weeks later in the semester when the analyses became more complicated (e.g., multivariable linear and logistic regression).
5 Online Feedback and Discussion
5.1 Formative Feedback in Assignments
After the different types of learning were done for a module, students were asked to complete a homework assignment that contained a mixture of conceptual and data analysis questions due before the next module (approximately one week). The data analysis questions were multi-part problems walking a student through the entirety of an analysis, beginning with generating a statistical hypothesis from the scientific one in the scenario and going on through the final interpretation of the analysis in a format suitable for the Results section of a manuscript. For example, a multiple linear regression question would have students provide the correct form of the linear model, the null and alternative hypotheses for the predictor of interest, the predicted values of the beta coefficients, the relevant test statistic and p-value, a discussion of model assumptions, and finally a written conclusion for the analysis.
The assignments were originally submitted as Word documents, but starting in Fall 2017 the assignments were integrated with the course LMS. Although the written interpretation of the analysis remained as an essay format, as did relevant conceptual questions (e.g., “What is the practical effect of this age-by-sex interaction term in this model?”), many of the other questions were converted to a multiple-choice format or an entered number.
Converting questions regarding the more mathematical aspects of an analysis (e.g., what the appropriate statistical null hypothesis was or what the linear model would look like) to multiple-choice was greatly beneficial for this student population. This format allowed these public health students to focus on the key parts of an analysis rather than getting stymied by having to write out statistical notation (e.g., H, which they are generally unfamiliar with and (recalling the GAISE 2016 guidelines) is not a skill that is valuable for them to develop. However, the largest benefit came from converting the question parts asking for model output (e.g., test statistics, degrees of freedom, and p-values) in the middle of the analysis to multiple-choice. The key part of this approach is that the choices were set up very deliberately to contain just the values from the correct model. The wrong choices had numbers switched around and mismatched or gave the test results for a different hypothesis in the standard software output (e.g., Levene’s test for a two-sample t-test or the test of a covariate in a multiple regression model). This provided immediate formative feedback to the student so that the student would know right away if they had run the analysis correctly by seeing familiar numbers and were able to move onto extracting the appropriate values and writing up in interpretation (Boston Citation2002). If an error was made and the student saw no familiar values, it gave the student a chance to go back and rerun the model to get experience doing it correctly without losing points and having to wait several days past the due date to get their grade and the solutions.
There are benefits to the instructor for integrating assignments to the LMS. Multiple-choice, entered numbers, and other closed-ended types of questions can be automatically graded by the LMS, and the LMS automatically provides students with built-in feedback (composed by the instructor) explaining the answers to questions posed. This saves the instructor time that can be spent providing more in-depth feedback on the free response questions. For multiple-choice questions, partial credit can be set for options that are only partially correct, which allows for more nuanced scoring of questions in a way that will be consistent between students. The formative feedback on running the correct model can simplify grading as well by minimizing or eliminating cases where the student appropriately interpreted the output for a wrong model.
This assignment format was greatly appreciated by students and had a large effect on their approach to homework. 95% (53/56) of students in Fall 2017 reported having caught at least one modeling error with it over the course of the semester. The effect of built-in formative feedback was not just on grading, but also on how students felt about the course material as a whole. It greatly boosted the confidence of students in their ability to run the analyses and use the statistical software, as these students noted when asked if they found errors due to the question format:
“I greatly appreciated the multiple-choice questions being set up this way rather than designed to trick us into thinking that my model was correct.”
“I liked the multiple choice over the short answers…because I felt it solidified my confidence in my answers. Definitely keep it!”
“Made me look at df [degrees of freedom], reinforced right answers.”
“Half and half. Solidified my confidence in right answers.”
“More than once, appreciated knowing when it is really right.”
“VERY OFTEN. Helped me find mistakes and learn.”
For students struggling with the material, this type of feedback can be extremely empowering and validating in a field that can be very intimidating and at times seem incomprehensible to novices. Even if a student did not find errors, the feedback system was beneficial to student attitudes toward working with the data (“No, but it was reassuring.”).
5.2 Experiences with Online Discussion Boards
Per an institutional requirement for asynchronous online courses, the fully online versions of the course required students to post weekly on a class discussion board. Students were required to make at least two posts per discussion prompt, an original post addressing that week’s prompt and a response to another student’s post, to be completed by certain points during the week. For the week starting on a Monday, the original post was due by the end of Thursday while the response post due by the end of Saturday to provide students with time to respond to one another before the next week started. There were one or two prompts per week, depending on the week’s content, and were generally of the form where students were asked to find and present examples of that week’s topic (e.g., logistic regression) in public health or health science literature. The notable exception was the week on statistical inference, where the students were asked to discuss their thoughts on the use of statistical significance after reading the American Statistical Association’s statements on p-values (Wasserstein and Lazar Citation2016; Wasserstein, Schirm, and Lazar Citation2019).
The student response to this implementation of discussion boards has been mixed. The prompts were designed with the primary learning objective of developing a student’s ability to critically read a journal article, particularly the statistically intensive core, as well as interpret the findings for a broader audience. In that regard, the discussion boards have been very effective as at the end of the semester several students have commented on their overall appreciation for the discussion boards helping them grow in this area. One such student commented:
“One of my ultimate goals for this course (and honestly, the MPH program overall) was to develop a strong ability to thoroughly understand and critique the Methods sections of scientific literature. In the past, I’ve certainly been guilty of neglecting the statistical analyses portions of studies since I didn’t understand the concepts being described. However, I’ve seen myself improve significantly in both my understanding of these previously foreign concepts and also my ability to succinctly summarize and describe different techniques on discussion boards each week. Things that took me a while to understand or interpret into different wording flow much more naturally, and it’s incredible looking back at my first discussion post of the semester.”
Another noted that “I feel better equipped to make my own conclusions from articles using the methods and analyses sections and not just the author’s interpretations of their results in the discussion section.”
Although students seemed to be satisfied with the results of the discussion board prompts on their learning, they were clearly dissatisfied with the process to get there. When asked “Which of this module’s learning activities did you find least useful?” on the weekly evaluations, a plurality (and often the majority) of students listed the discussion board in each week except one: the module on statistical significance, which happened to be the most conventional discussion of content (as opposed to the journal club-style prompts of other weeks). In free response fields, many students stated that it was highly burdensome to find and write up a journal article using a particular statistical method on a weekly basis. It seemed to be the searching that was the largest problem for students, as their suggestions centered on the creation of an instructor-curated set of articles to choose from rather than the overall elimination of the exercise.
6 Discussion
In this study, we described the implementation of several types of online learning activities and considered the reasons for and the effects (both positive and negative) of their addition to an introductory public health statistics course.
The use of prerecorded online videos to teach students has been extremely successful, particularly with tutorials for using statistical software. The process of learning statistics appears to be one that greatly benefits from online tools that allow students to progress at their own pace and rewind to review points that escaped them on first viewing. This is particularly the case for statistical software with a graphical user interface (e.g., SPSS, SAS Enterprise Guide, R Commander) where it is difficult for students to keep up with a live instructor. Of course, videos are only useful if students watch them, and fortunately adding readiness quizzes where the questions are embedded in the videos was largely an effective way to ensure students kept up with the material and add a layer of engagement to otherwise passive viewing by activating the testing effect for learning (Miller Citation2014). One caveat is that students seem to dislike watching full-length lectures online (Utts et al. Citation2003); deploying lectures to be in multiple short parts may be a more palatable alternative for students even if the total run time is equivalent, though this idea would need future research. Another point is that they are not perfect for forcing preparation; further work is warranted to determine the best way to maximize preparation while balancing the burden on students.
In all formats, active learning was a cornerstone of the course content. If a goal of a course is to teach students how to analyze and interpret data, then students need hands-on experience analyzing and interpreting data—ideally in an environment where they can be guided by the instructor and assisted by peers. Even in the absence of direct assistance, the active learning portion of the course was viewed as being highly valuable by the online students. Although a group-based approach seemed to be more useful than an individual one in the physical classroom, it is an open question as how to best set up groups. Should they be self-selected or assigned? Comprised of the same members throughout the semester or rearranged frequently? There is likely not a single “right” answer, and it is unlikely that a single approach will satisfy all students. We recommend Garfield (Citation1993) as a useful resource for instructors looking at what group learning approach would be most effective for their student population. Active engagement in the learning process, either through practice problems or formative feedback within homework sets, is key to building lasting student confidence in their ability to perform analyses, as opposed to transient confidence from passive learning that does not hold up when confronted with a novel question (Boston Citation2002).
It appeared that formative feedback embedded within online learning tools was extremely effective at improving student confidence. Statistical analyses can be long and complex with many opportunities for errors along the way, as evidenced by the near unanimity of students who caught mistakes with this mechanism. The formative feedback described here allows students to get through the modeling steps to the interpretation and communication of the results. As this feature was relatively simple to implement within the learning management system and eliminated some of the purely mechanical work of checking correct values when grading, this was of great benefit to the instructor as well. Most crucially, it gives the instructor a ‘presence’ when a student is working through an assignment on their own and creates more opportunities for learning. Future work may look at quantifying the degree to which this feedback system bolsters student confidence in their analytic skills.
For asynchronous online courses, discussion boards may be one of the few ways that students can interact with their peers. Although our asking of students to find and present examples of certain statistical methods in the literature was effective at developing their skills as savvy consumers of public health research, it seemed to be at a great cost of student time, energy, and attention. Our strategy of letting students pick their own articles stemmed from a desire to let students read about topics that were interesting to them and hopefully the full range of articles students presented would provide insight into how broadly statistical methods could be used. The best example of the first goal was where a student interested in LGBT + issues was able to find an article about sexual minority health for every prompt and appreciated the opportunity to delve deeper into a field of interest. That said, there were many articles that were presented each semester due to their prominence at the top of web searches for a particular test, so it may be that not every student will want to take advantage of that ability to choose and may appreciate a more directed dive into health literature. A future goal for our course development is to implement a blend of those approaches, where students are given a large repository of preselected articles to choose from but also given the option to pick one of their own from a content area they are passionate about.
A limitation of this retrospective is that due to how quickly the course was adapted over time due to how students responded to changes, several of the survey questions were only asked in a single semester. This limited the sample size of student responses and may have introduced bias if a certain semester was not representative, though this is not something that can be assessed retrospectively.
One strength of this study was that it described how such online learning formats may be implemented among public health students and health care students more broadly. MPH students are interesting to study, as they typically come into a program with widely varying life experiences and educational background yet must be prepared to deal with high exposure to statistics in their professional life. Many of our students look at continuing onto training in patient care disciplines (if not already involved); as work designing or interpreting studies in these areas can have life-or-death consequences, it is our duty as instructors to ensure such students are well trained (Oster and Enders Citation2018). This student population has been understudied and more research should be done on how to best teach these students the statistical concepts they need to be effective in their work, though we hope that this retrospective will serve as a starting point for instructors in this field looking to add online content to their health statistics courses.
References
- Agresti, A. (2007), An Introduction to Categorical Data Analysis (2nd ed.), Hoboken, NJ: John Wiley.
- Allen, I. E., and Seaman, J. (2014), “Grade Change: Tracking Online Education in the United States.” Babson Survey Research Group and Quahog Research Group, LLC. Available at https://eric.ed.gov/?id=ED602449.
- Allen, I. E., Seaman, J., Poulin, R., and Straut, T. T. (2016), “Online Report Card: Tracking Online Education in the United States.” Babson Survey Research Group and Quahog Research Group, LLC. Available at https://eric.ed.gov/?id=ED572777.
- Artino, A. R., and Stephens, J. M. (2009), “Academic Motivation and Self-Regulation: A Comparative Analysis of Undergraduate and Graduate Students Learning Online,” The Internet and Higher Education, 12, 146–151. DOI: 10.1016/j.iheduc.2009.02.001.
- Billings, D. M., Skiba, D. J., and Connors, H. R. (2005), “Best Practices in Web-Based Courses: Generational Differences Across Undergraduate and Graduate Nursing Students,” Journal of Professional Nursing: Official Journal of the American Association of Colleges of Nursing, 21, 126–133. DOI: 10.1016/j.profnurs.2005.01.002.
- Boston, C. (2002), “The Concept of Formative Assessment,” Practical Assessment, Research, and Evaluation, 8, 1–4.
- Bowen, W. G., Chingos, M. M., Lack, K. A., and Nygren, T. I. (2012), “Interactive Learning Online at Public Universities: Evidence from Randomized Trials,” Ithaka S + R.
- Carnevale, D. (2002), “Online Students Don’t Fare as Well as Classroom Counterparts, Study Finds,” Chronicle of Higher Education, 48, 38–41. Available at https://www.chronicle.com/article/online-students-dont-fare-as-well-as-classroom-counterparts-study-finds-116050/.
- Dawson, J. A. (2017), “Using a ‘Flipped Classroom’ Approach to Teach Applied Statistics to Nutrition and Biotechnology Students Using Blackboard,” JSM Proceedings 2017, 1–4.
- Dutton, J., and Dutton, M. (2005), “Characteristics and Performance of Students in an Online Section of Business Statistics,” Journal of Statistics Education, 13, 1–26.
- Farmus, L., Cribbie, R. A., and Rotondi, M. A. (2020), “The Flipped Classroom in Introductory Statistics: Early Evidence From a Systematic Review and Meta-Analysis,” Journal of Statistics Education, 28, 316–325. DOI: 10.1080/10691898.2020.1834475.
- GAISE College Report ASA Revision Committee (2016), “Guidelines for Assessment and Instruction in Statistics Education College Report 2016,” American Statistical Association. Available at http://www.amstat.org/education/gaise.
- Garfield, J. (1993), “Teaching Statistics Using Small-Group Cooperative Learning,” Journal of Statistics Education, 1, 1–9.
- Hahs-Vaughn, D. L., Acquaye, H., Griffith, M. D., Jo, H., Matthews, K., and Acharya, P. (2017), “Statistical Literacy as a Function of Online Versus Hybrid Course Delivery Format for an Introductory Graduate Statistics Course,” Journal of Statistics Education, 25, 112–121. DOI: 10.1080/10691898.2017.1370363.
- Haughton, J., and Kelly, A. (2015), “Student Performance in an Introductory Business Statistics Course: Does Delivery Mode Matter?” Journal of Education for Business, 90, 31–43. DOI: 10.1080/08832323.2014.968518.
- Herreid, C. F., and Schiller, N. A. (2013), “Case Studies and the Flipped Classroom,” Journal of College Science Teaching, 42, 62–66.
- Immekus, J. C. (2019), “Flipping Statistics Courses in Graduate Education: Integration of Cognitive Psychology and Technology,” Journal of Statistics Education, 27, 79–89. DOI: 10.1080/10691898.2019.1629852.
- James, S., Swan, K., and Daston, C. (2016), “Retention, Progression and the Taking of Online Courses,” Online Learning, 20, 75–96.
- Karpiak, C. P. (2011), “Assessment of Problem-Based Learning in the Undergraduate Statistics Course,” Teaching of Psychology, 38, 251–254. DOI: 10.1177/0098628311421322.
- Keefe, T. J. (2003), “Using Technology to Enhance a Course: The Importance of Interaction,” Educause Quarterly, 26, 24–34.
- King, A. (1993), “From Sage on the Stage to Guide on the Side,” College Teaching, 41, 30–35. DOI: 10.1080/87567555.1993.9926781.
- Kwak, D. W., Menezes, F. M., and Sherwood, C. (2015), “Assessing the Impact of Blended Learning on Student Performance,” Economic Record, 91, 91–106. DOI: 10.1111/1475-4932.12155.
- Lage, M. J., Platt, G. J., and Treglia, M. (2000), “Inverting the Classroom: A Gateway to Creating an Inclusive Learning Environment,” The Journal of Economic Education, 31, 30–43. DOI: 10.1080/00220480009596759.
- Means, B., Toyama, Y., Murphy, R., Bakia, M., and Jones, K. (2009), “Evaluation of Evidence-Based Practices in Online Learning: A Meta-Analysis and Review of Online Learning Studies,” U.S. Department of Education, Office of Planning, Evaluation, and Policy Development, Washington D.C. Available at https://www2.ed.gov/rschstat/eval/tech/evidence-based-practices/finalreport.pdf.
- Miller, M. D. (2014), Minds Online: Teaching Effectively with Technology, Cambridge, MA: Harvard University Press.
- Oster, R. A., and Enders, F. T. (2018), “The Importance of Statistical Competencies for Medical Research Learners,” Journal of Statistics Education, 26, 137–142. DOI: 10.1080/10691898.2018.1484674.
- Parker, R. (2009), “A Learning Community Approach to Doctoral Education in the Social Sciences,” Teaching in Higher Education, 14, 43–54. DOI: 10.1080/13562510802602533.
- Rayens, W., and Ellis, A. (2018), “Creating a Student-Centered Learning Environment Online,” Journal of Statistics Education, 26, 92–102. DOI: 10.1080/10691898.2018.1475205.
- Sami, F. (2011), “Course Format Effects on Learning Outcomes in an Introductory Statistics Course,” MathAMATYC Educator, 2, 48–51.
- Scherrer, C. R. (2011), “Comparison of an Introductory Level Undergraduate Statistics Course Taught with Traditional, Hybrid, and Online Delivery Methods,” INFORMS Transactions on Education, 11, 106–110. DOI: 10.1287/ited.1110.0063.
- Schwartz, T. A., Ajazi, E., and Monaco, J. (2018), “Findings from a Survey of Statistics and Biostatistics Instructors in the Health Sciences Who Teach Using an Online or Flipped Format,” Journal of Statistics Education, 26, 143–148. DOI: 10.1080/10691898.2018.1484675.
- Shinaberger, L. (2017), “Components of a Flipped Classroom Influencing Student Success in an Undergraduate Business Statistics Course,” Journal of Statistics Education, 25, 122–130. DOI: 10.1080/10691898.2017.1381056.
- Soesmanto, T., and Bonner, S. (2019), “Dual Mode Delivery in an Introductory Statistics Course: Design and Evaluation,” Journal of Statistics Education, 27, 90–98. DOI: 10.1080/10691898.2019.1608874.
- Sullivan, A. (2019), “Creating and Updating Flipped Classrooms,” American Statistical Association’s Section of Teaching Statistics in the Health Sciences [online] [presented May 30, 2019]. Available at https://community.amstat.org/tshs/announcements/educationalactivities.
- Touchton, M. (2015), “Flipping the Classroom and Student Performance in Advanced Statistics: Evidence from a Quasi-Experiment,” Journal of Political Science Education, 11, 28–44. DOI: 10.1080/15512169.2014.985105.
- Twigg, C. A. (2013), “Improving Learning and Reducing Costs: Outcomes from Changing the Equation,” Change: The Magazine of Higher Learning, 45, 6–14. DOI: 10.1080/00091383.2013.806169.
- Utts, J., Sommer, B., Acredolo, C., Maher, M. W., and Matthews, H. R. (2003), “A Study Comparing Traditional and Hybrid Internet-Based Instruction in Introductory Statistics Classes,” Journal of Statistics Education, 11, 1–14.
- Ward, B. (2004), “The Best of Both Worlds: A Hybrid Statistics Course,” Journal of Statistics Education, 12, 1–12.
- Wasserstein, R. L., and Lazar, N. A. (2016), “The ASA Statement on p-Values: Context, Process, and Purpose,” The American Statistician, 70, 129–133. DOI: 10.1080/00031305.2016.1154108.
- Wasserstein, R. L., Schirm, A. L., and Lazar, N. A. (2019), “Moving to a World Beyond “p <0.05”,” The American Statistician, 73, 1–19.
- Wilson, S. G. (2013), “The Flipped Class,” Teaching of Psychology, 40, 193–199. DOI: 10.1177/0098628313487461.
- Winquist, J. R., and Carlson, K. A. (2014), “Flipped Statistics Class Results: Better Performance than Lecture Over One Year Later,” Journal of Statistics Education, 22, 1–10.
- Young, G. (2002), “‘Hybrid’ Teaching Seeks to End the Drive Between Traditional and Online Instruction,” The Chronicle of Higher Education. Available at https://www.chronicle.com/article/hybrid-teaching-seeks-to-end-the-divide-between-traditional-and-online-instruction/.