 ?Mathematical formulae have been encoded as MathML and are displayed in this HTML version using MathJax in order to improve their display. Uncheck the box to turn MathJax off. This feature requires Javascript. Click on a formula to zoom.
Abstract
Data literacy for students in nonquantitative fields is important as statistics become the grammar of research and how the world’s decisions are made. Statistics courses are typically offered by mathematics or statistics departments or by social and natural sciences such as economics, political science, psychology, and biology. Here we discuss how to construct a statistics course for students in nonquantitative fields, with a goal of integrating statistical material with students’ substantive interests, using student-focused teaching methods and technology to increase student involvement. We demonstrate this kind of hybrid course with the example of an introductory applied statistics class, taught at both the University of Toronto’s Anne Tanenbaum Center for Jewish Studies and the United States Naval Academy.
1 Introduction
One does not need to be a statistician to depend on numbers in everyday life (Oceans of Data Institute Citation2015). News outlets habitually use graphs and charts to illustrate information for their readers. Companies frequently use probabilities and survey data to evidence the efficacy of their product. And journalists, nonprofit leaders, and policy analysts use quantitative tools and statistical methods to measure trends, identify patterns, and interpret results. Indeed, data literacy is vital across industries, lifestyles, and the curriculum (Prado and Marzal Citation2013; Bhargava et al. Citation2015; GAISE 2016; Bargagliotti et al. Citation2020).Footnote1 But non-mathematically-minded undergraduates express hesitancy about enrolling in statistics courses (Bradstreet Citation1996; Rumsey Citation2002; Slootmaeckers, Kerremans, and Adriaensen Citation2014). Some students lack numerate confidence, others have inadequate quantitative training, and still others fail to see the relevance of statistics to them. So how can educators best help students to build a numerate life?
In this article, we present our “Build A Custom Statistics Course” template as suggested by Gelman (Citation2019) which can be modified to appeal not only to students in the social sciences and humanities, but also to students affiliated with theological institutions, centers for ethnic or diaspora studies, and journalism schools. This course not only meets all six of the American Statistical Association’s Guidelines for Assessment and Instruction in Statistics Education (GAISE) recommendations,Footnote2 but it also builds upon these guidelines by specifically targeting students from nonquantitative fields, perhaps attracting students from traditional quantitative disciplines to programs in the arts and humanities, philosophy, or business. What we propose is a holistic and multidisciplinary introductory course in statistical reasoning, statistical methods, and in the substantive case knowledge that facilitates applied understanding of how data on all aspects of the human experience can be analyzed quantitatively.
This course can be provided by any department or center, whether a nonquantitative department that wishes to provide statistical training to its students in a way that connects to their preexisting interests, or in a traditionally quantitative department to provide more opportunities for applying statistical knowledge to substantive areas through cross-listed courses or other similar partnerships. What makes this type of hybrid course unique are the substantive topics used to teach statistical methods; this is accomplished through the use of topic-based readings, instructor and guest lectures, and datasets relevant to the discipline or subject-matter. The course we present also highlights tools that should help maintain student focus in a hybrid course, such as pre/post-tests, just-in-time teaching tools, and collaborative research projects. Using our modified template, educators can accomplish two separate and complementary goals:
Teach introductory statistics to students in traditionally non-quantitative disciplines.
Teach substantive disciplinary content through the perspective of statistics.
2 Template
All new courses need consideration about what material will be covered, how student learning will be assessed, and which texts will be used. What makes this course unique is its multidisciplinary and multimethod approach, as it bridges together both methods and topics that have not historically been connected. Further, it is directed toward students in nonquantitative fields that may have limited statistical offerings, thereby heightening data acumen across disciplines. Data literacy matters not only in statistics departments, but also across the curriculum and this course facilitates that vital learning. In the following section, we outline the major components of this course. In order to facilitate integrated statistical and subject matter learning, we suggest that the objective of such a course is some combination of a critical ability to interpret data within the context of a substantive case, as well as secondary analysis skills (e.g., descriptive analytics, causality and basic regression, data illustration). Follow this template to construct a course.
2.1 What Materials Are Needed?
Students should have access to computers, loaded with basic computing and visualization software such as Tableau or R. Particular exercises may require further resources; for example, when we teach students how to compute and understand error terms, we use 10–15 photographs of individuals for the age-estimation demonstration of Gelman and Nolan (Citation2017). Instructors may also find it useful to have access to a document camera and computer projector in order to provide visuals to students. For collaborative assignments, we recommend a cloud-based platform that students can edit in real time (e.g., Google Drive, Dropbox, GitHub, Microsoft One Drive).
2.2 Evaluation: How Should Students Be Assessed?
If the goal is to promote student learning, instructors need tools for evaluation. We suggest that course instructors employ a variety of summative (how much someone has learned) and formative (how someone is learning) assessment tools. They are described as follows:
2.2.1 Pre-Test and Post-Test
Pretest/post-test followup is a useful pedagogical tool for student learning because it is both a summative and formative evaluation model. First, the pretest can provide early feedback to the instructor, as it shows where the students have substantial preexisting knowledge and where they are limited. A pretest can help an instructor craft their semester, determining whether more or less introductory material is necessary. Further, a post-test can operate both as a final exam, when it helps to leverage final judgment on student learning and retention, as well as a formative tool for showing and illustrating student growth, and therefore for reinforcing future student learning in the realm of statistics.
For students, the pretest/post-test model is useful because it can be low-stakes. For example, one can grade the pretest on a pass-fail basis, with the grade accounting for approximately 5% of their overall grade. This means that, on day one, each student has earned full marks on deliverables thus far in the course, which can alleviate some of their anxieties about taking a statistics class. While they may not correlate with a perfect final grade in the course, pretests help to build early confidence for students that may come in with a fear of all-things numerical, in turn leading this group to be more willing to take chances, make mistakes, and engage with course material (Reid and Barrington Citation1997; Meer and Chapman Citation2014).Footnote3
Toward the end of the course (e.g., on the second-or-third-to-last day of class), the post-test should be administered. We suggest that this be graded and account for a larger percentage of students’ overall grade. Every question on the post-test must be addressed over the course of the semester through course materials, lectures, and assignments. We recommend that the post-test include similar topical questions to those on the pretest with slight deviations in the numbers or content so that post-test scores are not confounded with the pretest. Whether you wish to inform students that the post-test will be similar to the pretest is likely dependent on your institutional requirements. This post-test can serve as the final exam in the course, but other educators may want to provide an additional exam depending on their pedagogical preferences and institutional expectations. In the class following the administering of the post-test, an instructor may redact student names and go over the results of the post-test collectively. In our experience, students appreciate this process because they are able to see where they did well and, if they got a question wrong, whether others answered it wrong, too.
We suggest that students be required to include their confidence level (on a range of 0–10, where 0 is low and 10 is high) for their answer to each question. This confidence level allows students to signal to their instructor when—and to what degree—they were guessing, in order to account for lucky guesses and to assess overconfidence. To mitigate the potential of any desirability bias, we recommend including a short passage at the beginning of the test materials, encouraging students to provide an honest assessment of this degree of confidence. This model of assessment also helps to measure student growth and skill acquisition without relying on post-course student evaluations, which often include questions about a student’s perception of their own growth and skill acquisition, rather than evidence of these objectives being met. Further, post-course student evaluations have been proven to be biased against female and minority educators and therefore may focus on arbitrary features of the instructor (such as their age, clothing, or appearance) rather than on the quality of the course or the effectiveness of its delivery (Mitchell and Martin Citation2018; Chávez and Mitchell Citation2019).
2.2.2 Just-in-Time-Teaching (Jitt) Tasks
In just-in-time-teaching (jitt), the course is supplemented by a short online assignment (informally, “jitts”) to be done before each class period (Novak et al. Citation1999; Mazur and Watkins Citation2010; Simkins and Maier Citation2010;). These short online tasks, graded according to a binary pass-fail system, are great pedagogical tools for getting students to think critically about course materials prior to class and to provide feedback to the instructor. For our jitts, we typically include three short questions in a simple online form: one to check on the readings, one that is a short problem, and one feedback on the class. As an example, a student may be asked to perform tasks introduced in class (e.g., “Calculate the appropriate sample size for the given variables. Show your work.”), to explain a concept (e.g., “In your own words, explain the debate surrounding Unz’s claims about Ivy League admissions.”), or to provide feedback (e.g., “What is one question you still have about the material in Unit 3?”).
The link to the jitt is sent out through the university’s learning management system, or by email, approximately 48 hr prior to class. Therefore, a class that meets, for example, on Tuesdays at 10 a.m. will receive the jitt on Sundays at 10 a.m. The jitt is intended to take about 15 min to complete, and students are graded not on their correctness but just for seriously attempting it.Footnote4 Therefore, the jitt operates as a low-stakes formative assessment, similar to a reading quiz given at the beginning of class. In our experience, the vast majority of students complete these assignments each week, as long as we remind them on the occasions that they don’t.
Low-stakes formative assessments are understood to improve student preparation, material recall, and grades on later assessments (McDaniel, Wildman, and Anderson Citation2012; Hodges et al. Citation2015; Pape-Lindstrom, Eddy, and Freeman Citation2018). A jitt can be completed at home and students can use it to identify a gap in their class preparation that they can address prior to class, with the effect of being more adequately prepared. For those students that complete their jitts immediately before class, we expect that this gets them in the mood for the class period. Gelman (Citation2013) provides guidance on how to set up jitts, some discussion about jitts, and examples of how we implement jitts in our class.
Both authors of this article integrate jitts in all of our classes by opening student answers on the computer projector so that we may go through the answers together as a class. The answers appear to the students as anonymous, which allows students to see what a correct answer looks like without being publicly shamed for an incorrect answer. This benefits students by boosting their confidence, not only because they are able to see how they did in relation to their peers, but also because they are able to fail at individual assignments without severe penalty. Jitt answers are discussed anonymously in class, but names are attached to answers for the instructor. This allows the instructor to grade jitts for effort on a pass-fail basis. It is also possible to fully redact names and identifying information (and instructor feedback) from the jitts, and to share the answers with students as a study tool.
Populating the syllabus with frequent, small assignments—such as these jitts—can help motivated students to earn higher grades, and these frequent, small assignments help students feel like their hard work is, to some degree, paying off.
2.2.3 Papers and Projects
A combination of solo, partnered, and collaborative projects is a good way to promote student learning. After all, if a student can solve a homework assignment correctly on their own, they demonstrate proficiency. However, a student that can explain their thought-process to a peer, navigate complicated ideas and processes in order to produce a deliverable, and influence the learning of classmates in a positive manner demonstrates mastery while improving their communication skills.Footnote5 This is the principle behind peer instruction and group work (Davidson Citation1990; Mazur Citation1997; Crouch and Mazur Citation2001). Collaborative assignments are particularly complicated because of their enmeshed free rider problem, where some group members tend to do more work than others, but the group earns a uniform grade, thereby allowing weak group members to free ride on the coattails of stronger students (LaBeouf, Griffin, and Roberts Citation2016).
In a statistics course, free riding in collaborative projects can operate differently. It is helpful to involve students in every step of the process. Therefore, instead of using a pre-made dataset, have students create a codebook together and decide on how different observable traits will be operationalized (Boger Citation2001). Students can collect this data easily using participant observation or survey questions (Taylor and Doehler Citation2014). In this case, by working collaboratively, students are able to work with a larger dataset without having to collect it all on their own, which provides for greater analytical leverage. For example, if each student in a class of 15 surveys five strangers on campus, a dataset will have a total of 75 observations.Footnote6 The instructor can use the jitt to request that students get approval to use their data in subsequent iterations of the course, which would further increase the number of observations in the dataset (e.g., 75 the first year, 150 the second year, and so on).
This kind of collaborative assignment can solve the free rider problem, because a free rider would produce missing data, which negatively impacts the results for every single person in the class, including the free rider. Using a cloud-based database, such as Google Sheets, further mitigates the free rider problem, as students are able to observe their own contributions as compared to the contributions of their fellow team members in the group project in real-time.
After building their collaborative dataset, students can practice uploading it into whichever computing program is being used, cleaning it, and using it to run models or to illustrate exploratory findings. This process can even be used to teach library science fundamentals regarding the organization and preservation of data for optimal readability across researchers. This collaborative assignment can be concluded with an individual short paper on findings, takeaways, and illustrations. We outline the details of such papers in the section of this article titled “The Collaborative Dataset Applied.”
2.3 Choice of Textbooks and Readings
We suggest organizing the syllabus by weekly statistical objectives. These should begin with basic theoretical concepts that answer the general questions, “what is data?” and “who is involved in constructing a dataset?” Answers to these questions should include not only texts that explain the concept from a statistical perspective, whether something written for the non-STEM reader such as Wheelan (Wheelan Citation2013) or something more traditional like Gelman, Hill, and Vehtari (Citation2020), as well as texts that consider data from a post-positivist perspective (e.g., including Fujii (Citation2010) on the topic of meta-data).Footnote7 Supplementary readings can cover specific topics on research design (e.g., case selection, avoiding bias) and statistical concepts (such as comparisons of means or how to perform regression or classification analyses).
Most importantly, a conversation about what makes data data must include, well, data. Therefore, we recommend that including a weekly or biweekly dataset in the syllabus that complements concept-based readings; in the case above, examining an archive works well because of its specificity. In more advanced discussions about, for example, multilevel models or sample sizes, it is possible to introduce the responses from most any survey-based dataset.
Each new dataset introduced on the syllabus, should come with some primary materials from its researchers (e.g., an Executive Summary or other reports, details regarding the scope and methodology of the study, or a list of questions asked in the case of a survey). We also recommend including on the syllabus some secondary materials (e.g., public lectures, opinion pieces in the press, blog posts from credible sources) about how the results of the study were received. Assuming that students learn in a number of different ways, we suggest that they are more likely to be engaged if the texts included in the syllabus are diversified. By joining traditional materials with niche datasets, students can actively apply the statistical material that they learn to real-world examples, which strengthens and deepens their understanding of both.
Finally, we recommend that students are incentivized to review relevant, assigned substantive materials, such as background texts on a particular topic, research articles based on datasets covered in class, or multimedia resources, such as short films or podcasts, that can help to deepen a student’s understanding of a topic. Instructors can incentivize students to come to class having prepared these materials by offering additional credit for introducing a text to the class and posing a few questions for further discussion—this form of incentive can work effectively both in-person and online, using a classroom management platform like Blackboard, Canvas, or Packback.
2.4 What Happens in Class?
The primary objective of this approach is for non-STEM students to learn introductory statistics. In order for these students to take the intellectual risks necessary to succeed in a statistics course, they need to increase their confidence and buy-in. One way to increase both of these is to provide lots of low-cost opportunities for participation through discussion, collaboration, and in-class activities. Drawing from the Cobb Report (1992) and the 2016 GAISE College Report, we recommend that statistical lessons are couched in experiential education whenever possible.
The book Teaching Statistics: A Bag of Tricks (Gelman and Nolan Citation2017) and the 2016 update of the GAISE College Report offer comprehensive lists of in-class demonstrations, activities, and projects for teaching introductory statistics. A themed course, such as the one discussed later in this article, takes this learning one step further as statistics exercises are reinforced by substantive reading and lectures, which allow students to integrate their statistical understanding within a greater curriculum. For instance, in an exercise that teaches about error terms, discussed at the beginning of this article, one might guess the birth years of individuals known within a discipline (e.g., Barbara Streisand for students in Jewish Studies or Steve Jobs for business school students).Footnote8
A secondary goal of a data literacy course for non-STEM students is building substantive expertise within a particular discipline, whether Italian Studies or History. As such, some of each class period will inevitably need to be lecture-based. This is necessary, for example, when an instructor provides background information about a particular dataset or its context. Some instructors will come to this course fluent in teaching both data analysis and a subject, while others will find themselves learning alongside students and partnering with other faculty and departments in order to broaden their interdisciplinary teaching.
From a practical perspective, each class meeting begins with a review of anonymous jitt answers. This process can take up to about 15 min, and both correct and incorrect jitt answers can be used as teaching opportunities. Students are then invited to go over the exercise problems that they received as homework. Students are incentivized to work together on problems and to submit work collaboratively, as it increases not only the likelihood that they will complete the homework, but also that they are successful in doing so (Little, Akin-Little, and Newman-Eig Citation2010). In both of our classrooms, we often invite guest lecturers. In a course on Communication in Statistics, we invited Amanda Cox, a statistician and expert data illustrator from the New York Times, to talk about illustrating uncertainty and writing about statistics for a non-STEM audience. Alexis brought in Dr. Betsy Anthony, a researcher and administrator at the US Holocaust Memorial Museum, to speak with her Applied Statistics and Data Science course (discussed in detail in the following section) at the University of Toronto about her data-related work with the International Tracing Service Archive (now, the Arolsen Archives) and the International Committee of the Red Cross. Visitors need not be face-to-face, especially given the prevalence of video-meeting technology. Former students and colleagues are also welcome to share relevant papers and works-in-progress with students. By introducing a diversity of voices into the classroom, students are encouraged to explore career paths related to statistics and data science, discuss niche questions with area experts, and apply their knowledge in a topical manner.
3 Application: A Course in Jewish Studies
In the spring of 2019, and in both the spring and fall semesters of 2020, Alexis used this model in an introductory applied statistics and data science course at the University of Toronto (Csillag Citation2019; Jankovic Citation2019; Pitic Citation2020; Lerner Citation2022). The course was titled, “Introduction to Applied Statistics and Data Science for Students of Jewish Studies,” and had no prerequisites. Alexis also taught this course in the Spring of 2023 at the United States Naval Academy, where the course was titled “Data Science for Jewish Studies.” An abbreviated syllabus is available in Appendix B of this article and a full syllabus is available to view on the American Political Science Association’s APSA Educate platform (Lerner Citation2020).
Alexis came up with the idea for this course when reading a New York Times article reporting that two-thirds of millennials did not know about the Auschwitz concentration camp in Poland. As a scholar of authoritarianism and the Holocaust, the news piece left her with many unanswered questions, such as how the questionnaire measured millennials and how it determines whether a respondent does or does not know about Auschwitz. This reporting motivated her to build a course to teach data literacy in this niche topic area so that students could properly assess and dissect charts, graphs, and claims both inside and outside of the classroom.
Each iteration of the 13-to-16-week seminar-style course hosted approximately 15 undergraduate students, who came from disciplines across the university, including Jewish Studies, Data Science, Cyber Science, English Literature, Russian Literature, Peace and Conflict Studies, Political Science, Economics, Geography, and Business. Students were mostly second, third, and fourth-year undergraduates and, at the University of Toronto were able to use the course to satisfy a university-wide mathematical breadth requirement. In its capacity to satisfy this breadth requirement, the course also posed a benefit to the department—in this case, the Anne Tanenbaum Center for Jewish Studies. Not only did the course allow the center to increase its offerings in the social and statistical sciences, but it also presented a way for existing Jewish Studies majors and minors to complete their mathematical breadth requirement in-unit.
As this was a course geared toward students interested in Jewish studies, the datasets used to teach general concepts were chosen with the goal of engaging students with Jewish studies as a discipline. This is one of the fundamental features that makes this course substantively unique, compared to other introductory statistics courses assigned in mathematics or statistics departments. For example, students used the Arolsen Archives to learn about “where data come from” and the Anti-Defamation League’s “Global 100: Index of Anti-Semitism” to discuss problems related to operationalization as well as the process of turning a nuanced concept (in this case, anti-Semitism) into a measurable factor. They also used datasets such as the 2018 “Survey of Jews in Canada” to practice simple and multiple linear regression (Brym, Neuman, and Lenton Citation2019) and the “2021 Survey of North American Teens on the Holocaust and Antisemitism” to discuss depictions of, and discussions about, the Holocaust using contemporary digital humanities tools (Lerner Citation2021). By the end of the course, students gained not only new information about demographics, politics, and culture within the scope of Jewish studies, but they also gained applicable tools for making and evaluating empirical claims within its purview.
The first iteration of this course’s offering included several students of geography, and so included a special week on how spatial mapping can be used in Holocaust and Genocide Studies (e.g., Jaskot Citation2000; Knowles, Cole, and Giordano Citation2014). The third iteration of the course was cross-listed with the Department of Sociology and included a special week on nationwide demographic surveys, such as the 2018 Survey of Jews in Canada and the PEW Research Center’s 2013 “Portrait of Jewish Americans” Survey.Footnote9 In the fourth iteration of this course, Alexis brought her class for a visit to the United States Holocaust Memorial Museum (USHMM) in Washington, D.C. There, midshipmen took a tour of the museum’s permanent exhibition and participated in a roundtable on the infrastructure of USHMM archival data and its contemporary applications by researchers, with a focus on new projects in data science and the digital humanities.
To supplement in-class learning, students read much of Charles Wheelan’s Naked Statistics: Stripping the Dread from the Data (Wheelan Citation2013).Footnote10 They also were shown a variety of academic writing on data science and statistics, such as Fujii (Citation2010) on atypical sources of data, Cleveland (Citation1994) on the best practices of graphing data, Gelman (Citation2016) on p-values, and Lerner (Citation2021, Citation2022) on data ethics. Students complemented scholarly works with news articles such as Zauzmer (Citation2018) reporting for the New York Times on millennial knowledge about the Auschwitz concentration camp and multimedia resources such as the NPR Code Switch podcast about the definition of Judaism (Demby Citation2018) and A Night at the Garden (Curry Citation2017), a 7-minute documentary about a 1939 pro-Nazi rally in New York City. To connect to historical scholarship, we shared first-hand accounts by researchers and archivists, such as Brym, Slavina, and Lenton (Citation2020) in conjunction with his guest lecture about conducting regression analysis on his own dataset and Shapiro (Citation2011) on the opening of the International Tracing Service archive of primary Holocaust materials. We also discussed controversial opinion pieces such as Unz (Citation2012)’s allegations in The American Conservative that Jews are overrepresented at Ivy League universities. In the 2023 iteration of this course, the class met twice a week, which allowed Alexis to focus conceptual and technical learning on Tuesdays and applications of learning to existing datasets and studies on Thursdays.
In addition to low-stakes assignments such as the jitts and pretests discussed in this article, students were evaluated through a five-part scaffolded assignment—here, referred to as the scaffolded “Collaborative Dataset” research project—that stretched across the semester. We strongly recommend using this template, not only due to the applied and communal nature of this approach, but also because it creates a sense of unified substantive expertise and exploration, as opposed to a course that only relies on tests on siloed datasets which change from week to week. Instead, a combination of datasets is preferable, with students beginning the course learning about and analyzing individual datasets and later transitioning to a larger project that can tie together and challenge the skills acquired in earlier weeks. However, for an instructor who does not wish to include a large project like this, it is possible to teach an applied statistics course with only the reading list and datasets.
The scaffolded Collaborative Dataset research project incorporates individual, collaborative, and peer review elements, with the objective of teaching students how to turn archival and observational materials into a usable data-set, how to illustrate the correlations, patterns, and stories in that dataset, and how to discuss candidly the limitations of a dataset or method of analysis. In particular, each student uses the content analysis skills learned throughout the semester to code one English-language, Holocaust survivor testimony from a pre-selected subset of the USC Shoah Foundation’s Visual History Archive (VHA), a collection of 55,000 videotaped testimonies given by survivors of the Holocaust and eight other genocides (e.g., interviews with survivors of the Rwandan Genocide or the Nanjing Massacre). In order to provide adequate context for the USC Shoah Foundation VHA dataset, Alexis includes a full lecture on Holocaust history that concludes with a guided virtual tour of both the Arolsen Archives, a collection of 50 million primary documents appropriated from the Nazis by the Allied Forces at the end of World War II, and the VHA.
Using VHA testimonies, students build and analyze a collaborative dataset in a scaffolded assignment with five deliverables:
Deliverable One: Meta-Data Analysis
Deliverable Two: Design Collaborative Codebook
Deliverable Three: Perform Collaborative Code
Deliverable Four: Conduct Analysis and Workshop Visualization
Deliverable Five: Communicate Results
Each deliverable builds on the last, so it is of utmost importance that students complete each assignment fully and on time. Educators can encourage the on-time delivery of assignments with a combination of grade incentives as well as cloud-based collaborative tools (e.g., student contributions to the group coding assignment are visible to the instructor and other members of the group in real-time, thereby motivating proactive engagement from other members of the group). In Appendix A, we describe each deliverable in greater detail for those interested in learning more or in replicating the research project.
4 Discussion
This successful course model could be applied in many other settings, which could be used to attract potential students. Here we list a few that fall outside the usual domains of mathematics, natural and social sciences, and engineering.
4.1 Disciplinary Applications
This course can be modified to be used in a non-STEM department (e.g., literature, anthropology, or religious studies), as well as in a nonnumerical institute (e.g., a theological seminary, a school of education, or a business school). The first step is to consider what level of substantive knowledge students are expected to have, and then to select datasets accordingly. For example, an introductory course might include more basic demographics or feeling thermometer-type datasets, whereas a more advanced group of students might be able to focus on a nuanced theme (e.g., data on a particular ethno-national conflict or on a specific sub-group).Footnote11 For example, a theological institute could include datasets that trace the membership and attendance of practitioners from different religious movements and a school of education could include datasets on the effectiveness of particular pedagogies or state-wide testing policies.
4.2 Language Study
This course can also be modified to teach introductory statistics within the context of an advanced language course. For example, in the five-stage deliverable outlined earlier in this article, students learning Russian at an advanced-level could focus on a Russian-language survivor testimony. This would allow them to practice close listening in a foreign language. Instructors could also require the illustration or papers to be submitted in the language of instruction. This could help students expand their language learning beyond literature and current events-based study.
4.3 Level of Quantitative Expertise
The third avenue of modification is in the level of quantitative or computational expertise prior to this course. For example, in the five-stage deliverable model, instructors could substitute more advanced analytics in stage three (e.g., requiring that students clean the dataset in R or build a multilevel model). This would likely require a larger dataset in order to go beyond a classroom exercise and to reach compelling conclusions. This approach could also be adapted for computer science exercises such as web scraping or the design of natural language processing algorithms. Lab sections in Stata, R, or Stan can also be added to supplement the course. Instructors working with more advanced students can use programs like GitHub instead of Google Drive for collaborative assignments and version management.
Discussions of statistics teaching often consider the challenges of reaching students with varying quantitative backgrounds. In this case, when considering the design of a statistics course outside of traditional statistics departments (or related quantitative subfields such as psychometrics, econometrics, or political methodology), we also need to consider the preparation of the instructor. To put it bluntly, how can you build your own statistics course if you barely know statistics? How can you teach R or Stata to students with little to no programming background if your own knowledge of computing is sketchy? We believe it can be helpful to be open about your own struggles here and to set clear goals for computing skills that you would like students to be able to achieve during the course. For faculty that need additional statistical support, it may be useful to contact departments of data science, computer science, statistics, and/or mathematics, as well as the campus library and public libraries, to inquire about further resources.
4.4 Remote Instruction
During the spring and fall of 2020, this course was adapted for online instruction when the University of Toronto moved online during the COVID-19 global pandemic. Remote instruction can be complicated because it assumes that all students have computer and internet access, as well as a physical environment conducive to learning. However, if students meet these requirements, the course’s cloud-based collaborative tools, a focus on digitally-available databases, and library access make it easily adaptable for remote instruction.Footnote12
5 Conclusion
In this article, we presented a template for teaching statistics and data science to non-mathematically-minded undergraduates. We strongly believe that data literacy is a vital component of any higher education program across the hard sciences, the social sciences, and the humanities. Graduates of history and engineering should be equally capable of reading and assessing basic numerical information, such as in the charts and graphs used to supplement news articles. We suggest that the best way to establish data literacy is to build confidence and skills in quantitative methods, and provide a template—from what materials are needed, to evaluation methods, and assignment details—for achieving this with a non-numerate audience. We have shared our pedagogical toolkit and discussed how interventions such as jitts, pretests, and collaborative research projects are essential to the success of such a course, as they allow educators to intervene just as students are bravely exploring new ideas and skills. We include a case application of how this template has been used in Jewish studies, before concluding with a number of possible applications for student variation in discipline, language skill, and quantitative expertise. We also discuss how this course can be modified for remote instruction.
Disclosure Statement
No potential conflict of interest was reported by the author(s).
Notes
1 By data literacy, we do not mean “training [everyone] to be econometricians …[and] it isn’t about training people to distrust expertise” (Oster Citation2023). Rather, data literacy is about knowing where data come from, about the difference between correlation and causality, about understanding new studies and findings in relation to how they fit into our existing understanding of a phenomenon, and about knowing how to accurately collect and interpret data.
2 These recommendations are listed as: 1. Teach statistical thinking; 2. Focus on conceptual understanding; 3. Integrate real data with a context and purpose; 4. Foster active learning; 5. Use technology to explore concepts and analyze data; and 6. Use assessments to improve and evaluate learning. For more detail, see the 2016 Revised GAISE College Report.
3 We do not provide explicitly the solutions to pre-test questions. However, everything on the pre-test is by design covered in the course. Therefore students gain the answers indirectly over the term.
4 A serious attempt is one that seems to demonstrate that the student has read the material, completed the practice problem, or thought critically about the question.
5 We are able to assess whether a student is successful in explaining a thought process to a peer by walking around the class to listen to conversations, joining in on small group discussions, and inviting groups to share their exchange with the class.
6 While there is much attention in this course to inadequate and misleading survey questions, as well as to the misuse of survey data, an instructor who wishes to have students collect this kind of survey data on campus would need to provide further training to their students. Institutional ethics requirements for course-related survey collection varies, and it is advisable for an instructor to consult their institution’s IRB or REB representative.
7 Positivism is a paradigmatic lens through which we understand knowledge as privileging tangible and quantifiable data obtained objectively (e.g., accurate and parsimonious measurements of space or temperature, à la Popper Citation1959). From a post-positivist perspective, knowledge is still observable and measurable, but this paradigm places greater emphasis on subjectivity and the validity of unobservable data. For more on the origins of post-positivism, see Kuhn (Citation1962), Cartwright (Citation1989), and Hacking (Citation1983).
8 For more information on how to adapt and perform this activity in class, see section 2.1 of Gelman and Nolan (Citation2017).
9 For more on efforts to build statistics acumen into sociology, see Wilder (Citation2010).
10 Another good alternative is the introductory textbook by Utts and Heckard (Citation2007).
11 A feeling thermometer is a survey question that offers respondents to rank their feelings or views about a subject (e.g., a political movement, a place, or their quality of life), ranging from 0 (strongest disapproval or “coldest” feeling) to 100 (strongest approval or “warmest” feeling). For more on such questions, see Lavrakas (Citation2008).
12 There is a large body of pedagogical scholarship on the best practices of remote and hybrid learning (e.g., Ward Citation2004; Tudor Citation2006; Everson and Garfield Citation2008; Mills and Raju Citation2011; Mocko Citation2013).
13 At institutions where outside time is particularly limited, such as at the United States Naval Academy, where Alexis teaches this course to midshipmen with leadership, physical, and technical training obligations in addition to their schoolwork, it may be necessary to reserve 2–3 additional in-class periods for performing this code. See Traves (Citation2019) for more on the differences between data science instruction at civilian and military institutions of higher education.
14 Instructors unfamiliar with Tableau can avail themselves of the many tutorials available on the Tableau website and even assign tutorials to students to complete alongside weekly readings. In the spring 2023 iteration of this course, Alexis used Tableau’s eLearning platform for Tableau instruction, which includes a library of highly accessible and intuitive programs for learning to use Tableau in both introductory and advanced courses. Tableau also has a “Data Literacy for All” course that instructors may find useful. At the time of this article’s writing, educators could receive a free one-year activation key for Tableau’s eLearning platform. Alternatively, some institutions may have a data science librarian with expertise in Tableau, who can advise students as they navigate the project. Given that they also complete Tableau training, Alexis permits students with advanced computational skills in other computational languages (e.g., R, STATA, or Python) to use this opportunity to practice creating visualizations in the language of their choosing, as the purpose of the exercise is the ‘data viz’ deliverable, rather than the platform used.
15 Sample questions on the peer review worksheet ask students to describe the illustration prior to the presenter speaking or answering any questions about it, with the idea that a good illustration should be able to communicate using its basic features (labeled axes, caption, title, and key) without further explanation. Students then invite the presenter to speak about their illustration and answer any questions, after which time students journal about what was effective and what could improve the illustration. The activity concludes with the reviewer talking through their comments directly to the presenter.
16 It is also possible to conduct this exercise asynchronously and remotely, as Alexis did when classes moved online due to the COVID-19 pandemic during the third iteration of this course. Organizing this exercise virtually requires several steps. First, each student submits their illustration to the instructor, generally as a PNG, JPG, or PDF file. Second, students are assigned to review two of their classmates’ illustrations and, accordingly, to have two classmates review their illustration. These assignments can be organized randomly, using a randomization generator such as http://www.Randomizer.org, or deliberately (e.g., for an instructor to knowingly match students practicing data illustration for the first time with more experienced students from data science or statistics departments). Third, the instructor distributes submitted student illustrations for review, along with the worksheet of questions to answer about each illustration (see Footnote 15). In Alexis’ experience, one week is an adequate amount of time for students to write and submit these reviews as homework. Finally, once students submit reviews of their peers’ illustrations, the instructor distributes the feedback back to individual students, along with the instructor’s own suggestions for improvement. If desired, instructors can combine these asynchronous and synchronous elements, requiring students to provide written reviews outside of class as homework while also reserving class time for student volunteers to workshop their illustration in-person.
17 This differentiation of Red Army/Russian/Soviet is not determined by the student that is coding a testimony, but rather by the survivor sharing the memory. For more on the ethics of memory, consent, and conducting a quantitative analysis of conflict archives and Holocaust testimony, see Lerner (Citation2021, Citation2022), and Presner (Citation2016).
References
- “ADL’s Global 100TM Anti-Semitism Index.” (n.d), ADL Global 100. Accessed July 9, 2020. Available at https://global100.adl.org/map.
- “Arolsen Archives - International Center on Nazi Persecution.” (n.d), Arolsen Archives. Accessed July 9, 2020. Available at https://arolsen-archives.org/en/.
- “USC Shoah Foundation Visual History Archive.” (n.d), USC Shoah Foundation Accessed July 9, 2020. Available at https://sfi.usc.edu/.
- Bargagliotti, A., Binder, W., Blakesley, L., Eusufzai, Z., Fitzpatrick, B., Ford, M., Huchting, K., Larson, S., Miric, N., Rovetti, R., Seal, K., and Zachariah, T. (2020), “Undergraduate Learning Outcomes for Achieving Data Acumen,” Journal of Statistics Education, 28, 197–211. DOI: 10.1080/10691898.2020.1776653.
- Bhargava, R., Deahl, E., Letouzé, E., Noonan, A., Sangokoya, D., and Shoup, N. (2015), “Beyond Data Literacy: Reinventing Community Engagement and Empowerment in the Age of Data.” Data-Pop Alliance. Accessed November 14, 2018. Available at https://datapopalliance.org/item/beyond-data-literacy-reinventing-community-engagement-and-empowerment-in-the-age-of-data/.
- Boger, P. (2001), “The Benefit of Student-Generated Data in an Introductory Statistics Class,” Journal of Education for Business, 77, 5–8. DOI: 10.1080/08832320109599663.
- Bradstreet, T. E. (1996), “Teaching Introductory Statistics Courses so That Nonstatisticians Experience Statistical Reasoning,” The American Statistician, 50, 69–78. DOI: 10.1080/00031305.1996.10473545.
- Brym, R., Neuman, K., and Lenton, R. (2019), “2018 Survey of Jews in Canada.” Berman Jewish Databank. Accessed July 9, 2020. Available at https://www.jewishdatabank.org/databank/search-results/study/1043.
- Brym, R., Slavina, A., and Lenton, R. (2020), “Qualifying the Leading Theory of Diaspora Jewry: An Examination of Jews from the Former Soviet Union in Canada and the United States,” Contemporary Jewry, 40, 367–385. DOI: 10.1007/s12397-020-09315-5.
- Cartwright, N. (1989), Nature’s Capacities and Their Measurement, Oxford: Oxford University Press.
- Chávez, K., and Mitchell, K. M. W. (2019), “Exploring Bias in Student Evaluations: Gender, Race, and Ethnicity,” PS: Political Science & Politics, 53, 270–274. DOI: 10.1017/S1049096519001744.
- Cleveland, W. (1994), The Elements of Graphing Data, Summit, NJ: Hobart Press.
- Cobb, G. (1992), “Teaching Statistics,” in Heeding the Call for Change: Suggestions for Curricular Action, ed. L. Steen, pp. 3–43, Washington, DC: The Mathematical Association of America.
- Crouch, C. H., and Mazur, E. (2001), “Peer Instruction: Ten Years of Experience and Results,” American Journal of Physics, 69, 970–977. DOI: 10.1119/1.1374249.
- Csillag, R. (2019), “New Course at U of T the First of Its Kind.” The Canadian Jewish News (blog). March 7. Available at https://www.cjnews.com/news/canada/u-of-t-offers-new-jewish-stats-course.
- Curry, M. (2017), “A Night at the Garden,” available at https://anightatthegarden.com/.
- Davidson, N. (1990), “Small-Group Cooperative Learning in Mathematics,” Teaching and Learning Mathematics in the 1990s. The NCTM Yearbook, 52–61.
- Demby, G. (2018), “Members of Whose Tribe?” NPR Code Switch. April 18, 2018. Available at https://www.npr.org/transcripts/602678381.
- Everson, M. G., and Garfield, J. (2008), “An Innovative Approach to Teaching Online Statistics Courses,” Technology Innovations in Statistics Education, 2. http://escholarship.org/uc/item/2v6124xr. DOI: 10.5070/T521000031.
- Fujii, L. A. (2010), “Shades of Truth and Lies: Interpreting Testimonies of War and Violence,” Journal of Peace Research, 47, 231–241. DOI: 10.1177/0022343309353097.
- GAISE College Report ASA Revision Committee. (2016), “Guidelines for Assessment and Instruction in Statistics Education College Report 2016,” available at http://www.amstat.org/education/gaise.
- Gelman, A. (2013), “Setting Up Jitts Online.” Statistical Modeling, Causal Inference, and Social Science. September 27. Available at https://statmodeling.stat.columbia.edu/2013/09/27/setting-up-jitts-online/.
- Gelman, A. (2016), “The Problems with P-Values Are Not Just with P-Values,” American Statistician, 70, 1–2.
- Gelman, A. (2019), “To Do: Construct a Build-Your-Own-Relevant-Statistics-Class Kit.” Statistical Modeling, Causal Inference, and Social Science. November 12. Available at https://statmodeling.stat.columbia.edu/2019/11/12/to-do-construct-a-build-your-own-relevant-statistics-class-kit/.
- Gelman, A., and Nolan, D. (2017), Teaching Statistics: A Bag of Tricks (2nd ed.), Oxford: Oxford University Press.
- Gelman, A., Hill, J., and Vehtari, A. (2020), Regression and Other Stories, Cambridge: Cambridge University Press.
- Hacking, I. (1983), Representing and Intervening, Introductory Topics in the Philosophy of Natural Science, Cambridge: Cambridge University Press.
- Hodges, L. C., E. C., Anderson, T. S., Carpenter, L., Cui, T. M., Gierasch, S. Leupen, K. M., Nanes, and Wagner, C. R. (2015), “Using Reading Quizzes in STEM Classes—the What, Why, and How,” Journal of College Science Teaching, 45, 49–55. Accessed September 10, 2021. http://www.jstor.org/stable/43631885. DOI: 10.2505/4/jcst15_045_01_49.
- Jankovic, J. (2019), “New ‘Jews: By the Numbers’ Course Introduces Students to Methods in Statistics and Digital Humanities.” University of Toronto Faculty of Arts & Science News. April 23. Available at https://www.artsci.utoronto.ca/news/new-jews-numbers-course-introduces-students-methods-statistics-and-digital-humanities.
- Jaskot, P. (2000), The Architecture of Oppression: The SS, Forced Labor, and the Nazi Monumental Building Economy, London: Psychology Press.
- Knowles, Anne, Tim Cole, and Alberto Giordano, eds. (2014), Geographies of the Holocaust, Bloomington: Indiana University Press.
- Kuhn, T. (1962), The Structure of Scientific Revolutions, Chicago, IL: The University of Chicago Press.
- LaBeouf, J., Griffin, J., and Roberts, D. (2016), “Faculty and Student with Group Work: What is Problematic with College Group Assignments and Why?” Journal of Education and Human Development, 5, 13–23. DOI: 10.15640/jehd.v5n1a2.
- Lavrakas, P. J. (2008), Encyclopedia of Survey Research Methods (Vols. 1–0), Thousand Oaks, CA: Sage Publications, Inc.
- Lerner, A. (2020), “Applied Statistics and Data Science in Jewish Studies.” Syllabus, University of Toronto. APSA Educate. Available at https://educate.apsanet.org/resource/01-08-2021/introduction-to-applied-statistics-and-data-science-for-students-of-jewish-studies.
- Lerner, A. (2021), “2021 Survey of North American Teens on the Holocaust and Antisemitism.” Liberation75. Available at https://www.liberation75.org/2021survey.
- Lerner, A. (2021), “What Can Quantitative Methods Teach Us about the Holocaust?” in The Routledge Handbook on Religion, Mass Atrocity, and Genocide, eds. S. E. Brown and S. Smith, pp. 443–460. Oxfordshire: Routledge.
- Lerner, A. (2022), “Quantifying the Archives: Leveraging the Norms and Tools of Data Science to Conduct Ethical Research on the Holocaust,” Holocaust Studies, 28, 358–376. DOI: 10.1080/17504902.2021.1979179.
- Little, S. G., Akin-Little, A., and Newman-Eig, L. M. (2010), “Effects on Homework Completion and Accuracy of Varied and Constant Reinforcement within an Interdependent Group Contingency System,” Journal of Applied School Psychology, 26, 115–131. DOI: 10.1080/15377900903471989.
- Luft, A. (2020), “How Do You Repair a Broken World? Conflict(Ing) Archives after the Holocaust,” Qualitative Sociology, 43, 317–343. DOI: 10.1007/s11133-020-09458-9.
- Mazur, E. (1997), Peer Instruction: A User’s Manual. Upper Saddle River, NJ: Prentice-Hall.
- Mazur, E., and Watkins, J. (2010), “Just-in-Time Teaching and Peer Instruction,” in Just-in-Time Teaching: Across the Disciplines, across the Academy, ed. S. Simkins and M. Maier, 39–62, Sterling, VA: Stylus.
- McDaniel, M. A., Wildman, K. M., and Anderson, J. L. (2012), “Using Quizzes to Enhance Summative-Assessment Performance in a Web-Based Class: An Experimental Study,” Journal of Applied Research in Memory and Cognition, 1, 18–26. DOI: 10.1016/j.jarmac.2011.10.001.
- Meer, N. M., and Chapman, A. (2014), “Assessment for Confidence: Exploring the Impact That Low-Stakes Assessment Design Has on Student Retention,” The International Journal of Management Education, 12, 186–192. DOI: 10.1016/j.ijme.2014.01.003.
- Mills, J. D., and Raju, D. (2011), “Teaching Statistics Online: A Decade’s Review of the Literature about What Works,” Journal of Statistics Education, 19. Available at http://www.amstat.org/publications/jse/v19n2/mills.pdf. DOI: 10.1080/10691898.2011.11889613.
- Mitchell, K. M., and Martin, J. (2018), “Gender Bias in Student Evaluations,” PS: Political Science & Politics, 51, 648–652. DOI: 10.1017/S104909651800001X.
- Mocko, M. (2013), “Selecting Technology to Promote Learning in an Online Introductory Statistics Course,” Technology Innovations in Statistics Education, 7. http://escholarship.org/uc/item/596195sg. DOI: 10.5070/T572013893.
- Novak, G. M., Patterson, E. T., Gavrin, A. D., and Christian, W. (1999), Just-in-Time Teaching: Blending Active Learning with Web Technology, Upper Saddle River, NJ: Prentice-Hall.
- Oceans of Data Institute. (2015), Building Global Interest in Data Literacy: A Dialogue, Waltham, MA: Educational Development Center. Available at oceansofdata.org/ourwork/building-global-interest-data-literacy-dialogue-workshop-report
- Oster, E. (2023), “Data Literacy for Parenting.” ParentData. August 10. https://emilyoster.substack.com/p/data-literacy-for-parenting.
- Pape-Lindstrom, P., Eddy, S., and Freeman, S. (2018), “Reading Quizzes Improve Exam Scores for Community College Students,” CBE—Life Sciences Education, 17, ar21. DOI: 10.1187/cbe.17-08-0160.
- Pitic, B. (2020), “Jews by the Numbers: An Introduction to Applied Statistics and Data Science for Students of Jewish Studies.” USC Shoah Foundation Center for Advanced Genocide Studies, 2020, sec. Course Development Case Study. Available at http://sfi.usc.edu/cagr/course_development/casestudy/jews-numbers-introduction-applied-statistics-and-data-science.
- Popper, K. (1959), The Logic of Scientific Discovery, New York: Basic Books.
- Prado, J. C., and Marzal, M. A. (2013), “Incorporating Data Literacy into Information Literacy Programs: Core Competencies and Contents,” Libri, 63, 123–134. DOI: 10.1515/libri-2013-0010.
- Presner, T. (2016), “The Ethics of the Algorithm: Close and Distant Listening to the Shoah Foundation Visual History Archive,” in Probing the Ethics of Holocaust Culture (Originally Published 2016, pp. 167–202, Cambridge, MA: Harvard University Press. DOI: 10.4159/9780674973244-009.
- Reid, M., and Barrington, H. (1997), Training Intervention (5th ed.), Wiltshire: The Cromwell Press.
- Rumsey, D. J. (2002), “Statistical Literacy as a Goal for Introductory Statistics Courses,” Journal of Statistics Education, 10, 1–12. DOI: 10.1080/10691898.2002.11910678.
- Shapiro, P. (2011), Bad Arolsen–“Die Öffnung Des Größten Holocaust-Archivs Der Welt. [eng. Opening the Largest Holocaust Archive in the World.]” Dritte Simon Wiesenthal Lecture. Wiener Wiesenthal Institut für Holocaust-Studien, 18 December 2008 [Posted on 26 February 2011]. Available at https://www.youtube.com/watch?v=cf-jfkh1lssfeature=youtu.be.
- Simkins, S., and Maier, M. (2010), Just-in-Time Teaching: Across the Disciplines, across the Academy, Sterling, VA: Stylus.
- Slootmaeckers, K., Kerremans, B., and Adriaensen, J. (2014), “Too Afraid to Learn: Attitudes towards Statistics as a Barrier to Learning Statistics and to Acquiring Quantitative Skills,” Politics, 34, 191–200. DOI: 10.1111/1467-9256.12042.
- Smith, S. (2016), “On the Ethics of Technology and Testimony,” In Probing the Ethics of Holocaust Culture, eds. C. Fogu, W. Kansteiner, and T. Presner, pp. 203–217, Cambridge, MA: Harvard University Press.
- Taylor, L., and Doehler, K. (2014), “Using Online Surveys to Promote and Assess Learning,” Teaching Statistics, 36, 34–40. DOI: 10.1111/test.12045.
- Traves, W. (2019), “Data Science at USNA,” Mathematica Militaris, 24, 1 (June). Available at https://digitalcommons.usmalibrary.org/mathematica_militaris/vol24/iss1/3.
- Tudor, G. (2006), “Teaching Introductory Statistics Online–Satisfying the Students,” Journal of Statistics Education, 14. http://www.amstat.org/publications/jse/v14n3/tudor.html. DOI: 10.1080/10691898.2006.11910591.
- Unz, R. (2012), “The Myth of American Meritocracy,” The American Conservative, 28.
- Utts, J., and Heckard, R. (2007), Mind on Statistics–Instructor’s Resource Manual, Belmont: Duxbury Press.
- Ward, B. (2004), “The Best of Both Worlds: A Hybrid Statistics Course,” Journal of Statistics Education, 12. http://www.amstat.org/publications/jse/v12n3/ward.html. DOI: 10.1080/10691898.2004.11910629.
- Wheelan, C. (2013), Naked Statistics: Stripping the Dread from the Data, New York: W.W. Norton & Company.
- Wilder, E. I. (2010), “A Qualitative Assessment of Efforts to Integrate Data Analysis throughout the Sociology Curriculum Feedback from Students, Faculty, and Alumni,” Teaching Sociology, 38, 226–246. DOI: 10.1177/0092055X10370118.
- Zauzmer, J. (2018), “Holocaust Study: Two-Thirds of Millennials Don’t Know What Auschwitz Is.” Washington Post, April 12. Accessed July 15. Available at https://www.washingtonpost.com/news/acts-of-faith/wp/2018/04/12/two-thirds-of-millennials-dont-know-what-auschwitz-is-according-to-study-of-fading-holocaust-knowledge/.
- Zheng, H. W. (2020), “Towards (Even) More Insightful Research: A Reflection Presentation on My Foray into the World of Statistics and Data Science.” CJS392 Final Presentation. Canva. December 14. Available at https://www.canva.com/design/DAEP9hrVapg/ddSa3asgvAie1N5KAybySg/view.
Appendix A
A. Appendix A
A.1. The Collaborative Dataset Applied
The objective of this term project is to learn how to turn archival and observational materials into a usable data-set, and to use that data to illustrate correlations, patterns, and stories in the primary materials. Each deliverable builds on the last, so it is of utmost importance that students complete each assignment fully and on time.
In particular, students will use content analysis skills learned in class to code one English-language, Holocaust survivor testimony from a pre-selected subset of the USC Shoah Foundation’s Visual History Archive (https://sfi.usc.edu/vha). The instructor provides guidance for these codes, and the class learns together how to read and use a codebook. Students will build collective datasets in a shared online spreadsheet. Finally, students will illustrate interesting findings—whether about their individual case, or in comparison with other cases.
A.1.1. Deliverable One: Meta-Data Analysis
Students begin by choosing a testimony from a list of pre-selected options that the instructor compiles. In each iteration of the course, Alexis chose to focus on a different subset of survivors: in the first iteration, students focused on the testimonies of survivors that lived in Budapest, in the second iteration, students studied on the testimonies of those that survived the Minsk Ghetto, and in the third iteration of the course, students were assigned to survivors that immigrated to Canada after World War II. In the fourth iteration, students selected from a pool of survivor testimonies collected by the same interviewer, as part of lessons on selection bias and interview-specific impacts (e.g., variation in interviewer training, leading questions, and differences in interviewer style, such as tendency to diverge from scripted questions).
Students then complete an individual short paper about the archive and the meta-data of the individual testimony that they chose to focus upon. They answer questions, such as: who built the archive, who conducted the interview and in which language, what are the contents of the archive, and whether there are any potential ethical concerns related to the archive, the interview method, or the indexing of these testimonies. To prepare students to navigate ethical concerns with this particular archive, Alexis assigns readings such as Lerner’s (Citation2021) “Quantifying the Archives,” Presner’s (Citation2016) Ethics of the Algorithm, Luft’s (Citation2020) “How Do You Repair a Broken World,” and Smith’s (Citation2016) “On the Ethics of Technology and Testimony.” Students also identify possible testable hypotheses (e.g., “A particular postwar migration pattern correlates with certain language used to describe those that provided help during the Holocaust.”), consider the operationalization or statistical measurement of their selected variables, and explain why the VHA would be an appropriate “dataset” for the proposed question. This assignment allows students to apply in-class activities and lectures that supplement assigned readings to promote learning about variable types, statistical modeling, and common biases. The Meta-Data Analysis assignment can be graded on a scale of the instructor’s choosing; a rubric is recommended.
A.1.2. Deliverable Two: Design Collaborative Codebook
Following Deliverable One, where students determine a research question, known in the social sciences as a research puzzle, that is of interest to them, in Deliverable Two they plan how to measure and record the variables that they will use in their model. In Deliverable Two, students design a collaborative codebook on a cloud-based platform (such as GoogleDocs). At this point in the course, students have read and discussed several other codebooks closely, which gives them an understanding of what makes a codebook thorough or incomplete. This deliverable facilitates experiential learning about the codebook; through this exercise, students understand that a good codebook will discuss, step-by-step, every variable collected, how it will be measured, and how a study can be replicated, as well as how to deal with predictable problems and outliers, or observations that fall outside of the expected range for a variable (Lerner Citation2021, p. 450).
Practically, students compile a draft of the cloud-based codebook together in class. Instructors may choose to have students work in peers, in small groups, or collectively. This is useful when teaching statistical principles, because students sometimes disagree about how a particular phenomenon ought to be measured; debating these specifics of data measurement results in the application of statistical principles learned in class. This exercise is well-suited for accompanying lectures on data types, replication and falsification, operationalization, and data management. Following the drafting of the codebook, Alexis requests that students submit two “comments” directly into the cloud-based document as homework. These comments are useful as they improve the codebook while presenting to quiet students an opportunity to voice their opinions about the crafting of the codebook. Alexis grades the two codebook comments in a low-stakes manner (e.g., check, check minus, check plus).
A.1.3. Deliverable Three: Perform Collaborative Code
In Deliverable Three, students put the codebook into practice by transforming archival materials—such as speech, body language, tone, and objects—into numerate data stored in a cloud-based spreadsheet (Lerner Citation2021, p. 451). Students complete this deliverable individually, though their individually-collected data is inputted into a collaborative, cloud-based dataset that all can access. Alexis provides three weeks for completing this assignment; in the first week, she hosts a coding session where students meet in-person in a computer lab or online in a synchronous session for approximately 2 hr. During this initial coding session, students work individually at their computers and are able to ask questions as they arise to the instructor or to their peers. Holding this session as a class operates as a sort of “group office hours,” where one student’s question may also be relevant for their peers. Above all, this is an opportunity for students to become comfortable navigating an online archive or dataset and with the process of coding. Students are usually able to complete about a quarter to a third of the code in this allotted time period; the remainder has to be completed outside of class.Footnote13
Alexis grades this deliverable on a scale that includes whether the student provided complete information, adheres to the codebook with precision, and writes adequate notes in an appropriate column. She cross-checks the spreadsheet at random with the original testimony to ensure that the student’s reported code accurately reflects the material it claims to represent. Further, in order to receive a grade for this assignment, students need not only to complete their portion of the code, but to download the file as both an excel file and a CSV file. They were also required to download a CSV file of the composite results of their classmates and course alumni. This exercise of downloading different formats of a document prepares them for Deliverable Four, in which they conduct their analysis of the data. If time permits at this stage, an instructor can include a hands-on lesson on how to check an excel or CSV file for errors.
A.1.4. Deliverable Four: Conduct Analysis and Workshop Visualization
Deliverable Four may look different, depending on the instructor and the level of preexisting computational knowledge among the students. Students could use any computing or illustration platform for this assignment, such as ggplot2 in R, Microsoft Excel, or D3. With first-time statistics students from non-quantitative disciplines, Alexis opts to use Tableau, a data visualization platform that is free of cost to students and available as both a downloadable or a web-based program. Instructors can leverage open-source online guides or their university libraries to assist them in delivering this information. Depending on the institution and its unique demands on student time, Alexis uses either one or two full class periods to teach students about data visualization best practices and to train them to use the Tableau software for data analysis.Footnote14
After learning about data visualization best practices and software tools in class, students design an original illustration, including a title, a key (if relevant), and a caption that explains the main features of the graph and highlights what the reader should take away from the illustration. Students share their illustrations in class informally through a workshop-style presentation. The workshop, a common tool for stimulating intellectual discourse on a work-in-progress in the fine arts, humanities, and social sciences, provides students with the opportunity to give and receive feedback on a draft document. The workshop doubles as a professionalization initiative, as students learn to give informed feedback on the effectiveness of an illustration in an empathetic manner.Footnote15 Alexis divided the grade for Deliverable Four into two equal parts: a scaled grade based on the quality of a students’ own submission and a second scaled grade for the quality of the feedback that they gave to their partners in the workshop.Footnote16
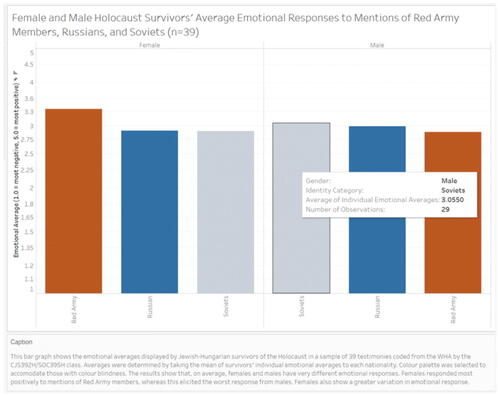
As an example of this assignment, we share with permission the illustration and presentation details of one student, Hui Wen Zheng (Citation2020), a 4th year undergraduate double-majoring in Contemporary Asian Studies and Peace and Conflict Studies, who took this course in the Fall of 2020. While Zheng had previously studied genocide and the Holocaust as units in her other courses, this was her first quantitative course and first formal Jewish Studies course. Zheng participated actively in class, including in the construction of the collaborative dataset. She used it to produce the visualization shown in , which illustrates the confluence of physical displays of emotion in the videotaped testimony and a remembered encounter with someone perceived to be in the Red Army, a Russian national, or a Soviet.Footnote17 In particular, she asked about variation in how Holocaust survivors, in their videotaped testimonies, spoke about their encounters with members of the Red Army, Russians, and Soviets. She illustrated disaggregated responses by sex, finding that females responded most positively to memories of encounters with the Red Army and most negatively for encounters with individuals they recalled as being Soviets. This pattern reversed for male survivors. Following the illustration workshop and necessary revisions of their figure, students integrate and analyze their illustration in final papers and projects, discussed in Deliverable Five.
Fig. 1 Example of student illustration. From Introduction to Applied Statistics and Data Science for Students of Jewish Studies, Winter 2020.
After workshopping her analysis, Zheng produced a final video presentation for Deliverable Five of the scaffolded research project. Further detail on this assignment is as follows.
A.1.5. Deliverable Five: Communicate Results
Individually, students produce a short (800-word) essay or a 6–7 min videotaped presentation that incorporates their tested hypothesis, their revised illustration, and an answer to the following question:
How do quantitative methods, organizational systems, and data visualization tools help scholars to learn new things about archival or observational materials?
This deliverable operates as a “final paper” and can be graded on the scale of an instructor’s choosing; once again, a rubric is recommended. In her presentation, Zheng spoke about what she learned in the course and through the scaffolded research project. She began by describing her relationship with data prior to the course:
“I considered myself more of a qualitative researcher and I only engaged with data insofar as it was useful evidence to support my findings, but I would never create that sort of data for myself and I did not really understand the process which went behind [working with] quantitative data.”
Zheng then spoke about her research puzzle, the operationalization of her variables, and the limitations of this dataset, before discussing the overall merits of quantification, of which she highlighted four. First, she praised the ability of statistics to empower students to build systematically on their own intuition and “to make quick and easy comparisons.” Second, she held up the way statistical methods can facilitate “practical and evaluative insights” while ensuring the researcher minimizes the typical pitfalls, such as “cherry-picking, sampling biases, [and] conflating correlation with causation.” Third, she highlighted how quantification and visualizations enhance numerate communication, making clear its persuasive power. Finally, and most importantly, acknowledging as she put it that “statistics are everywhere,” she underlined how quantitative learning enhances ethical and critical thinking both inside and outside of the classroom.
Zheng advanced from a data-averse to data-literate student, capable of integrating statistical reasoning and methods with case-based expertise. She began the course viewing herself as a “qualitative researcher,” but by the end stated a revised perspective that quantitative and qualitative approaches are, as she put it, “co-dependent.” Zheng’s assessment reflected the general student view of the course; for example, another student (left anonymous in accordance with institutional guidelines regarding course evaluations) in Winter 2020 reported that they completed the course with both a deeper level of knowledge about the Holocaust as well as an expanded understanding of quantitative methods. Most important, perhaps, the student commented that they learned about opportunities to merge substantive topics in the humanities with numerate tools—thereby achieving the purpose of the course.
The most negative evaluation comments came from students that expressed satisfaction with the course but discontent with the ability of the course to cover advanced statistical material in depth. In particular, these students noted an interest in including more coding exercises in Python and learning to perform neural network machine learning exercises. While it would not be possible to include all of this learning in one semester, especially given the vast differences in prior statistical knowledge, students such as these may enjoy a second, more advanced level of this kind of course.
Overall, these assessments are representative of a larger sample, based on class evaluation responses at a 54% response rate. For example, across the three iterations of the course at the University of Toronto and on a numerical scale of 1 to 5 (where one is not at all and five is definitely/always) students responded with an average score of 5/5 in regard to the statement “The course provided instruction on how to evaluate the credibility of various sources of information.” Students also responded with an average score of 4.9/5 on both the statement “Course projects, assignments, tests, and exams provided an opportunity for me to demonstrate an understanding of the course material” and “Course projects, assignments, tests, and exams improved my understanding of the course material.” These can be compared to divisional averages of 3.9/5 for courses across the Faculty of Arts and Sciences for these two questions. At the United States Naval Academy in the fourth iteration of this course, class evaluation responses were based on a 69% response rate. On a numerical scale of 1 to 5 (where 1 is not at all and 5 is definitely/always), students responded with a average score of 4.56 in response to the statement, “FP486B provided me with a deeper understanding of data science (e.g., what is data, where does it come from, how is it used to tell stories and lies)” as well as the statement “FP486B provided me with a deeper understanding of Jewish studies (e.g., who is a Jew, what is antisemitism, learning about the Holocaust and Holocaust denial).” Divisional averages at the United States Naval Academy are not available to individual instructors as of summer 2023.
Appendix B
B. Appendix B: Sample Syllabus
B.1. B.1 Applied Statistics and Data Science for Jewish Studies Syllabus
Description of the Course:
What are data? Where do data come from? How can scholars use data to tell stories (and lies!)? This course offers an introduction to data science and applied statistics, with an emphasis on demystifying data through quantitative methods, research design and ethics, and digital humanities tools. The course teaches students how to read, evaluate, and plot data in tables, charts, and graphs, and includes a training in Tableau software. We will draw from datasets of interest within the interdisciplinary field of Jewish Studies, such as the PEW Research Center’s “Portrait of Jewish Americans” (2013), the Anti-Defamation League’s Global 100 Index (2015) on anti-Semitism, the Armed Conflict Location and Event Data Project (2018), and the International Tracing Service’s Digital Collection Archive (2015). No prior training in research methods is necessary for this course. Students will complete the course with the skills necessary to recognize bias in data, identify appropriate methods for different research puzzles, and communicate the stories in numbers.
Course Objectives
Students will learn to identify the data best suited to their research puzzle and theory.
Students will gain technical skills in downloading datasets, reading .csv/.xls files, and building datasets from archival or observational material.
Students will learn to build arguments around data and discuss candidly the limitations of any given data source (and what it means for a particular study).
Students will learn to illustrate the stories in their data using data visualization tools that will aid them in future research projects.
Week 1: Basics of Empirical Research
Course Introduction and Pretest
Readings:
Wheelan. Chapter 1 (pp 1–14)
Astor, Maggie. 2018. “Holocaust Is Fading From Memory, Survey Finds.” The New York Times, April 12.
Week 2: What is/are Data?
Types of Variables and What You Can Do With Them; Descriptive Statistics
Readings:
Wheelan. Pp 110–118 (of Chapter 7) and Chapter 2 (pp.15–35).
Fujii, Lee Ann. “Shades of Truth and Lies: Interpreting Testimonies of War and Violence,” Journal of Peace Research 47, 2 (March 2010): 231–241.
Week 3: Why Data? How Data?
Where Do Data Come From and What We Can Do with Data
Readings:
Wheelan. Chapter 9.
[Video] Shapiro, Paul. 2011. “Bad Arolsen.”
Stout, David. 2006. “Germany Agrees to Open Holocaust Archives.” NYTimes.
Black, Edwin. 2007. “Survivors Outraged at Holocaust Museum Over Bad Arolsen.” History News Network.
Week 4: Puzzles and Research Questions
Operationalization, Mechanisms, and the Problems of Causality
Readings:
Wheelan. Chapters 5, 5
, and 6 + Pp 118–126.
Unz, Ron. 2012. “The Myth of American Meritocracy.” The American Conservative.
Gelman, Andrew. 2013. “Ivy Jew Update.” Statistical Modeling, Causal Inference, and Social Science. October 22.
Week 5: Qualitative Methods
Fieldwork and Interviewing; Archival Material
Readings:
Babbie, Earl, and Lucia Benaquisto. Fundamentals of Social Research. 2014. Toronto: Nelson Education Limited. Chapters 10 and 11.
Weinraub, Bernard. 1994. “Spielberg Recording Holocaust Testimony.” NYTimes.
Greenspan, Henry. 2011. “Collaborative Interpretation of Survivors’ Accounts: A Radical Challenge to Conventional Practice.” Holocaust Studies: A Journal of Culture and History 17, 1 (Spring 2011): 85–100.
Week 6: Introduction to Data Visualization and Human Geography
Introduction to Quantitative Data Analysis and Data Visualization
Readings:
Knowles, Anne. “Historical Uses of GIS.” PACSCL Symposium on Future Foundations: Mapping the Past. 2005.
Jaskot, Paul. “A Plan, a Testimony, and a Digital Map: Analyzing the Architecture of the Holocaust.” YouTube. 2018.
Week 7: Communicating Statistics and Hands-on Tableau Workshop
Readings:
Wickham, Hadley. 2014. “Tidy Data.” Journal of Statistical Software 59 (10).
Babbie, Earl, and Lucia Benaquisto. Fundamentals of Social Research. 2014. Toronto: Nelson Education Limited. Chapter 14.
Cleveland, William. 1994. The Elements of Graphing Data. Hobart Press. Chapter 2.
Week 8: Regression
Regression-Based Inference and its Pitfalls
Readings:
Wheelan. Chapters 11 and 12.
2013. “A Portrait of Jewish Americans: Overview.” PEW Research Center. Pp 1-20.
Saxe, Leonard. “The Sky is Falling! The Sky is Falling! A Reanalysis of Last Year’s Important PEW Study Contradicts Persistent Alarmism About ‘Vanishing’ American Jewry.” The Jewish Journal of Sociology 57, 1–2 (2015).
Hirschfield, Brad. “What PEW’s Jewish Poll Reveals About the Faithful–and Faithless.” Washington Post. Oct 1, 2013.
Eisen, Arnold. “Understanding American Jews.” PEW Research Center. 2018.
Week 9: Statistical Ethics
How to Lie with Data (But Don’t Do It!)
Readings:
Black, Edwin. 2001. IBM and the Holocaust: The Strategic Alliance Between Nazi Germany and America’s Most Powerful Corporation. New York: Crown. Introduction.
Wernicke, Sebastian. 2010. Lies, Damned Lies, and Statistics. TED Talks.
Lerner, Alexis. 2022. “Quantifying the Archives: Leveraging the Norms and Tools of Data Science to Conduct Ethical Research on the Holocaust.” Holocaust Studies: A Journal of Culture and History 28 (3): 358–376.
Week 10: Surveys and Experiments
Readings:
Wheeler. Chapters 10 and 13.
Lerner, Alexis. 2015. “Crime and Punishment: Hate Crime Legislation, Public Opinion Polling, and the Jewish Minority in Post-Soviet Russia.” Jewish Thought, no. 5: 57–72.
Cohen, Jeffrey. 2018. “From Antisemitism to Philosemitism? Trends in American Attitudes toward Jews from 1964 to 2016.” Religions 9 (4): 107.
[Skim] ADL Global-100 Executive Summary (2014) [Hyperlinked]