ABSTRACT
Improper collection, segregation, transportation, treatment, and disposal of healthcare waste pose risk to public health and the environment. This study aimed to determine healthcare waste generation rate, composition, and management practice in Dilla University Referral Hospital. Methods Institutional-based cross-sectional study was conducted in Dilla University Referral Hospital from May 2019 to June 2019. The quantitative data were collected for eight consecutive days using direct measurement of healthcare waste. The qualitative data were collected by using an observational checklist, and in-depth interview. The collected qualitative data were transcribed, and thematic content analysis was done. A total of 1212.5 kg of healthcare waste was generated in the study period with an average of 151.56 kg (±73.4). The hazardous fraction of the healthcare waste was 581.9 kg (48%) while the generation rate was 0.866 kg bed−1day−1. General waste accounted for 630.6 kg (52%) of the total healthcare waste generated in the teaching hospital, followed by infectious waste at 299.5 kg (24.7%). There was no segregation of healthcare waste by type at the point of generation and there was no pre-treatment of infectious wastes. The placenta pit was used for pathological wastes and open burning was the main disposal mechanism for the remaining wastes. The finding indicated that the proportion of the hazardous waste generated from the hospital was above the World Health Organization recommended threshold. There was a lack of appropriate waste segregation, storage, transport, and disposal practices in the referral hospital.
Abbreviations: DURH- Dilla University Referral HospitalHCW- Health Care WasteICU- Intensive Care UnitNICU- Neonatal Intensive Care UnitOR- Operation RoomOPD- Out Patient DepartmentSD- Standard DeviationSDG- Sustainable Development GoalsSNNPRS- Southern Nation Nationality and People Regional StateWHO-World Health Organization
PUBLIC INTEREST STATEMENT
Healthcare waste management in most-developing countries remains a big challenge. Despite numerous efforts to address these challenges and number of studies conducted, a reliable data regarding the generation rate, waste composition and management practice were very limited in most healthcare facilities. Even if it is assumed that between 10% and 25% of healthcare waste is considered as “hazardous” and may pose a variety of environmental and public health risks, because of the poor segregation practice and handling malpractices the proportion is higher than expected in most health facilities in developing countries. Because this, vulnerable groups such as healthcare workers, waste handlers, patients, visitors, and the general public are at a greater risk of exposure to infectious agents, toxic effects, and injuries. Therefore, to design, plan and implement an effective healthcare waste management practices reliable information regarding the generation rate, composition and management practice is crucial.
1. Introduction
Healthcare waste (HCW) is characterized as any waste generated by a healthcare facility while providing healthcare services. It is divided into two categories: non-hazardous (general waste) and hazardous HCW (Pinto et al., Citation2014; World Health Organization, Citation2015).
General waste, also known as non-hazardous waste, makes up the majority of HCW, accounting for 75% to 90% of total HCW. It comes mostly from food storage, administrative, and housekeeping operations, and poses little risk to public health (World Health Organization (WHO), Citation2011; WHO, Citation2014; World Health Organization, Citation2015).
Hazardous HCW, on the other hand, includes laboratory wastes, pathological wastes, body fluids, infectious materials, sharps, pharmaceuticals, harmful chemicals, substances with high heavy metal content, and genotoxic material, which make up 10–25% of all HCW (World Health Organization (WHO), Citation2011; WHO, Citation2014; Olufunsho et al., Citation2016). Healthcare workers, waste handlers, patients, visitors, and the general public can be exposed to infectious agents, toxic effects, and injuries as a result of dangerous and improper HCW management, with nurses and housekeeping employees being the key groups at risk of injury (Bassey et al., Citation2006; Jang et al., Citation2006; Lee & Huffman, Citation1992; United States Environmental Protection Agency, Citation1998, Citation1997; WHO, Citation2014). This indiscriminate handling and unsafe disposal practices could also lead to the pollution of air, soil, and water (Tsakona et al., Citation2007).
The transmission of more than 30 blood-borne pathogens has been related to poor HCW management (Sawalem et al., Citation2009). Poorly handled sharp wastes contaminated with human blood, for example, have been linked to the transmission of HIV and hepatitis B and C viruses (WHO, Citation2014). Every year, more than two million healthcare workers are estimated to be exposed to percutaneous injuries as a result of contaminated sharp wastes around the world (Prüss-Üstün et al., Citation2005).
Injections with infected syringes caused 21 million hepatitis B virus infections, accounting for 32% of all new infections; 2 million hepatitis C virus infections, accounting for 40% of all new infections; and 260,000 human immunodeficiency virus infections, killing over 5.2 million people worldwide each year, including 4 million children (Prüss-Üstün et al., Citation2005).
The presence of hazardous waste in the hospital waste stream, even if it is a small percentage, will result in higher costs in addition to significant public health risks and emissions (Yazie et al., Citation2019). Implementing appropriate methods, such as successful segregation of hazardous and non-hazardous waste, is linked not only to lower risks but also to lower waste management costs (Castellani et al., Citation2015; Ibbotson et al., Citation2013; Mosquera et al., Citation2014; Windfeld and Brooks, Citation2015).
As a result, effective HCW management is critical in maintaining public and environmental health (World Health Organization, Citation2015). Segregation, collection, storage, transportation, treatment, and disposal are all important aspects of a successful healthcare waste management process (Manyele & Lyasenga, Citation2010; Meleko & Adane, Citation2018; Olufunsho et al., Citation2016; Yazie et al., Citation2019). HCW is becoming a huge challenge, particularly for many developed countries that are lagging far behind recommended guidelines (Azage et al., Citation2013; Diaz, Citation2005; Haylamicheal et al., Citation2011; Titto et al., Citation2012; Townend & Vallini, Citation2008; Yazie et al., Citation2019).
Healthcare waste management is a major problem in most hospitals in Ethiopia (Yazie et al., Citation2019). The healthcare waste generation rate varies across different hospitals in Ethiopia. Different studies conducted among hospitals in Ethiopia have reported a healthcare waste generation rate in the range of (17.56–228.6) kg/day, (0.164–1.94) kg/bed/day, and (0.073–1.15) hazardous waste/kg/day (Debere et al. Citation2013; Atnafu & Kumie, Citation2017; Hayleeyesus & Cherinete, Citation2016; Meleko & Adane, Citation2018). The proportion of hazardous HCW fraction also ranged from 21% to 70% (Yazie et al., Citation2019), which is far from the hazardous healthcare waste threshold (10–25%) predicted by the WHO (World Health Organization, Citation2015). Most of the hospitals in Ethiopia, have a poor healthcare waste management practice characterized by poor segregation of infectious waste from the general waste, improper storage and transportation, no or little treatment and disposal practices (Debere et al. Citation2013; Atnafu & Kumie, Citation2017; Federal Ministry of Health, Citation2008; Hayleeyesus & Cherinete, Citation2016; Meleko & Adane, Citation2018; Yazie et al., Citation2019).
To improve the HCWM practice, to allocate sufficient resources, to plan the future healthcare waste management tasks and the sizes of the new disposal facilities in the healthcare facility, information regarding the generation rate, composition and management practice of HCW must be available for planners and decision makers (World Health Organization, Citation2015). This data are also very important for hospital managers, infection prevention officers and all actors in the healthcare waste managers who are involved in procurement specifications, planning, budgeting, calculating revenues from recycling, optimization of waste-management systems and environmental impact assessments (World Health Organization, Citation2015).
Any infection prevention intervention regarding the waste management must first address questions like “What is the current HCW generation rate, composition and management practice?” in order to achieve optimal healthcare waste management practices. Therefore, this study intends to fill the gap by generating a reliable data regarding the healthcare waste generation, composition and management practiced in Dilla University referral hospital in southern Ethiopia.
2. Materials and methods
2.1. Study area, design, and period
The study was conducted in Dilla University Referral Hospital which is found in Southern Nation Nationality and People Regional State (SNNPRS), Ethiopia. Dilla University Referral Hospital is one of the hospitals in the Gedeo zone, and it is run by Dilla University. It serves as a practical training center for more than five departments, as well as providing curative services. The hospital provides both outpatient and inpatient services with a total bed capacity of 200. The hospital serves as a referral hospital for the health centers and nearby primary hospitals. An institutional-based cross-sectional survey was conducted from May to June 2019 for eight consecutive days to quantify the healthcare waste generation rate and to evaluate its management system.
2.2. Data collection tools and procedures
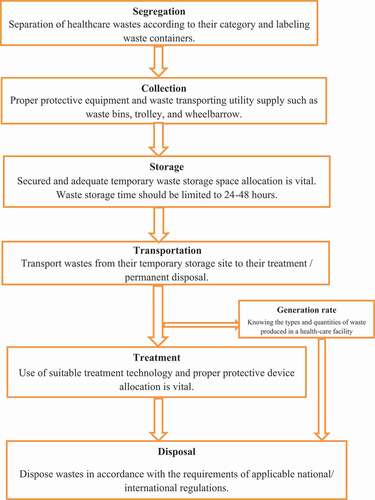
To determine HCW composition the waste of different classes collected from different service delivery points was poured on a designated area at the back of the hospital for segregation ().
Figure 1. Healthcare waste management process in Dilla University Referral Hospital, Southern Ethiopia, 2019 Adopted from (Yazie et al., Citation2019)
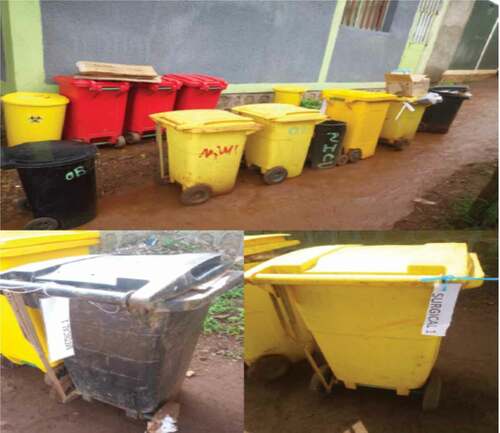
The weighing was conducted for eight consecutive days (it started and ended on Monday) and the total weight of waste per level of each department or ward was obtained by adding the weight of waste in each class per day. The waste segregation was carried out by trained data collectors at a designated location, and the segregated waste was weighed. The waste was sprayed with disinfectant solution (0.5% sodium hypochlorite) before segregation of the HCW began (Suwannee, Citation2002). A supervisor recorded the weight of the waste (in kilograms) by department and service delivery point. A weighing scale was used to quantify the amount of HCW generated. The waste was classified as sharps, infectious, pathological, pharmaceutical, and general waste such as food waste, plastics papers, and other domestic wastes. The waste containers were labeled to identify the ward in which the waste is generated. The waste containers were transported from each ward in each shift to the temporary station designated for waste segregation and measurement (). The wastes were finally disposed of after being sorted and measured, and the waste containers were returned to their wards to be ready for the next shift.
Figure 2. Labeled healthcare waste containers before waste measurement at Dilla University Referral Hospital, Southern Ethiopia, 2019
The physical observation was carried out to assess the healthcare waste handling, segregation, and transportation and disposal practices. A standardized questionnaire/checklist adapted from the WHO for HCW (WHO, Citation2014) was used for both the qualitative and the quantitative data collection. The daily patient load and the bed occupancy rate were taken from the hospital triage system and registers. In addition to direct observations, five in-depth interviews were conducted with the hospital administrators (Executive Director, Deputy Director, Nursing superintendent), senior management involved in the infection prevention team which also handle the healthcare the cleaners’ coordinator and waste management till the point of saturation.
2.3. Data analysis
For quantitative data, data were entered and analyzed by SPSS version 25. The data distributions were explored for the normality test. Descriptive statistics of frequency tabulation, mean, standard deviation, and percentages were used to summarize the generation of HCW into meaningful form. The results were also presented using tables, and graphs. The healthcare waste generation rates were reported in terms of kg/bed/day, and kg/patient/day. Classification of healthcare waste was done based on WHO criteria for healthcare wastes (WHO, Citation2014). Hazardous and non-hazardous fractions were also computed accordingly. The collected qualitative data were transcribed and a thematic content analysis was done. After the specific nodes were developed for the questions, the significant findings and responses were aggregate as sub-nodes. These sub-nodes were later developed into themes and the information from different literature and responses were then triangulated.
2.4. Ethical considerations
The ethical approval for this study was granted by Dilla University College of Health and Medical Science, Institutional Ethical Review Board. A supportive written letter was granted to all the concerned departments, involved in the qualitative study. Personal protective types of equipment were supplied for data collectors and training on infection prevention was given before the starting of the study.
3. Results
3.1. Healthcare waste generation
As indicated in () data was collected for eight consecutive days (where it started and ended on Monday) and a total of 1212.5 kg of healthcare waste was generated in the teaching hospital. An average of 151.56 (±73.4) kg of healthcare waste was generated in the study period with the lowest recorded was 51 kg on day two (by coincidence which was a national holiday where only the emergency room and inpatient wards are actively working), and the maximum waste generated was 241.4 kg on day four. Regarding the classification of healthcare waste in the study period, general waste was the highest 445.3 kg followed by infectious waste which was 299.5 kg and chemical waste was the lowest generated healthcare waste in DURH which was 60 kg.
Table 1. Daily healthcare waste generation by the department in Dilla University Referral Hospital, Southern Ethiopia, 2019
As indicated in (), the medical ward, gynecology ward, and medical Laboratory produced the highest waste, with a total waste of 182, 121.6, and 110.1 kg, respectively, while adult ICU produced the lowest 5.6 kg of healthcare waste in the hospital during the study period.
Table 2. Classification of healthcare waste by department in Dilla University Referral Hospital, Southern Ethiopia, 2019
The medical ward produced the highest amount of both infectious and total waste, as showed in (). The waste generated from the radiology department, offices, and adult ICU produced the lowest healthcare waste in the hospital during the study period.
With a total of 200 beds and an average bed occupancy rate of 92%, and an average daily patient load of 271, the waste generation rate for the hospital was calculated as 151.6 kg day−1, 0.866 kg bed−1, day−1, 0.529 kg patient−1 day−1, 0.248 patient−1 day−1 and 0.396 kg bed−1 day−1.
3.2. Composition of healthcare waste
Plastic was the highest constituent of the wastes with 663.4 kg and paper waste was the least with 30.7 kg ().
Table 3. Composition of healthcare waste in Dilla University Referral Hospital, Southern Ethiopia, 2019
3.3. Classification of healthcare waste
General waste with 150.7 kg day−1 was the highest type of waste produced across the days in the study period followed by infectious waste with 38.3 kg day−1. Day two recorded the lowest generation rate by type.
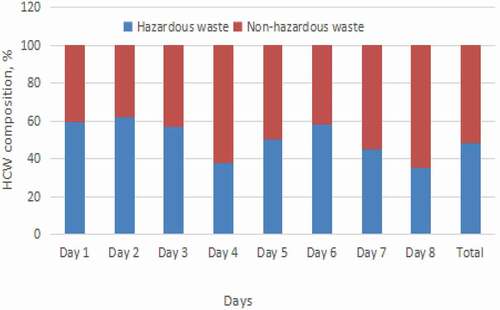
3.4. Hazardous fraction of the healthcare waste
Average hazardous waste generation was 72.74 kg SD (± 32.6). As indicated in () the hazardous fraction of healthcare waste for Dilla University Referral Hospital was 48%.
Figure 3. Hazardous and non-hazardous fraction of health care wastes in Dilla University Referral Hospital, Southern Ethiopia, 2019
3.5. Healthcare waste management practice
Findings from the physical observation
Our physical observation result focused on four recommended steps of healthcare waste management in the hospital. Waste management practices at the teaching Hospital include the use of waste bins with 20 and 60-l capacity for storage at the wards, collection from the wards to secondary storage points, and transfer to open dumpsite for disposal by cleaners.
Segregation: HCW was temporarily stored in plastic containers. Segregation of HCW by type at the point of generation and pre-treatment of infectious waste was also not practiced. Moreover, sharps are required to be disposed of in a safety box, but this was not practiced at the time of observation in many wards. Each ward has three small color-coded waste bins: red for pathological, black for general, yellow for infectious wastes, and yellow and white safety boxes for sharp materials. However, there was not any proper labeling on the bins. There were no separate bins for hazardous waste such as pharmaceutical waste, chemical waste, and radioactive wastes. The red or yellow bins are used for these kinds of wastes. A black waste bin was found at the patient’s bedside and was being used for all sorts of waste. The HCWs were not segregating the infectious waste, as some of the patient’s blood stained objects were seen in the general waste bin.
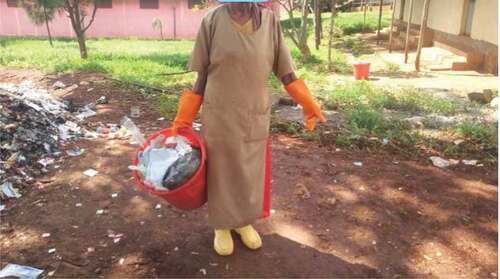
On-site healthcare waste collection and transport: On-site waste collection is done by the hospital itself. It is collected twice a day in DURH. There was no wheeled trolleys utilized for the transportation of wastes rather, it was simply picked and carried by cleaners and taken to the disposal site as showed in (). Three bin (Red, yellow and black) containers were present in most of the wards. Sub-standard containers which are suitable only for office purposes were also observed in most wards. The most common sizes of containers observed were 30-l containers in each patient room and 60-l containers in the building corridors. The poor HCW segregation practice (mostly sharp materials) in most of the substandard containers and the absence of transporting healthcare wastes without trolleys were the main causes of injuries to cleaners as shown in ().
Figure 4. On-site healthcare waste transportation in Dilla University Referral Hospital, Southern Ethiopia, 2019
Storage: There are no separate storage points located in the hospital. All the wastes collected from the wards using small color-coded bins are transferred to the big waste bins located at each block only to be transported and end up at the disposal site. Washing and disinfecting of waste containers that were used to transport either infectious or non-infectious wastes together were not even washed or disinfected afterward.
Healthcare waste treatment: There was no treatment mechanism applied to the healthcare wastes in the hospital before disposal.
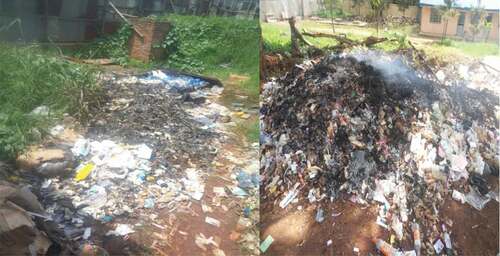
On-site healthcare Waste disposal: The hospital had two incinerators that were not functional at the time of the study and open dumping and then burning was the only means of healthcare waste disposal except the pathological wastes. Pathological wastes were disposed of in a placenta pit located in a secured area in the hospital compound as indicated in (). Again, PPE was not used during the disposal. General wastes such as kitchen and garden wastes were dumped in an open on-site pit prepared for this purpose inside the hospital compound as indicated in ().
Figure 5. Disposal of healthcare wastes in Dilla University Referral Hospital
Occupational safety practices
At the time of data collection, cleaners were observed wearing heavy duty-gloves plastic shoes and aprons as shown in (), but adequate and proper personal protective equipment (PPE) such as long rubber boots, waterproof aprons, goggles, and masks were not available during waste collection. The management problem in the procurement process was the main reason according to the hospital infection prevention case team leader.
We always send lists of the right safety materials, and products needed for the infection prevention and control tasks including the health care waste management but what we get was not what we ordered. This was a challenge that has complicated our task.
Hence, WHO guidelines were not followed at all.
Findings from the in-depth interview
All of the five respondents in the in-depth interviews were male staff, regular government employees in different leadership positions who were responsible for the management of healthare waste which includes the medical director, Deputy Medical Director, Nursing superintendent, infection prevention team leader, and focal person from the cleaners. Thematic results are presented as follows.
Organization and Planning: There is an institutional structure for healthcare waste management in the hospital. The healthcare waste management is carried out under the infection prevention and patient safety case team. There is an infection prevention committee organized from all departments and discussed the prominent issues every month but the impact of the decision of this committee is limited to make the desired outcome regarding proper HCW. There is an annual healthcare waste management plan along with the infection prevention and patient safety plan. But, policies, standard operating procedures, and working manuals or guidelines were lacking regarding healthcare waste management in the teaching hospital.
Staff Development: Even if, there were no developed training modules in DURH, two rounds of training have been given for cleaners and the health professionals on basic infection prevention and control which includes health care waste management. There were no health information materials regarding healthcare wastes to the hospital staff, the patients as well as the caregivers on how to manage healthcare wastes safely.
Waste management records: One of the basic problems in healthcare waste management in DURH was the absence of daily waste segregation, collection, and monitoring records. As a result, wastes are neither weighted daily nor monthly and their segregation collection transportation, and disposal practices are also not monitored and recorded. The waste collection is scheduled twice a day, which was in the morning and the afternoon.
4. Discussion
Environmental sustainability and responsibility have emerged as important aspects of Sustainable Development Goals (SDGs) towards the generation of ever-increased wastes that are a real threat to human and environmental health. While the provision of high-quality health services improves health and well-being overall, unfortunately, it may result in the generation of potentially harmful waste if not managed appropriately (Global Fund, Citation2020). One reliable healthcare waste management plan involves a periodic quantification of the generation rate and information of waste type (Aslam et al., Citation2015; Atnafu & Kumie, Citation2017).
On daily basis, averagely151.6 ± (SD 73.41) kg day−1 of healthcare waste was generated from the referral hospital. This result was higher than a result obtained in Mizan Tepi University teaching hospital (Meleko & Adane, Citation2018), Bench Maji (Meleko et al., Citation2018), and Menilk Hospital (Tadesse & Kumie, Citation2014) which may be associated with variation of annual patient load, traffic flow management system (number of caregivers and visitors), seasonal variation and geographical related health conditions. The daily overall average obtained by this study was lower than the study conducted in Adama city, Ethiopia where the average daily waste generation was 228.60 (± 79.36) kg day−1(Hayleeyesus & Cherinete, Citation2016).
The overall average HCW generation rate was 0.529 kg patient−1day−1. This result was higher than the study done in Addis Ababa which was 0.490 kg patient−1day−1 as reported by (Atnafu & Kumie, Citation2017). This difference could be mainly due to the difference in patient load as well as the difference in HCW management systems, waste characterization, and classification as well as enforcement of laws and regulation of the country which enables them to follow the same procurement policies for the purchase and consumption of commodities.
The healthcare waste generation rate was 0.866 kg bed−1 day−1. This result is lower than the study done by (Tadesse & Kumie, Citation2014; Tesfahun et al., Citation2016) who reported that the generation rate was 6.03 kg bed−1 day−1 and 2.45 kg bed−1 day−1 respectively. This variation might be due to the difference in patient load, the type and vastness of the healthcare service delivered, and the type and the nature of waste generated at each case team.
The generation rate was lower from other countries generation rate also from Bauru region Brazil 4.375 kg bed−1 day−1 (Delmonico et al., Citation2018) Gorgan region Iran 1.83 kg bed−1 day−1 (Dehghani & Vafadar, Citation2017), Gaza Strip Palestine 1.3 kg bed−1 day−1 (Caniato et al., Citation2016). However, it was lower when compared to Nigeria Lagos, 0.57 kg -bed−1 day−1 (Longe, Citation2012), Pakistan Gujranwala 0.667 kg bed−1 day−1 (Ali et al., Citation2016), and India Uttarakhand 0.24 kg bed−1 day−1 (Thakur & Anbanandam, Citation2017). The rise that was noted in this study for the average generation rate may be attributed to the lack of intervention in the Gedeo zone through the awareness and training programs organized for proper segregation of infectious waste, adequate categorization, and disposal of the waste. On contrary, the average healthcare waste generation rates were reported in the range of 1.053 kg bed−1day−1 to 2.290 kg bed−1day−1 in Abuja, Nigeria (Bassey et al., Citation2006). The difference in the generation rates could be due to seasonal variation, availability of different facilities, and resource allocation for the management of healthcare wastes (Tadesse & Kumie, Citation2014).
In the present study, relatively higher amounts of HCW generated from the medical ward 22.76 kg/day followed by gynecology (15.1 kg day−1), emergency (14.86 kg day−1), pediatrics (14.63 kg day−1), and laboratory (13.76 kg day−1) as shown in (). The portion of hazardous waste for the hospital in Dilla University Referral Hospital was 48%. This proportion was higher than the hazardous waste threshold (10–25%) predicted in 2014 by WHO (World Health Organization, Citation2015; Global; Fund, Citation2020) while non-hazardous wastes were lower than the threshold ranged from 75% to 90% (Nuralam et al., Citation2017; Taghipour et al., Citation2014). Similar higher proportions of hazardous fraction were reported in Brazil 52% (Delmonico et al., Citation2018), Iran 47% (Dehghani & Vafadar, Citation2017), Nigeria Legos 51% (Manga et al., Citation2011). Higher proportions of Health care waste were reported in Kenya Nirobi 65% (Nkonge et al., Citation2014) and in India 63.67% (Thakur & Anbanandam, Citation2017) whereas lower proportions (11.2% to 20.64%) of hazardous waste were reported in Bangladesh HCW (Alam et al., Citation2013; Nuralam et al., Citation2017). In this study, the higher hazardous waste fraction in healthcare wastes was reported as opposed to the limit set by WHO might result from poor classifications and segregation practices of on-site handling systems. Our finding was in line with the pooled national data reported in Ethiopia indicated that the proportion of hazardous waste ranged from 21% to 70% (Yazie et al., Citation2019). This is a clear indication of poor healthcare waste segregation practice in the hospital.
Our finding was also in contrast with the Ethiopian Healthcare Waste Management Directive, which indicated that any health facility must ensures the implementation of waste minimization measures and segregation of healthcare wastes at the point of service delivery using appropriate containers which are appropriately labeled with basic information about the content and sources of wastes or department (EFMHACA, Citation2005).
The final disposal mechanism employed for the HCW in Dilla university referral hospital was open burning because the earlier incinerator was out of use. However, this type of disposal mechanism is not recommended and is in contrast to the Stockholm Convention, which allows the introduction of toxic substances into the environment that are a risk to public health (Lee & Huffman, Citation1992; Caniato et al. Citation2016; Prüss-Üstün et al., Citation2005). Since, the open damping disposal area is located closer to the adult ICU and other inpatient wards the adverse health effect of the improper HCW disposal might be greater than anticipated.
Different cost effective healthcare waste disposal methods shall be implemented for different healthcare wastes in the hospital (Ali et al., Citation2017). For example, onsite treatment through dilution has been suggested for chemical wastes (Williams, Citation2013). For infectious wastes or mixed items such as cotton dressings, clothes could be disposed in an environmentally friendly technique such as Pyrolysis with energy recovery can be used for disposal instead of burning in an efficient incinerators (Salkin, Citation2003). Incineration under high pressure after chemical treatment or treatment by Pyrolysis is the recommended method of treatment for sharp, infectious and wastes that are mixed with infectious wastes (Ali et al., Citation2017). Good segregation practice can also help general wastes to be landfilled or incinerated or treated by Pyrolysis (Ali et al., Citation2017).
Future researches should also focus in waste minimization and other environmentally friendly waste management systems such as waste recovery from HCW. The knowledge attitude and practices of health professionals to wards the proper management of HCWM should also be given priority.
5. Conclusion
The overall findings of this study indicate that the percentage composition of hazardous healthcare waste generated from DURH is above the threshold set by the WHO. There is a lack of appropriate on-site waste handling, segregation, transportation, and disposal of HCW in the hospital.
These improper healthcare waste management practices are mostly resulted from either ignorance of applying appropriate practices or due to lack of awareness of the proper healthcare waste management system. This can pose a risk to public health and the environment. Therefore, investment in recommended disposal facilities, continuous monitoring, and evaluation of the healthcare waste management practice, training for both healthcare workers and cleaners is critical to increase their awareness on the proper healthcare waste handling and management practices.
Author’s contribution
All authors contributed equally in the conception, actual data collection, analysis, and write-up of the result and the manuscript preparation.
Acknowledgements
The researchers would like to extend their deepest gratitude to Dilla University Energy and Environment research center and the research and dissemination office for the financial support for this study. The management teams of the hospital also deserved applauds for their support while conducting this research.
Disclosure statement
The authors declare no conflict of interest, financial or otherwise.
Data availability statement
The data sets used and/or analyzed during the current study are available from the corresponding author on reasonable request.
Additional information
Funding
References
- Alam, M. Z., Islam, M. S., & Islam, M. R. (2013). Medical waste management: A case study on Rajshahi city corporation in Bangladesh. Journal of Environmental Science and Natural Resources, 6(1), 173–11. https://doi.org/https://doi.org/10.4236/jep.2016.71009
- Ali, M., Wang, W., & Chaudhry, N. (2016). Management of wastes from hospitals: A case study in Pakistan. Waste Management & Research: The Journal for a Sustainable Circular Economy, 34(1), 87–90. https://doi.org/https://doi.org/10.1177/0734242X15616474
- Ali, M., Wang, W., Chaudhry, N., & Geng, Y. (2017). Hospital waste management in developing countries: A mini review. Waste Management & Research, 35(6), 581–592. https://doi.org/https://doi.org/10.1177/0734242X17691344
- Aslam, M., Shaukat, S. A., Rashid, A., Khalid, A., Shaukat, S. K., & Shoukat, S. W. (2015). Assessment and characterization of hospital waste in government and private hospitals of Rawalpindi City. International Journal of Environmental Planning and Management, 1(2), 33–40.
- Atnafu, D. D., & Kumie, A. (2017). Healthcare waste composition and generation rate in Menellik II Referral Hospital, Addis Ababa, Ethiopia: A cross-sectional study. International Journal of Sustainability Management and Information Technologies, 3(2), 10. https://doi.org/https://doi.org/10.11648/j.ijsmit.20170302.11
- Azage, M., Gebrehiwot, H., & Molla, M. (2013, 7). Healthcare waste management practices among healthcare workers in healthcare facilities of Gondar town, Northwest Ethiopia. Health Science Journal, Jul(3), 315–326.
- Bassey, B. E., Benka-Coker, M. O., & Aluyi, H. A. (2006). Characterization and management of solid medical wastes in the Federal Capital Territory, Abuja Nigeria. African Health Sciences, 6(1), 58–63. https://doi.org/https://doi.org/10.5555/afhs.2006.6.1.58
- Caniato, M., Tudor, T. L., & Vaccari, M. (2016). Assessment of health-care waste management in a humanitarian crisis: A case study of the Gaza Strip. Waste Management, 58, 386–396. https://doi.org/https://doi.org/10.1016/j.wasman.2016.09.017
- Caniato, M., Tudor, T. L., & Vaccari, M. (2016). Assessment of health-care waste management in a humanitarian crisis: A case study of the Gaza Strip. Waste management, 58, 386–396.
- Castellani, V., Sala, S., & Mirabella, N. (2015). Beyond the throwaway society: A life cycle‐based assessment of the environmental benefit of reuse. Integrated environmental assessment and management, 11(3), 373–382.
- Debere, M. K., Gelaye, K. A., Alamdo, A. G., & Trifa, Z. M. (2013). Assessment of the health care waste generation rates and its management system in hospitals of Addis Ababa, Ethiopia, 2011. BMC public health, 13(1), 1–9.
- Dehghani, M., & Vafadar, M. (2017). Qualitative and quantitative survey and suggested management strategy of hospital solid waste at Hormozgan Province, Iran. Ambient Science, 4,(4). https://doi.org/https://doi.org/10.21276/ambi.2017.04.1.ra04
- Delmonico, D. V. D. G., Santos, H. H. D., Pinheiro, M. A. P., De Castro, R., & de Souza, R. M. (2018). Waste management barriers in developing country hospitals: Case study and AHP analysis. Waste Management & Research: The Journal for a Sustainable Circular Economy, 36(1), 48–58. https://doi.org/https://doi.org/10.1177/0734242X17739972
- Diaz, L. F. (2005). Management of healthcare wastes. Waste Management, 25(6), 567–574. https://doi.org/https://doi.org/10.1016/j.wasman.2005.05.003
- EFMHACA. (2005) . Ethiopian food, medicine and healthcare administration and control authority. Healthcare Waste Management Directive.
- Federal Ministry of Health. (2008). Health Care waste management national guidelines. Addis Ababa (p. 126 p).
- Fund, G. (2020). Technical brief: Sustainable health care waste management. (T. G. Fund, Editor). Switzerland.
- Haylamicheal, I. D., Dalvie, M. A., Yirsaw, B. D., & Zegeye, H. A. (2011, August). Assessing the management of healthcare waste in Hawassa city, Ethiopia. Waste Management & Research: The Journal for a Sustainable Circular Economy, 29(8), 854–862. https://doi.org/https://doi.org/10.4314/jasem.v23i6.13
- Hayleeyesus, S. F., & Cherinete, W. (2016). Healthcare waste generation and management in public healthcare facilities in Adama, Ethiopia. Journal of Health & Pollution, 6(10), 64–73. https://doi.org/https://doi.org/10.5696/2156-9614-6-10.64
- Ibbotson, S., Dettmer, T., Kara, S., & Herrmann, C. (2013). Eco-efficiency of disposable and reusable surgical instruments—a scissors case. The International Journal of Life Cycle Assessment, 18(5), 1137–1148.
- Jang, Y.-C., Lee, C., Yoon, O.-S., & Kim, H. (2006). Medical waste management in Korea. Journal of Environmental Management, 80(2), 107–115. https://doi.org/https://doi.org/10.1016/j.jenvman.2005.08.018
- Lee, C. C., & Huffman, G. L. (1992 December 23). Metals behavior during medical waste incineration [Internet]. U.S. Environmental Protection Agency. Retrieved Sep 16, 2015, from https://web.anl.gov/PCS/acsfuel/preprint%20archive/Files/36_4_NEW%20YORK_08-91_1735.pdf
- Longe, E. O. (2012). Healthcare waste management status in Lagos State, Nigeria: A case study from selected healthcare facilities in Ikorodu and Lagos metropolis. Waste Management & Research: The Journal for a Sustainable Circular Economy, 30(6), 562–571. https://doi.org/https://doi.org/10.1177/0734242X11412109
- Manga, V. E., Forton, O. T., Mofor, L. A., & Woodard, R. (2011). Health care waste management in Cameroon: A case study from the Southwestern Region. Resources, Conservation and Recycling, 57, 108–116. https://doi.org/https://doi.org/10.1016/j.resconrec.2011.10.002
- Manyele, S. V., & Lyasenga, T. J. (2010). Factors affecting medical waste management in low level health facilities in Tanzania. African Journal Of. Environmental Science and Technology, 4(5), 304–318. http://www.academicjournals.org/AJEST
- Meleko, A., & Adane, A. (2018). Assessment of health care waste generation rate and evaluation of its management system in Mizan Tepi University Teaching Hospital (MTUTH), Bench Maji Zone, South West Ethiopia. Annals of Reviews and Research, 1(4), 75–83. http://10.19080/ARR.2018.01.555566
- Meleko, A., Tesfaye, T., & Henok, A. (2018). Assessment of healthcare waste generation rate and its management system in health centers of bench Maji zone. Ethiopian Journal of Health Sciences, 28(2), 125–134. https://doi.org/https://doi.org/10.4314/ejhs.v28i2.4
- Mosquera, M., Andrés-Prado, M. J., Rodríguez-Caravaca, G., Latasa, P., & Mosquera, M. E. (2014). Evaluation of an education and training intervention to reduce health care waste in a tertiary hospital in Spain. American journal of infection control, 42(8), 894–897.
- Nkonge, A. N., Magambo, J. K., Mayabi, A. O., & Taratisio, N. (2014). Management of healthcare waste in national teaching and referral hospitals in Kenya. International Journal of Environment and Waste Management, 14(2), 199–209. https://doi.org/https://doi.org/10.1504/IJEWM.2014.064087
- Nuralam, H. M., Xiao-lan, Z., Dubey, B. K., & Wen-Chuan, D. (2017). Healthcare waste management practices in Bangladesh: A case study in Dhaka city, Bangladesh. International Journal of Environmental and Ecological Engineering, 11(6), 524–529. http://www.waset.org/Publication/10007352
- Olufunsho, A., Aishat, A. A., & Azuka, C. O. (2016). Assessment of medical waste management in seven hospitals in Lagos, Nigeria. BMC Public Health, 16(1), 1–11. https://doi.org/https://doi.org/10.1186/s12889-016-2916-1
- Pinto, V. N., Joshi, S. M., Velankar, D. H., Mankar, M. J., Bakshi, H., & Nalgundwar, A. (2014). A comparative study of knowledge and attitudes regarding biomedical waste (BMW) management with preliminary intervention in an academic hospital. International Journal of Medicine and Public Health, 4(1), 91–95. https://doi.org/https://doi.org/10.4103/2230-8598.127166
- Prüss-Üstün, A., Rapiti, E., & Hutin, Y. (2005). Estimating the global burden of disease attributable to contaminated sharps injuries among health care workers. American Journal of Industrial Hygiene, 48(6), 482–490. https://doi.org/https://doi.org/10.1002/ajim.20230
- Salkin, I. F. (2003). Conventional and alternative technologies for the treatment of infectious waste. Journal of Material Cycles and Waste Management, 5(1), 9–12. https://doi.org/https://doi.org/10.1007/s101630300002
- Sawalem, M., Selic, E., & Herbell, J.-D. (2009). Hospital waste management in Libya: A case study. Waste Management, 29(4), 1370–1375. https://doi.org/https://doi.org/10.1016/j.wasman.2008.08.028
- Suwannee, A. (2002). Study on waste from hospital and clinics Phitsanulok. Online Journal Health Allied Sciences, 1(3), 6–14. http://cogprints.ecs.soton.ac.uk/view/subjects/OJHAS.html
- Tadesse, M. L., & Kumie, A. (2014). Healthcare waste generation and management practice in government health centers of Addis Ababa, Ethiopia. BMC Public Health, 14(1221), 1–9. https://doi.org/https://doi.org/10.1186/1471-2458-14-1221
- Taghipour, H., Mohammadyarei, T., Jafarabadi, M. A., & Hashemi, A. A. (2014). On-site or off-site treatment of medical waste: A challenge. Journal of Environmental Health Science & Engineering, 12(1), 1–6. https://doi.org/https://doi.org/10.1186/2052-336X-12-68
- Tesfahun, E., Kumie, A., & Beyene, A. (2016). Developing models for the prediction of hospital healthcare waste generation rate. Waste Management & Research: The Journal for a Sustainable Circular Economy, 34(1), 75–80. https://doi.org/https://doi.org/10.1177/0734242X15607422
- Thakur, V., & Anbanandam, R. (2017). Management practices and modeling the seasonal variation in health care waste: A case study of Uttarakhand, India. Journal of Modelling in Management, 12(1), 162–174. https://doi.org/https://doi.org/10.1108/JM2-08-2015-0058
- Titto, E., Savino, A. A., & Townend, W. K. (2012). Healthcare waste management: The current issues in developing countries. Waste Management & Research: The Journal for a Sustainable Circular Economy, 30(6), 559–561. http://10.1177/0734242X12447999
- Townend, B., & Vallini, G Editorial. (2008). Healthcare waste management - the global paradox. Waste Management & Research: The Journal for a Sustainable Circular Economy, 26(3), 215–216. https://doi.org/https://doi.org/10.1177/0734242X080260031101
- Tsakona, M., Anagnostopoulou, E., & Gidarakos, E. (2007). Hospital waste management and toxicity evaluation: A case study. Waste Management, 27(7), 912–920. https://doi.org/https://doi.org/10.1016/j.wasman.2006.04.019 Epub 2006 Jul 26
- United States Environmental Protection Agency. (1997). Mercury study report to congress. Vol. 1, Executive summary [Internet]. 95 p. Retrieved May 17, 2016, from https://www3.epa.gov/ttn/caaa/t3/reports/volume1.pdf
- United States Environmental Protection Agency. (1998). Inventory of sources of dioxin in the United States (external review draft 1998). Washington D.C. Report No.: EPA/600/P-98/002Aa. p. 2–13.
- Williams, P. T. (2013). Waste treatment and disposal. John Wiley & Sons.
- Windfeld, E. S., & Brooks, M. S. L. (2015). Medical waste management–A review. Journal of environmental management, 163, 98–108.
- World Health Organization. (2015). Status of health-care waste management in selected countries of the Western Pacific Region 2008–2013.
- World Health Organization (WHO). (2011). Some basic information on healthcare wastes.
- World Health Organization (WHO). (2014). Safe management of wastes from health-care activities. Switzerland.
- Yazie, T. D., Tebeje, M. G., & Chufa, K. A. (2019). Healthcare waste management current status And potential challenges in Ethiopia: A systematic review. BMC Res Notes, 12(1), 1–7. https://doi.org/https://doi.org/10.1186/s13104-019-4316-y