 ?Mathematical formulae have been encoded as MathML and are displayed in this HTML version using MathJax in order to improve their display. Uncheck the box to turn MathJax off. This feature requires Javascript. Click on a formula to zoom.
ABSTRACT
Phosphorus (P) is critical for food production. However, it has been managed unsustainably for decades and geopolitical challenges complicate its availability. While accessible P-rock deposits are linearly exploited, excessive fertilization practices lead to P loss from land to water, and thus, eutrophication. The release of legacy P from sediments to the water column, i.e. internal P loading, sustains global eutrophication issues. Sediment removal and its subsequent reuse as soil amendment can simultaneously lower internal P loadings and create a new P resource. However, the plant bioavailability of sedimentary P, especially Fe-P, is rather controversial. In this study, the direct P fertilizer effect of fresh lake sediment, lake sediment after Fe-P removal, amorphous Fe-P, and the reduced Fe-P mineral vivianite on barley was investigated and compared to the conventional mineral P fertilizer triple superphosphate (TSP). Fresh sediment, amorphous Fe-P, and vivianite fertilization significantly increased biomass and P uptake compared to the 0-control, while the Fe-P removal from the sediment reduced both effects. The P use efficiency was generally lower than for TSP and decreased in the order amorphous Fe-P > fresh sediment > vivianite > sediment after Fe-P removal. In a parallel soil incubation without barley growth P diffusion from the tested alternative substrates was not observed. We conclude that fresh lake sediment has P fertilizer potential with amorphous Fe-P as a significant contributor. Further, fertilization with fresh sediment and Fe-P can increase soil adsorptive capacities potentially reducing leaching but also creating dependency of plant P bioavailability on plant-soil interactive mechanisms.
Graphical abstract

1. Introduction
The essential nutrient phosphorus (P) is a critical resource in the agricultural and food sector. However, it has been managed unsustainably for decades (Brownlie et al., Citation2021; Jupp et al., Citation2021; Mengel, Citation1997), including linear exploitation of the primary P rock resource in parallel to a great P loss from land to water bodies due to excessive fertilizer practices (Azam et al., Citation2019; Conley et al., Citation2009). Although P rock resource scarcity does not exist per se (U.S. Geological Survey, Citation2020), it remains a primary, non-renewable resource prone to price fluctuations (Cordell et al., Citation2009; Ibendahl, Citation2022; Scholz & Wellmer, Citation2021). Additionally, geopolitical challenges are complicating its availability, resulting in export bans and supply shortages (Cordell et al., Citation2009; Crespi et al., Citation2022; Ibendahl, Citation2022). Concurrently, excessive P accumulation in the aquatic environment is sustaining eutrophication issues globally (Azam et al., Citation2019; Conley et al., Citation2009; Cooke et al., Citation1972), and internal P loading, defined as the seasonal release of the legacy P pool in lake sediment to the water column during summer stratification (Reitzel et al., Citation2005; Sondergaard et al., Citation2001; Welch & Cooke, Citation2005), can be the main driver of reoccurring harmful algae blooms and subsequent hypoxia.
Sediment removal, i.e. dredging, effectively lowers internal P loading rates and its consequences (Cooke et al., Citation1972; Kiani et al., Citation2020; Van Wichelen et al., Citation2007). At the same time, dredged sediment from eutrophic lakebeds is increasingly considered for recycling practices in the agricultural sector. Several studies have confirmed the agronomic suitability of sediment and its capability to improve soil physicochemical properties (Braga et al., Citation2017, Citation2019; Canet et al., Citation2003; Fonseca et al., Citation2003; Kiani et al., Citation2021, Citation2023; Renella, Citation2021). Braga et al. (Citation2019) and Renella (Citation2021) especially encourage the recycling of P from sediments removed from eutrophic water bodies. They argue that the recycling of nutrient-rich sediment can lower the negative impact of agriculture by reducing the use of commercially available P fertilizers and thus lower the consumption of primary, non-renewable P rock. Additionally, Tammeorg et al. (Citation2023) call for more sustainable solutions for lake restoration, involving circular approaches for P recovery. However, detailed knowledge about the plant bioavailability of sedimentary P, specifically how speciation contributes, is lacking.
Fe-bound P (hereafter Fe-P) often constitutes a major P fraction in lake sediment, depending on environmental deposits and system inputs (Boers et al., Citation1992, Citation1998; Dittrich et al., Citation2013; O’Connell et al., Citation2015). In some cases, it can even make up > 50% of the total P (TP) pool (Gonsiorczyk et al., Citation1998). Meanwhile, redox-sensitive Fe-P can be the main source of seasonal internal P loading (Kiani et al., Citation2020; Kleeberg et al., Citation2013; Sondergaard et al., Citation2001). Depending on environmental conditions, Fe-P phases can occur in different oxidative states. It can be present as amorphous Fe(oxyhydr)oxides with high levels of impurities (Gunnars et al., Citation2002), but also as more crystalline phases, such as the reduced Fe-P mineral vivianite (O’Connell et al., Citation2015; Rothe et al., Citation2016). Studies of P availability from such phases have reported widely divergent results. For example, Kiani et al. (Citation2021) tested sediment as a soil amendment and found the Al/Fe-bound soil P phases to be the main contributor to P plant supply. In contrast, Laakso et al. (Citation2017) observed P immobilization in response to sediment addition to soil which they attributed to high Al/Fe(oxyhydr)oxide concentrations. Moreover, vivianite has frequently been mentioned to serve as a Fe rather than a P fertilizer (De Santiago et al., Citation2008; Díaz et al., Citation2010).
In this study, the P fertilizer effect of lake sediment with a focus on the role of Fe phosphates was investigated in a pot experiment with spring barley (Hordeum vulgare L.). Treatments included: 1) triple superphosphate (TSP; as reference), a conventional mineral P fertilizer; 2) fresh lake sediment; 3) fresh lake sediment without amorphous Fe-P (experimentally removed); 4) synthesized amorphous Fe-P; and 5) vivianite (magnetically extracted from sewage sludge). Soil P bioavailability was determined in a soil incubation series without crop growth as water-extractable P (WEP) and using the diffusive gradient in thin films technology (DGT). In parallel, a 1D soil column incubation study was performed without crop growth to explore P diffusion patterns from the alternative substrates.
2. Materials and methods
2.1. P fertilizer compounds
Triple superphosphate (TSP) was used as the reference mineral P fertilizer (commercially available). The water-soluble P fraction of TSP constitutes 40%–45% of total P (International Fertiliser Society, Citation2022). Fresh lake sediment was obtained from the eutrophic shallow Danish Lake Ormstrup (Bjerringbro, Denmark, 56°19’34.0”N 9°38’20.9”E). Circa 30 L surface sediment (approximately the upper 10 cm) was sampled from the deepest part of the lake (5.5 m) using a Kajak gravity core sampler (d = 9 cm) and the cores were pooled subsequently (September 2021). A 0.11 M bicarbonate-dithionite solution (BD; strong reductant) was used to extract the redox-sensitive, amorphous Fe-P pool from in total 2.36 kg of the fresh lake sediment (adapted from Reitzel et al., Citation2005; extraction results see SI, Figure A1). Stepwise, 2 g of fresh sediment were shaken in a 50 mL BD solution for 1 hour at 100 rpm, followed by centrifugation (3000 rcf, 10 min) and two additional extraction steps in BD and Milli-Q water. The sediment was separated from the extractant solution by centrifugation (3000 rcf, 10 min) and pooled for further use as a soil amendment. An amorphous Fe-P phase mimicking the removed sedimentary redox-sensitive Fe-P pool was synthesized in vitro. Sixty mL of Fe2(SO4)3 flocculant solution (Kemira PIX-113, Kemira) was gently added to 440 mL Milli-Q water under continuous stirring. The pH was adjusted to ~7 using 4 M NaOH. Five hundred mL 9 mM KH2PO4 solution was added, the mixture was gently shaken on a table shaker, and the precipitate left to settle overnight. The supernatant was carefully removed, and the remaining Fe-P slurry washed with 0.01 M KCl. Vivianite was available as a magnetically extracted slurry from a Dutch wastewater treatment plant (Wijdeveld et al., Citation2022). All P compounds were stored at 4°C until further use. A summary of the P compounds can be found in Table .
Table 1. Total P and Fe concentrations, molar Fe:P ratio, OM %, applied dosages and abbreviation of the tested P fertilization treatments. *P dosage in % of 30 kg P ha−1 year−1 (yearly maximum allowed P load according to the Danish Agricultural Agency)
2.2. Plant pot growth experiment
A controlled plant pot growth experiment was performed growing spring barley (Hordeum vulgare L., cv. ‘Flair’) under the following P fertilizer treatments: 1) conventional mineral P fertilizer TSP (TSP50/100/150); 2) fresh lake sediment (Sed100/150); 3) lake sediment without Fe-P (Sedno-FeP100/150); 4) synthesized amorphous Fe-P (FeP100/150); 5) vivianite extracted from sewage sludge (Viv100/150); and 6) no extra P addition (0-Control). For explanation of the treatment abbreviations please refer to Table . The applied P fertilization rates were calculated as percentages of the maximum allowed yearly P fertilizer load according to the Danish Agricultural Agency following the Aquatic Environment Scheme and fertilizer accounts, i.e. 50, 100, 150% of 30 kg P ha−1 ( = 19.67 mg P kg soil−1), based on the respective TP content of each P compound.
The experimental design was completely randomized in a one-by-six factorial matrix, with each treatment in replicates of five. Pots (1.4 L; 10 × 9.64 × 17 cm) were placed in 4 rows of 15, resulting in a spatial distribution of 39 pots per m2. LED lights were set at 290 ± 43 µmol m−2 s− 1 (16 hours day; 8 hours night). The ambient temperature was 23 ± 1–4°C. Phosphorus-depleted soil (440 mg P kg DW−1; Table ) was sieved <3 mm and mixed with filter-sand (Dansand® filter quartz sand nr. 1, 0.4–0.9 mm; 4.54 mg P and 251.04 mg Fe kg DW−1) to obtain a ‘diluted’ soil matrix with 20%wt sand. The final TP concentration in the soil/sand mix was 0.32 mg g DW−1 (<1 wt %).
Table 2. Parameters of the soil used for the plant growth and column diffusion experiment. Soil analyses were performed by a commercial laboratory (OK Laboratorium for Jordbrug, Viborg, Denmark, 2021) according to Sørensen and Bülow-Olsen (Citation1994)
Triple superphosphate granules were carefully ground using a mortar and pestle prior to their placement approximately 6 cm below the soil surface. The rest of the materials were mixed into 1465 g of the sand/soil mix homogeneously. The synthetic Fe-P and vivianite were suspended in 200 mL of Milli-Q before the soil amendment to ensure proper mixing. After the P fertilizer application, six barley seeds were placed in each pot, approximately 2 cm below the soil surface, and each pot was covered with transparent plastic. After full germination of the seeds 5 days after sowing (DAS), the plastic was removed, and the number of seedlings adjusted to three plants per pot to equalize spatial conditions among treatments.
Irrigation commenced at 8 DAS, and pots were rewatered to initial weight throughout the growth period. The irrigation frequency was adjusted as the plants grew, ranging from daily to every third day. At the same frequency, plants were rotated to equalize the effects of light exposure and temperature. Essential micro- and macronutrients (except for P) were supplied with irrigation water (standard fertilizer for wheat; SI Table B1). Ambient CO2 levels, temperature, and relative humidity in the plant growth room were monitored regularly (SI Figure C1). The growth-stage development of the barley and the number of fully developed leaves and tillers were documented every two to 4 days according to Zadoks’ decimal code (Zadoks et al., Citation1974). A parallel series of the above-described treatments was prepared (replicates of three, all at 100% P fertilizer rate) and incubated under the same conditions but without barley to estimate the direct P bioavailability in the soil matrix.
2.3. Barley harvest and analysis
Barley shoots and roots were harvested separately by hand at 56 DAS. The plants were cut just above the soil surface, and all leaves and stems from three individual plants were pooled per pot for further analysis. Roots were obtained by removing larger soil particles and subsequently washing carefully with demineralized water. Dry biomass of shoots and roots was measured after drying at 105°C for approximately 24 hours. After harvest, subsamples from the leftover soil were collected and stored at 4°C for further analysis (see Section 2.4). Dry shoot and root material was homogenized using a ball mill (Retsch MM 400; frequency 30 s−1, 2 min). Subsequently, total C and total N contents were measured chromatographically using an automatic elemental analyzer equipped with a thermal conductivity detector (TCD EA for IRMS; Flash 2000 series, Thermo Scientific). For further elemental analyses, 10 mL 65% HNO3 was added to 200 mg dry, homogenized plant material, and put in a high-pressure microwave digestion system (CEM with MarsXpress vessel; 400 W, 800 psi, 200°C, 15 min ramp, and 15 min hold time). Subsequently, total Fe, P, Ca, Mg, Mn, K, Cu, and Zn were measured in the digestate by inductively coupled plasma optical emission spectroscopy (ICP-OES; Optima 2100 DV, Perkin Elmer precisely). Cadmium content in the digestates was measured via atomic absorption spectroscopy (AAS; Shimadzu Atomic Absorption Spectrophotometer AA-7000). Phosphorus uptake by barley (mg P pot−1) was calculated as the product of the dry biomass yield (g DW pot−1) and the P content of barley shoots/roots (mg P g DW−1), respectively:
The apparent P use efficiency (PUE) was calculated as
where the upper term is the total P uptake (sum of uptake in shoots and roots) minus the P uptake by the 0-control plants (background contribution) divided by the amount of P added. Furthermore, the mineral P fertilizer replacement value (PFRV) was calculated as
2.4. Soil analysis
The physicochemical soil parameters pH and electrical conductivity (EC) were determined by adding 25 g of fresh soil to 60 mL 0.01 M CaCl2 (pH) and 60 mL Milli-Q (EC), respectively. The soil was mixed into the solution, left to equilibrate and settle overnight in the dark. Twenty mL of each supernatant were transferred into clean cups to measure pH (PHM210, MeterLab®) and EC (4510 Conductivity Meter, Jenway). The soil DW % was determined as loss of weight at 105°C and soil organic matter % (SOM %) as loss on ignition after 5 hours at 520°C. Two soil P extraction protocols were applied to assess the potential P availability to plants: water extractable P (WEP) (Kovar & Pierzynski, Citation2009; Sorn-Srivichai et al., Citation1988) and the diffusive gradient in thin films technology (DGT) (Research Ltd, Citation2013).
2.4.1. Water extractable soil P (WEP)
Water extractable soil P (WEP) was determined by adding 45 mL of milli-Q to fresh soil corresponding to 0.75 g dry weight (dry soil:water ratio = 1:60) depending on the DW % of the fresh soil. After shaking for 1 hour at 100 rpm on an end-over-end table shaker and centrifugation (3000 rcf, 10 min), the supernatant was filtered using a 0.45 µm membrane filter. The filtrate was preserved using 2 M H2SO4 and soluble reactive P (SRP) was measured spectrophotometrically on an automatic SAN++ flow analyzer using the standard method (Skalar Methods, orthophosphate, Catnr. 503-010w/r issue 011817/99315640).
2.4.2. Diffusive gradient in thin films (DGT)
Approximately 60 g air-dried soil (<2 mm) was added Milli-Q until 100% of the soil water-holding capacity (WHC; 34%w:w) was reached and left to equilibrate for 24 hours at room temperature. Chelex-Metsorb DGT capsules were deployed at the soil surface, fully immersed, and incubated at room temperature for approximately 24 hours. The capsules were retrieved from the soil and the binding gel layer was removed, washed with Milli-Q, and placed in one mL 1 M NaOH for 24 hours to elute P. Soluble reactive P in the eluent was measured via the molybdenum blue method (Koroleff, Citation1983) using a microplate reader.
2.5. 1D soil column P diffusion experiment
Approximately 5.5 kg air-dried sand (20%w/w) soil mix (<2 mm) was rewetted using Milli-Q to reach a water content (WC %) equal to 50% of the soil WHC and left to equilibrate for approximately 24 hours. The wetted soil was packed in plastic columns (h = 1.8 cm, d = 5.9 cm) with a soil bulk density of 1.4 g cm−3. Two plastic columns were mounted on top of each other, separated by a substrate layer (h = 2 mm, d = 5.9 cm). A standard row consisting of 0%, 50%, 100%, and 150% of the maximum allowed yearly P load was prepared using TSP for P supply and to compare the P diffusion from fresh sediment, sediment without redox-sensitive Fe-P, the synthesized amorphous Fe-P, and vivianite at a 100% P fertilization rate (each in replicates of five). The respective amount of substrate was mixed with the soil/sand mixture and packed in the substrate layer until it reached the same bulk density as the soil columns (1.4 g cm−3). A filter mesh was placed between the substrate layer and the soil columns to minimize leakage and mixing of materials. The columns with the substrate layer were incubated in a vertical position for 3 weeks under the same climatic conditions used during the plant growth experiment. The columns were covered with a wet towel to minimize evaporation. The column weight was checked weekly to monitor the WC % and, if necessary, corrected to the initial weight by adding Milli-Q. After incubation, the soil columns were sliced in 1-mm intervals up to 12 mm from the substrate layer using a barrow piston soil slicer and a fine carpet knife. The layers from each side of the substrate were pooled per mm step for further analysis. The final WC % of the soil and substrate layer was determined as loss of weight after 24 hours at 105°C, and WEP was determined as mentioned in section 2.4.1. The WC % in the soil layers as a function of distance from the substrate was used to ensure that the observed soil P diffusion patterns did not result from water movement but were a result of diffusive forces only (SI, Figure D1).
2.6. Statistical analysis
Data from the various treatments were compared using a one-way ANOVA test combined with a Tukey HSD post hoc test for multiple comparisons using Rstudio 2022.02.3 + 492. In case of violation of normality or equal variances, a Kruskal–Walli’s rank sum test with a Bonferroni-corrected Dunn test for multiple comparisons was performed. The coefficient of determination (R2) was determined via simple linear regression using excel.
3. Results
3.1. Growth stage evaluation after Zadoks’ code: Leaf and tiller development
The first three growth stages (GS) typical for barley seedling growth (GS1), tillering (GS2), and stem elongation (GS3), were reached in all treatments. On the harvest day (56 DAS), all plants had reached GS33 (third node detectable). Individual plants had reached a higher stage (GS37, flag leaf just visible) or the booting developmental phase (GS41, flag leaf sheath extending). However, these observations were weakly associated with any specific treatment.
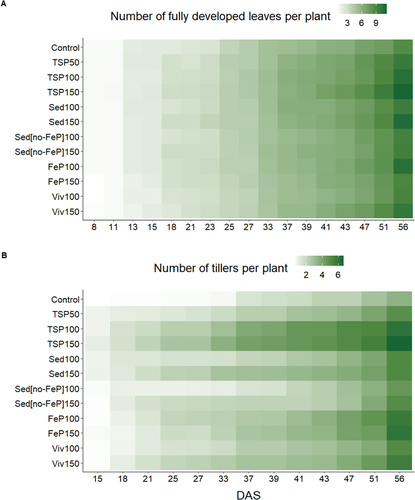
From 18 DAS onwards, leaf and tiller development commenced later for all treatments at a 100% P supply level compared to 150%, except for amorphous Fe-P fertilization, where an opposite trend was observed from 20 DAS onwards (Figure ). Sed150, FeP100, and Viv150 treatments reached a final leaf number comparable to TSP100 fertilized plants. Sed100 fertilized plants reached final leaf numbers comparable to TSP50 fertilized plants, while both Sedno-FeP100 and Sedno-FeP150 fertilized plants yielded final leaf numbers comparable to those in the 0-Control group. FeP150 and Viv150 fertilized plants showed the fastest tiller development and highest final tiller numbers comparable to TSP100 effects. Sed100, Sed150, FeP100, and Viv100 fertilized plants showed a tiller development comparable to TSP50. Tiller numbers for Sedno-FeP100 and Sedno-FeP150 fertilized plants were comparable to the 0-Control and TSP50 fertilized plants, respectively.
Figure 1. Growth stage evaluation after Zadoks’ decimal code (Zadoks et al., Citation1974). The number of fully unfolded leaves (A) and developed tillers (B) per plant was averaged per pot and plotted over time. Color intensity increases with leave and tiller number.
3.2. Biomass yield of barley
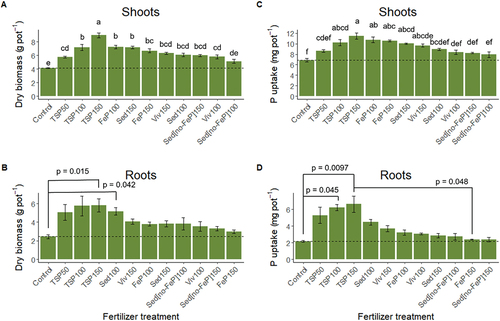
All treatments yielded significantly higher shoot dry biomass (Figure ) compared to the 0-Control (one-way ANOVA, F = 20.80, d.f. = 11 and 44, p < 0.05, adjusted R2 = 0.798), except for Sedno-FeP100 fertilized plants (p = 0.292). Furthermore, all biomass yield effects in response to the alternative P fertilizer substrates were significantly lower than TSP150 but not significantly different from TSP100, except for Viv100 and Sedno-FeP100 treatments, which were significantly lower and at the same level as TSP50. Only FeP100 (p = 0.019) and Sed150 (p = 0.025) fertilization resulted in a biomass yield significantly higher than TSP50. The increase in dosage from 100% to 150% of the maximum allowed P supply did not cause a significant increase of biomass yields for none of the tested alternative substrates. Root dry biomass (Figure ) was only significantly increased compared to the 0-Control after Sed100 (p = 0.042) and TSP150 (p = 0.015) fertilization (Kruskal–Wallis rank sum test, chi-squared = 28.32, d.f. = 11). All other treatments yielded biomass values below TSP50, but not significantly different.
Figure 2. Dry biomass yield and P uptake by barley shoots (A, C) and roots (B, D) in response to the alternative P fertilizer treatments. Treatments with the same letter are not significantly different. The dosage levels 50, 100, and 150 correspond to 50, 100, and 150 % of the Danish maximum yearly P load of 30 kg ha−1. Mean ± SE, n = 5.
3.3. P uptake by barley
The P uptake by barley shoots (Figure ) was significantly higher than the 0-Control in response to the FeP100 (p < 0.001), FeP150 (p < 0.001), Sed150 (p < 0.001), and Viv150 (0.002) treatments (one-way ANOVA, F = 10.61, d.f. = 11 and 40, adjusted R2 = 0.675). Additionally, there was no significant difference of these treatments to TSP100 and TSP150. FeP100 and FeP150 resulted in the highest P uptake among the alternative P fertilization treatments, followed by Sed150 and Viv150. Phosphorus uptake rates in response to Sed100, Viv100, Sedno-FeP150 were not significantly different to TSP50 and TSP100 effects. Sedno-FeP100 P uptake rates were significantly lower than TSP100 (p = 0.020). Phosphorus uptake by barley roots (Figure ) did not differ significantly between the 0-Control and treatments, except for a significant increase after TSP100 (p = 0.045) and TSP150 (p = 0.010) fertilization (Kruskal–Wallis rank sum test, chi-squared = 36.85, d.f. = 11). Among the alternative P fertilization treatments, the highest P uptake by barley roots was found for Sed100, the lowest in response to FeP150 and Sedno-FeP150 fertilization.
3.4. Nutrient and heavy metal concentrations in barley shoots
A summary of the final nutrient and (heavy) metal contents in the barley shoots can be found in Table (and SI Table E1). The final P concentration did not differ significantly from the 0-Control as well as among treatments (one-way ANOVA, F = 1.75, d.f. = 11 and 41, p = 0.096, adjusted R2 = 0.137). Total Fe levels were generally lower for all treatments than the 0-Control but not significantly, except for TSP100 (p = 0.041) and TSP150 (p = 0.006) (Kruskal–Wallis rank, chi-squared = 25.20, d.f. = 11). Copper contents of the barley leaves were generally lower and significantly decreased compared to the 0-Control after the TSP100 (p < 0.001), TSP150 (p < 0.001), Sed150 (0.015), FeP150 (0.008), and Viv150 (p < 0.001) treatment (one-way ANOVA, F = 16.37, d.f. = 11 and 39). Cadmium concentrations in barley shoots were lower than in the 0-Control after any treatment but not significantly, except for after FeP100 fertilization (Kruskal–Wallis rank sum test, chi-squared = 32.48, d.f. = 11, p = 0.045). Zinc concentrations in the barley shoots were not significantly different from the 0-Control plants after Sed100 and Sed150 fertilization, while the Sedno-FeP100 and Sedno-FeP150 treatments resulted in a significant increase and the rest of the treatments in significant decrease (one-way ANOVA, F = 156.5, d.f. = 11 and 42, p < 0.001). Total C content of the barley shoots was significantly increased compared to the 0-Control in response to FeP100 (p = 0.002), FeP150 (p = 0.017), Viv100 (p = 0.045), and Viv150 (p = 0.005) fertilization (Kruskal–Wallis rank sum test, chi-squared = 42.55, d.f. = 11). Also, all four sediment treatments caused a slight increase but not significantly. Total N contents were significantly increased compared to the 0-Control after Sed100 (p = 0.047) and FeP150 (0.011) fertilization (one-way ANOVA, F = 8.51, d.f. = 11 and 44).
Table 3. Final total P, Fe, Cu, Cd, and Zn content in the barley shoots (mg g DW−1) and total C and N (weight %). For total K, Mg, Mn, and Ca content of barley shoots see supplementary material (SI Table E1). Mean ± SE, n = 5. Values with the same footnote letter are not significantly different (one-way ANOVA). Star signs: * p = 0.045, ** p = 0.036, (*) p = 0.017, *** p = 0.005, (***) p = 0.002 (Kruskal–Wallis test)
3.5. Soil EC, pH, OM %
The change of the physico-chemical parameters EC, pH, and SOM % in the bulk soil after 56 days of incubation with and without barley growth is summarized in Table . Generally, EC values were lower in the soil with barley growth compared to without. In the soil without barley, EC was significantly decreased compared to the 0-Control in response to the FeP100 (p = 0.005) and Viv100 (p = 0.009) treatments (one-way ANOVA, F = 8.815, d.f. = 5 and 12). No significant differences were found for soil pH with or without barley. However, soil pH values were generally higher (>7) for all treatments in the soil after barley growth compared to the soil without, except forSedno-FeP100 and Sedno-FeP150 treated soils (<7). Soil OM % was significantly increased after all sediment fertilization treatments compared to the 0-Control with (one-way ANOVA, F = 118.22, d.f. = 12 and 43, R2 = 0.962) and without barley growth (one-way ANOVA, F = 6.78, d.f. = 5 and 12, R2 = 0.629). The largest increase in SOM % was found for the Sedno-FeP150 treatment (with barley), which was also the largest amount of fresh sediment applied.
3.6. Soil bioavailable P without barley growth
Soil WEP and DGT SRP-flux (Table ) were only determined at a 100% P supply level in the soil without barley growth since it can be greatly influenced by plant growth. Soil WEP was significantly increased after FeP100 (p < 0.001) compared to the 0-Control (one-way ANOVA, F = 14.11, d.f. = 5 and 12, R2 = 0.794). The Sed100 fertilization resulted in the lowest soil WEP followed by the Sedno-FeP100 treatment but not significantly different. In contrast, the measured DGT SRP-flux was highest from the Sedno-FeP100 and lowest from the FeP100 treated soil, but no significant differences were observed.
Table 4. Soil EC, pH, OM %, water extractable P (WEP), and DGT SRP-flux in the soil with and without barley at 56 DAS (harvest day). Mean ± SE. Treatments with the same letter are not significantly different
3.7. Phosphorus diffusion from the substrates in a 1D soil column
The results from the 1D soil column incubation study are presented in Figure . Phosphorus diffusion was not observed from any of the alternative P compounds except for FeP100, which showed a slight increase of soil WEP (5.5 µg g DW−1) compared to the control columns (3.9 µg g DW−1) at 1 mm distance from the substrate. However, the WC % at this distance was slightly increased (SI, Figure D1), indicating P transport’s involvement in water movement in addition to P diffusion. The average soil WEP over the whole distance in the soil columns containing Sedno-FeP100 (3.0 µg g DW−1) and Viv100 (3.1 µg g DW−1) as substrate was significantly lower than the 0-Control (4.1 µg g DW−1) (Kruskal–Wallis rank sum test, chi-squared = 243.07, d.f. = 7, p < 0.001). The average soil WEP in the columns with Sed100 (4.1 µg g DW−1) and FeP100 (3.7 µg g DW−1) did not differ significantly from the 0-Control.
Figure 3. Phosphorus diffusion patterns from the tested substrates presented as soil WEP concentration as a function of distance from the substrate. Mean ± SE, n = 5.
4. Discussion
This study shows that P fertilization with dredged lake sediment, amorphous Fe-P, and vivianite significantly increased the biomass yield and P uptake rates by barley. In addition, our results indicate that sediment and other Fe-P containing substrates improve P fixation in the soils potentially preventing P leaching to the aquatic environment and at the same time provide an accessible P fertilizer that can be utilized by the crops.
4.1. Phosphorus fertilizer effect on barley growth
Fertilization with fresh lake sediment, amorphous Fe-P, and vivianite significantly increased the shoot biomass yield and had an overall positive effect on P uptake rates by barley, while the removal of the redox-sensitive Fe-P pool from sediment reduced these effects. The P use efficiency (PUE) was highest for TSP50 fertilization (33.7%) and showed a decreasing trend with increasing TSP dosage (25.5% and 20.9% for TSP100 and TSP150, respectively). Among the alternative P fertilization treatments FeP100 and Sed100 resulted in the highest PUE (17.1% and 15.1%, respectively). All the other treatments resulted in a PUE < 10% at 100% and 150% P supply levels. The PFRV was FeP100 (67.0%) > Sed100 (59.0%) > Viv100 (32.5%) > Sedno-FeP100 (21.5%), and Viv150 (47.2%) > FeP150 (42.0%) > Sed150 (41.8%) > Sedno-FeP150 (17.1%).
However, the final P content in all treatments (~1.5 mg g DW−1) was at the lower range of what is typically found in the literature during the vegetative growth phase of barley (1.5 to 3 mg g DW−1) (Mühlbachová et al., Citation2018). Further, biomass allocation, i.e. favored shoot over root growth, as well as lower P uptake by barley roots compared to shoots was observed. Simultaneously, the overall growth-stage development of barley was not affected by any of the alternative P fertilizer treatments tested in this study. These findings indicate that the easily accessible plant available P pool in the rhizosphere was exhausted for all treatments (including TSP) by the end of the growth experiment and maximum P supply capacities were reached. Most of the available or immobilized P must have been allocated to later, P-dependent growth stages such as tillering and stem elongation. While leave development showed common patterns (approximately one leaf every four to 5 days up to 9 leaves), delays in tiller development were observed. Prystupa et al. (Citation2003) found that P deficiency markedly delayed tillering in response to nutritional stress, with P effects considerably greater than N, emphasizing the modulating role of P during this crop developmental stage. In our study, the removal of the redox-sensitive Fe-P pool from the sediment caused a stronger delay of the tiller development than fertilization with fresh sediment, the amorphous Fe-P, and vivianite.
Concurrently, fertilization with sediment after amorphous Fe-P removal yielded the lowest shoot and root biomass. Likewise, Kiani et al. (Citation2021) found significantly lower root biomass in their sediment fertilization treatments. It indicates that in the Fe-P depleted sediment matrix P was not readily available and changes in root architecture where necessary for the plant to better mine available P sources in the soil. Nutrient, and thus P availability, has a great influence on root growth and architecture. For example, López-Bucio et al. (Citation2003) describe the formation of proteoid roots by white lupin (Lupinus albus L.) in response to P deficiency. Proteoid roots form clusters of closely spaced short lateral rootlets, and thus take up less space but have higher P uptake capacity due to an increased absorptive surface and enhanced exudate production. Although spatial and architectural root differences were visible between the treatments (SI, Figure F1), a detailed investigation of root growth was beyond the scope of this study. Nevertheless, validating these findings deserves further attention and could be insightful to determine and specify underlying plant–soil interactions necessary to increase P bioavailability from the tested compounds.
4.2. Dependency of P bioavailability on soil–plant interactions
Phosphorus diffusion in a 1D soil column without plants was not observed for any of the tested alternative P substrates, except for a minor but significant P release within a 1 mm distance in the amorphous FeP100 treatment. The data indicate that P release from the treatments with lake sediment, amorphous Fe-P, and vivianite, is a process dependent on external influences, i.e. soil–plant interactions in the rhizosphere. An essential P fixation process in soil is based on soil particle adsorption mediated by ligand exchange of surface OH− from, e.g. Fe oxides with phosphate (Mengel, Citation1997). Such chemi-adsorption processes are highly dependent on soil pH. Due to a reversible reaction sequence, P desorption from soil particles or Fe-oxides is driven by increased H+. Root-exudation of acidifying compounds might be a crucial factor driving P bioavailability from sediments and Fe-P minerals, making these a valuable but dependent source for P recycling. Root-exudation is a well-known mechanism through which plants ensure nutrient supply to the root zone, often through interaction with microorganisms (Dakora & Phillips, Citation2002). Root-exuded organic acids such as citrate, oxalate, and malate can solubilize otherwise unavailable soil Ca, Fe, and Al phosphates via rhizosphere acidification or chelation of Fe and Al (Dakora & Phillips, Citation2002; Neina, Citation2019; Talboys et al., Citation2016). For instance, Gypser and Freese (Citation2020) and Yang et al. (Citation2022) reported enhanced P release from vivianite and hydroxyapatite induced by organic substituents, such as citric and humic acid. Similarly, Talboys et al. (Citation2016) report increased dissolution of the relatively stable mineral struvite in the presence of root exudates. However, analysis of such underlying molecular soil processes was not within the scope of this study. Changes in soil physicochemical parameters, such as pH, could help for further interpretation. The soil pH was decreased in response to no P addition (0-Control), Sedno-FeP100, and Sedno-FeP150 fertilization in comparison to the other treatments after barley growth, which can hint towards higher root-exudation activity of the barley to mine the P pool. However, differences in soil pH can be rather local and restricted to the rhizosphere and might not have been recognized with the bulk soil measurements as performed in this study. Hence, further investigation of underlying molecular processes is required to better understand the P release mechanisms.
4.3. The role of Fe(oxyhydr)oxides for nutrient and metal availability
Interestingly, the addition of fresh sediment to the soil lowered soil WEP, despite the evident P fertilizer effect. Concurrently, soil WEP was significantly increased after adding FeP100 as the only treatment. In contrast, the DGT-SRP flux was lowest from soil incubated with amorphous Fe-P but highest for Sedno-FeP100. Since the DGT flux is an estimate for porewater concentrations, exchangeable P might have been underestimated with this technology. There might be relatively more porewater P abundant but not necessarily more readily available to the plants. It is likely that the lack of metal oxides in the sediment with Fe-P removed leads to a loss of P adsorptive capacity and might cause an overestimation of the P availability using the DGT-SRP flux. Soil WEP, however, estimates both porewater and loosely adsorbed P forms. Accordingly, a stronger correlation of P uptake rates was found with soil WEP (R2 = 0.5) compared to measured DGT-SRP fluxes (R2 = 0.2). At the same time, the final Fe concentrations in the barley shoots were higher than the 0-Control, in treatments with sediment, amorphous Fe-P, and vivianite, which indicates the release of redox-sensitive Fe in parallel to P provision.
The redox-sensitive Fe-P might explain the double function of sediment, since it is known to influence P dynamics in freshwater systems as both an important sink and source for P (Boers et al., Citation1998). The relation between P-binding capacity and P release from sediment is a relatively dynamic process and dependent on sediment composition and surrounding environmental factors (Boers et al., Citation1998; Dittrich et al., Citation2013; Gächter & Müller, Citation2003), especially with regard to redox-sensitive Fe-P (Kleeberg et al., Citation2013). Interestingly, the application of Fe-P at 150% was less efficient than Fe-P applied at a 100% rate. Similarly, an excessive amount of Fe-oxides has a reverse effect on the availability of essential macro- and micronutrients through an increase of adsorptive capacity, as well as via the introduction of binding sites specific for P. Likewise, Laakso et al. (Citation2017) observed reduced P bioavailability due to Fe saturation of the soil mediated by sediment addition. Hence, the bioavailability of Fe-phosphates might be dependent on the abundant Fe/P molar ratio.
Thus, considering its double function and dependency on soil–plant interactions, the use of Fe phosphates as sole P sources might introduce a higher risk of nutrient deficiency during the early seedling stage, when nutrient demand is high, and the root system has not yet been developed. For instance, during our experiment, early seedling growth of barley under Fe-P and vivianite fertilization was slower than with the other treatments. To overcome such P shortages during early growth stages, Hertzberger et al. (Citation2021) suggest blending highly water-soluble P fertilizers with the less readily available mineral compounds, arguing that fertilizer activities could then become more efficient by decreasing the amount of conventional mineral P fertilizer needed and lowering the risk of leaching events, which are very common in response to application of conventional fertilizers with a high water-soluble fraction. Hence, application of sediment relatively rich in amorphous Fe-P or vivianite could potentially function as slow-release fertilizers and lower the risk of leaching, and subsequently nonpoint pollution of the aquatic environment through agricultural run-off, via the introduction of adsorptive binding sites.
Sediment recycling in the agricultural sector has been mentioned several times as a means to provide an extensive range of co-benefits besides nutrient provision (Braga et al., Citation2017, Citation2019; Kiani et al., Citation2021, Citation2023; Renella, Citation2021). It has been stated that the addition of sediment to soil can improve physicochemical properties, such as cation exchange capacities (CEC), soil structure, as well as sorption properties and nutrient contents. Soil EC can be used as an indicator for the number of dissolved ions, and thus also the availability of nutrients in the soil. Soil EC increased with the amount of sediment added which can be associated to the addition of negatively charged clay and silt particles, as well as organic matter, and thus, an increased soil CEC. The higher the CEC, the more cations can be held, and leaching events are reduced. On the contrary, the addition of the Fe-P and vivianite materials both decreased soil EC. These data indicate that adsorptive capacity and nutrient retention is more efficient in a mixed sediment matrix and that sediment as fertilizer might carry the capability to lower the risk of leaching of nutrients from the root zone into the environment. Such effects require further investigations to optimize fertilizer composition and practices in the form of Fe-rich sediment.
Additionally, the introduction of amorphous Fe-P seemed to influence heavy metal dynamics between soil and plant. Although the Cd concentration in the sediment itself (1.05 ± 0.60 mg kg DW−1) was slightly above the maximum allowed threshold value for land application (0.8 mg kg DW−1), the Cd concentration in the barley shoots after fresh sediment application was lower than in the plants fertilized with TSP, indicating that the excessive Cd in the sediment was not taken up by the barley. This was, however, not the case after fertilization with the Fe-P depleted sediment. At the same time, the removal of amorphous Fe-P from the sediment resulted in significantly higher Zn barley shoot concentrations. It supports the assumption that the redox-sensitive phases, such as Fe-oxides, in the sediment can play a crucial role for adsorption/complexation capacities. Depending on its origin and inputs, freshwater sediment can be contaminated with heavy metals, typically Cd, Cu, or Zn, or other toxic organic and inorganic substances (Ayadi et al., Citation2015; Li et al., Citation2009). Plants can take up such toxic elements via bioaccumulation; therefore, their introduction into the food chain is of great concern (e.g. Robinson et al., Citation2006). According to Li et al. (Citation2009), the main contributors to controlling heavy metal cycling in (polluted) surface sediments are Fe, Mn oxides, and OM, depending on the heavy metal speciation. They found Mn-oxides to be most important for Cu and Zn adsorption. It is likely that sediment facilitates the immobilization of Cd and Zn in the soil matrix by introducing a substantial fraction of metal oxides. Additionally, the SOM % in our study increased with the amount of fresh sediment added, regardless with or without redox-sensitive Fe-P in the matrix. Hence, sediment can provide organic matter, which increases overall soil fertility (Mengel, Citation1997) but also introduces additional functional carboxylic acid groups and phenols, which might also have an impact on the soil’s CEC and surface adsorption processes. Excessive humic substances can also have an inverse effect on the adosprtive capacity of soils and sediments acting as chelating agents for heavy metals but also Fe/Mn oxides which could serve as possible binding sites for heavy metals. Thus, it can either increase or decrease bioavailability of heavy metals (Bianchi et al., Citation2008; Pittarello et al., Citation2019). However, the assessment of heavy metal bioavailability and leaching from sediment was beyond the scope of this study but certainly, further investigation of this issue is warranted, especially if the final stage is sediment recycling in the agricultural sector.
5. Conclusion
Fresh lake sediment, amorphous Fe-P, and vivianite fertilization contributed to the growth and P uptake of barley. The removal of the amorphous Fe-P pool from the sediment led to lower biomass and P uptake levels and a delay in the P-dependent tiller development. Further, mixing amorphous Fe-P and vivianite into the soil increased soil WEP, and the amorphous Fe-P showed potential for P soil diffusion, while the addition of sediment did not. Thus, Fe-phosphates seem to be an important contributor to P supply from fresh lake sediment. However, the P release from fresh lake sediment and associated Fe-phosphates is likely dependent on plant–soil interactions in the rhizosphere, causing physicochemical changes and subsequently facilitating the release of bioavailable P for barley. High abundancy of Fe(oxyhydr)oxides, and thus, excessive adsorptive capacity, can have a reverse effect on P bioavailability and should be considered when evaluating the P fertilizer suitability. However, it can also help to retain nutrients and (heavy) metals in the soil and rhizosphere, and potentially counteract run-off to the aquatic environment.
Supplementary material_Sediment P recycling.docx
Download MS Word (4.4 MB)Acknowledgements
This study was jointly funded by the Poul Due Jensen Fond (Grundfos Foundation) [2020-068]. The authors would like to thank Carina Kronborg Lohmann, Rikke Orloff Holm, Birthe Christensen, and Janus Tem Jensen, the superb technicians of the Ecology lab at the University of Southern Denmark, for their technical support and sample measurements. Further, we would like to thank Thomas Prot and Leon Korving from the Wetsus European Center of Excellence for Sustainable Water Technology for the provision of the vivianite material and their comments on the first manuscript version.
Disclosure statement
No potential conflict of interest was reported by the author(s).
Data availability statement
The data that support the findings of this study are available from the corresponding author, S. Haasler, upon reasonable request.
Supplementary material
Supplemental data for this article can be accessed online at https://doi.org/10.1080/27658511.2024.2362503
Additional information
Funding
References
- Ayadi, N., Aloulou, F., & Bouzid, J. (2015). Assessment of contaminated sediment by phosphate fertilizer industrial waste using pollution indices and statistical techniques in the Gulf of Gabes (Tunisia). Arabian Journal of Geosciences, 8(3), 1755–14. https://doi.org/10.1007/s12517-014-1291-4
- Azam, H. M., Alam, S. T., Hasan, M., Yameogo, D. D. S., Kannan, A. D., Rahman, A., & Kwon, M. J. (2019). Phosphorous in the environment: Characteristics with distribution and effects, removal mechanisms, treatment technologies, and factors affecting recovery as minerals in natural and engineered systems. Environmental Science and Pollution Research, 26(20), 20183–20207. https://doi.org/10.1007/s11356-019-04732-y
- Bianchi, V., Masciandaro, G., Giraldi, D., Ceccanti, B., & Iannelli, R. (2008). Enhanced heavy metal phytoextraction from marine dredged sediments comparing conventional chelating agents (citric acid and EDTA) with humic substances. Water, Air, and Soil Pollution, 193(1–4), 323–333. https://doi.org/10.1007/s11270-008-9693-0
- Boers, P., Van der Does, J., Quaak, M., Van der Vlugt, J., & Walker, P. (1992). Fixation of phosphorus in lake sediments using iron(III)chloride: Experiences, expectations. In Restoration and recovery of shallow Eutrophic Lake ecosystems in the Netherlands (Vol. 233, pp. 211–212). Springer Netherlands. https://doi.org/10.1007/978-94-011-2432-4_19
- Boers, P. C. M., Van Raaphorst, W., & Van Der Molen, D. T. (1998). Phosphorus retention in sediments. Water Science and Technology, 37(3), 31–39. https://doi.org/10.2166/wst.1998.0169
- Braga, B. B., de Carvalho, T. R. A., Brosinsky, A., Foerster, S., & Medeiros, P. H. A. (2019). From waste to resource: Cost-benefit analysis of reservoir sediment reuse for soil fertilization in a semiarid catchment. Science of the Total Environment, 670, 158–169. https://doi.org/10.1016/j.scitotenv.2019.03.083
- Braga, B. B., Junior, F. H. N., Barbosa, R. M., Brito, P. O. B. D., Martins, K., Medeiros, P. H. A., & Gondim, F. A. (2017). Biomass production and antioxidative enzyme activities of sunflower plants growing in substrates containing sediment from a tropical reservoir. Journal of Agricultural Science, 9(5), 95. https://doi.org/10.5539/jas.v9n5p95
- Brownlie, W. J., Sutton, M. A., Reay, D. S., Heal, K. V., Hermann, L., Kabbe, C., & Spears, B. M. (2021). Global actions for a sustainable phosphorus future. Nature Food, 2(2), 71–74. https://doi.org/10.1038/s43016-021-00232-w
- Canet, R., Chaves, C., Pomares, F., & Albiach, R. (2003). Agricultural use of sediments from the Albufera Lake (eastern Spain). Agriculture, Ecosystems and Environment, 95(1), 29–36. https://doi.org/10.1016/S0167-8809(02)00171-8
- Conley, D. J., Paerl, H. W., Howarth, R. W., Boesch, D. F., Seitzinger, S. P., Havens, K. E., Lancelot, C., & Likens, G. E. (2009). Controlling eutrophication: Nitrogen and phosphorus. Science, 323(5917), 1014–1015. https://doi.org/10.1126/science.1167755
- Cooke, G. D., Welch, E. B., Peterson, S. A., & Nichols, S. A. (1972). Restoration and management of lakes and reservoirs. In Taylor & Francis (third, vol. 4, issue 3). https://doi.org/10.1016/0006-3207(72)90195-4
- Cordell, D., Drangert, J. O., & White, S. (2009). The story of phosphorus: Global food security and food for thought. Global Environmental Change, 19(2), 292–305. https://doi.org/10.1016/j.gloenvcha.2008.10.009
- Crespi, J. M., Hart, C., Pudenz, C. C., Schulz, L. L., Wongpiyabovorn, O., Zhang, W., & Student, P. (2022). An examination of recent fertilizer price changes. June, 58. https://doi.org/10.13140/RG.2.2.24806.70720
- Dakora, F. D., & Phillips, D. A. (2002). Root exudates as mediators of mineral acquisition in low-nutrient environments. Plant and Soil, 245(1), 35–47. https://doi.org/10.1023/A:1020809400075
- De Santiago, A., Quintero, J. M., Carmona, E., & Delgado, A. (2008). Humic substances increase the effectiveness of iron sulfate and vivianite preventing iron chlorosis in white lupin. Biology and Fertility of Soils, 44(6), 875–883. https://doi.org/10.1007/s00374-008-0272-8
- Díaz, I., Barrón, V., Del Campillo, M. C., & Torrent, J. (2010). Testing the ability of vivianite to prevent iron deficiency in pot-grown grapevine. Scientia Horticulturae, 123(4), 464–468. https://doi.org/10.1016/j.scienta.2009.11.006
- Dittrich, M., Chesnyuk, A., Gudimov, A., McCulloch, J., Quazi, S., Young, J., Winter, J., Stainsby, E., & Arhonditsis, G. (2013). Phosphorus retention in a mesotrophic lake under transient loading conditions: Insights from a sediment phosphorus binding form study. Water Research, 47(3), 1433–1447. https://doi.org/10.1016/j.watres.2012.12.006
- Fonseca, R. M. F., Barriga, F., & Fyfe, W. S. (2003). Dam reservoir sediments as fertilizers and artificial soils. Case studies from Portugal and Brazil. Proceedings, International Symposium of the Kanazawa University 22st-Century COE Program (Vol. 1, pp. 55–62). Kanawaza University.
- Gächter, R., & Müller, B. (2003). Why the phosphorus retention of lakes does not necessarily depend on the oxygen supply to their sediment surface. Limnology and Oceanography, 48(2), 929–933. https://doi.org/10.4319/lo.2003.48.2.0929
- Gonsiorczyk, T., Casper, P., & Koschel, R. (1998). Phosphorus-binding forms in the sediment of an oligotrophic and an eutrophic hardwater lake of the Baltic lake District (Germany). Water Science and Technology, 37(3), 51–58. https://doi.org/10.2166/wst.1998.0173
- Gunnars, A., Blomqvist, S., Johansson, P., & Andersson, C. (2002). Formation of Fe(III) oxyhydroxide colloids in freshwater and brackish seawater, with incorporation of phosphate and calcium. Geochimica et Cosmochimica Acta, 66(5), 745–758. https://doi.org/10.1016/S0016-7037(01)00818-3
- Gypser, S., & Freese, D. (2020). Phosphorus release from vivianite and hydroxyapatite by organic and inorganic compounds. Pedosphere, 30(2), 190–200. https://doi.org/10.1016/S1002-0160(20)60004-2
- Hertzberger, A. J., Cusick, R. D., & Margenot, A. J. (2021). Maize and soybean response to phosphorus fertilization with blends of struvite and monoammonium phosphate. Plant and Soil, 461(1–2), 547–563. https://doi.org/10.1007/s11104-021-04830-2
- Ibendahl, G. (2022). The Russia-Ukraine conflict and the effect on fertilizer Kansas. State University – Department of Agricultural Economics. 1–12.
- International Fertiliser Society. (2022). Triple Superphosphate (TSP). https://fertechinform.org/knowledgebase/triple-superphosphate-tsp/
- Jupp, A. R., Beijer, S., Narain, G. C., Schipper, W., & Slootweg, J. C. (2021). Phosphorus recovery and recycling – closing the loop. Chemical Society Reviews, 50(1), 87. https://doi.org/10.1039/d0cs01150a
- Kiani, M., Raave, H., Simojoki, A., Tammeorg, O., & Tammeorg, P. (2021). Recycling lake sediment to agriculture: Effects on plant growth, nutrient availability, and leaching. Science of the Total Environment, 753, 141984. https://doi.org/10.1016/j.scitotenv.2020.141984
- Kiani, M., Tammeorg, P., Niemistö, J., Simojoki, A., & Tammeorg, O. (2020). Internal phosphorus loading in a small shallow lake: Response after sediment removal. Science of the Total Environment, 725, 138279. https://doi.org/10.1016/j.scitotenv.2020.138279
- Kiani, M., Zrim, J., Simojoki, A., Tammeorg, O., Penttinen, P., Markkanen, T., & Tammeorg, P. (2023). Recycling eutrophic lake sediments into grass production: A four-year field experiment on agronomical and environmental implications. Science of the Total Environment, 870, 870. https://doi.org/10.1016/j.scitotenv.2023.161881
- Kleeberg, A., Herzog, C., & Hupfer, M. (2013). Redox sensitivity of iron in phosphorus binding does not impede lake restoration. Water Research, 47(3), 1491–1502. https://doi.org/10.1016/j.watres.2012.12.014
- Koroleff, F. (1983). Determination of phosphorus. In K. Grasshoff, M. Ehrhardt, & K. Kremling (Eds.), Methods of seawater analysis (pp. 125–132). Verlag Chemie.
- Kovar, J. L., & Pierzynski, G. M. (2009). Southern Cooperative Series Bulletin (Vol. 408).
- Laakso, J., Uusitalo, R., Leppänen, J., & Yli-Halla, M. (2017). Sediment from agricultural constructed wetland immobilizes soil phosphorus. Journal of Environmental Quality, 46(2), 356–363. https://doi.org/10.2134/jeq2016.09.0336
- Li, Y., Wang, X. L., Huang, G. H., Zhang, B. Y., & Guo, S. H. (2009). Adsorption of Cu and Zn onto Mn/Fe oxides and organic materials in the extractable fractions of river surficial sediments. Soil and Sediment Contamination, 18(1), 87–101. https://doi.org/10.1080/15320380802547841
- López-Bucio, J., Cruz-Ramírez, A., & Herrera-Estrella, L. (2003). The role of nutrient availability in regulating root architecture. Current Opinion in Plant Biology, 6(3), 280–287. https://doi.org/10.1016/S1369-5266(03)00035-9
- Mengel, K. (1997). Agronomic measures for better utilization of soil and fertilizer phosphates. Developments in Crop Science, 25(C), 277–289. https://doi.org/10.1016/S0378-519X(97)80028-1
- Mühlbachová, G., Cermák, P., Vavera, R., Kás, M., Pechová, M., Marková, K., Hlusek, J., & Losák, T. (2018). Phosphorus availability and spring barley yields under graded p-doses in a pot experiment. Acta Universitatis Agriculturae et Silviculturae Mendelianae Brunensis, 66(1), 111–118. https://doi.org/10.11118/actaun201866010111
- Neina, D. (2019). The role of soil pH in plant nutrition and soil remediation. Applied & Environmental Soil Science, 2019(3), 1–9. https://doi.org/10.1155/2019/5794869
- O’Connell, D. W., Mark Jensen, M., Jakobsen, R., Thamdrup, B., Joest Andersen, T., Kovacs, A., & Bruun Hansen, H. C. (2015). Vivianite formation and its role in phosphorus retention in Lake Ørn, Denmark. Chemical Geology, 409, 42–53. https://doi.org/10.1016/j.chemgeo.2015.05.002
- Pittarello, M., Busato, J. G., Carletti, P., Sodré, F. F., & Dobbss, L. B. (2019). Dissolved humic substances supplied as potential enhancers of Cu, Cd, and Pb adsorption by two different mangrove sediments. Journal of Soils and Sediments, 19(3), 1554–1565. https://doi.org/10.1007/s11368-018-2158-1
- Prystupa, P., Slafer, G. A., & Savin, R. (2003). Leaf appearance, tillering and their coordination in response to NxP fertilization in barley. Plant and Soil, 255(2), 587–594. https://doi.org/10.1023/A:1026018702317
- Reitzel, K., Hansen, J., Andersen, F., Hansen, K. S., & Jensen, H. S. (2005). Lake restoration by dosing aluminum relative to mobile phosphorus in the sediment. Environmental Science and Technology, 39(11), 4134–4140. https://doi.org/10.1021/es0485964
- Renella, G. (2021). Recycling and reuse of sediments in agriculture: Where is the problem? Sustainability (Switzerland), 13(4), 1–12. https://doi.org/10.3390/su13041648
- Research Ltd, D. G. T. (2013). Guide to deploying DGT passive samplers in soils General considerations Practical procedures Soil preparation. DGT Research Ltd.
- Robinson, B., Schulin, R., Nowack, B., Roulier, S., Menon, M., Clothier, B., Green, S., & Mills, T. (2006). Phytoremediation for the management of metal flux in contaminated sites. Forest Snow and Landscape Research, 80(2), 221–234.
- Rothe, M., Kleeberg, A., & Hupfer, M. (2016). The occurrence, identification and environmental relevance of vivianite in waterlogged soils and aquatic sediments. In Earth-science reviews (Vol. 158, pp. 51–64). Elsevier B.V. https://doi.org/10.1016/j.earscirev.2016.04.008
- Scholz, R. W., & Wellmer, F. W. (2021). Endangering the integrity of science by misusing unvalidated models and untested assumptions as facts: General considerations and the mineral and phosphorus scarcity fallacy. Sustainability Science, 16(6), 2069–2086. https://doi.org/10.1007/s11625-021-01006-w
- Sondergaard, M., Jensen, P. J., & Jeppesen, E. (2001). Retention and internal loading of phosphorus in shallow, eutrophic lakes. The Scientific World Journal, 1, 427–442. https://doi.org/10.1100/tsw.2001.72
- Sørensen, N. K., & Bülow-Olsen, A.(1994). Plantedirektoratets fælles arbejdsmetoder for jordbundsanalyser.
- Sorn-Srivichai, P., Syers, J. K., Tillman, R. W., & Cornforth, I. S. (1988). An evaluation of water extraction as a soil-testing procedure for phosphorus I. Glasshouse assessment of plant-available phosphorus. Fertilizer Research, 15(3), 211–223. https://doi.org/10.1007/BF01051343
- Talboys, P. J., Heppell, J., Roose, T., Healey, J. R., Jones, D. L., & Withers, P. J. A. (2016). Struvite: A slow-release fertiliser for sustainable phosphorus management? Plant and Soil, 401(1–2), 109–123. https://doi.org/10.1007/s11104-015-2747-3
- Tammeorg, O., Chorus, I., Spears, B., Nõges, P., Nürnberg, G. K., Tammeorg, P., Søndergaard, M., Jeppesen, E., Paerl, H., Huser, B., Horppila, J., Jilbert, T., Budzyńska, A., Dondajewska-Pielka, R., Gołdyn, R., Haasler, S., Hellsten, S., Härkönen, L. H., Kiani, M., & Lürling, M. (2023). Sustainable lake restoration: From challenges to solutions. Wiley Interdisciplinary Reviews: Water, 11(2). https://doi.org/10.1002/wat2.1689
- U.S. Geological Survey. (2020). Mineral commodity summaries 2020. Mineral Commodity Summaries 2020: U.S. Geological Survey, (703). https://doi.org/10.3133/mcs2020
- Van Wichelen, J., Declerck, S., Muylaert, K., Hoste, I., Geenens, V., Vandekerkhove, J., Michels, E., De Pauw, N., Hoffmann, M., De Meester, L., & Vyverman, W. (2007). The importance of drawdown and sediment removal for the restoration of the eutrophied shallow Lake Kraenepoel (Belgium). Hydrobiologia, 584(1), 291–303. https://doi.org/10.1007/s10750-007-0611-z
- Welch, E. B., & Cooke, G. D. (2005). Internal phosphorus loading in shallow lakes: Importance and control. Lake and Reservoir Management, 21(2), 209–217. https://doi.org/10.1080/07438140509354430
- Wijdeveld, W. K., Prot, T., Sudintas, G., Kuntke, P., Korving, L., & van Loosdrecht, M. C. M. (2022). Pilot-scale magnetic recovery of vivianite from digested sewage sludge. Water Research, 212(December 2021), 118131. https://doi.org/10.1016/j.watres.2022.118131
- Yang, S., Yang, X., Zhang, C., Deng, S., Zhang, X., Zhang, Y., & Cheng, X. (2022). Significantly enhanced P release from vivianite as a fertilizer in rhizospheric soil: Effects of citrate. Environmental Research, 212(PD), 113567. https://doi.org/10.1016/j.envres.2022.113567
- Zadoks, J. C., Chang, T. T., & Konzak, C. F. (1974). A decimal code for the growth stages of cereals. Weed Research, 14(6), 415–421. https://doi.org/10.1111/j.1365-3180.1974.tb01084.x