
 ?Mathematical formulae have been encoded as MathML and are displayed in this HTML version using MathJax in order to improve their display. Uncheck the box to turn MathJax off. This feature requires Javascript. Click on a formula to zoom.
ABSTRACT
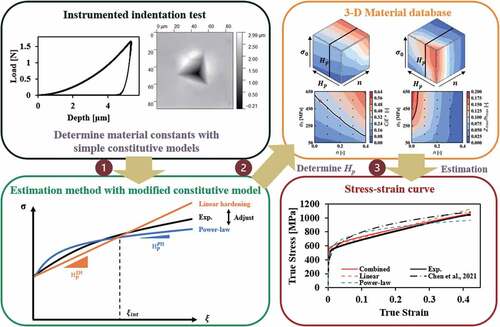
Instrumented indentation testing is an efficient approach for measuring mechanical properties such as equivalent elastic modulus and hardness. Recently, the indentation-based approach has been extended to estimate the stress–strain curve corresponding to tensile or compression tests. However, estimation performance is decreased in high work-hardening alloys because of the limitation of the functional expressiveness in a simple power-law hardening model containing two material constants. Although a modified constitutive model can be employed to improve the expressiveness, additional experimental data are required to adequately determine these material constants. In this study, a method for determining the additional material constant in a modified work-hardening model combining power-law and linear hardening was proposed without additional experimental data, based on the two stress–plastic strain curves of the power-law and linear hardening models. Consequently, the material constants can be determined using an existing approach. In this study, a data-driven estimation approach using the response surfaces of the loading curvature of a load–depth curve and the pile-up height of an indentation impression is established. The proposed approach was applied to high-work-hardening steel for validation.
GRAPHICAL ABSTRACT
1. Introduction
In recent times, data-driven approaches are being rapidly adopted in various research fields as efficient approaches for obtaining new insights from data [Citation1–3]. In materials research and development, material informatics projects such as the material genome initiative [Citation4,Citation5] and materials integration projects [Citation6] have been conducted to reduce the time and effort required for the development of new materials and accelerate innovations based on artificial intelligence. Generally, massive datasets are required to employ advanced data science approaches represented by machine learning [Citation7–9].
In this context, the importance of material database has been recognized, and material databases have been developed using high-throughput computing based on electronic structure [Citation10,Citation11]. However, experimental evaluations are required for the plastic properties of structural materials because of the limitations of computational approaches.
Tensile and compression tests are standard mechanical tests because of the simple stress state, in which the material response is characterized as a stress–strain curve. However, these tests are not preferable for database development because bulk samples are required for each test and the sample preparation requires significant effort. Meanwhile, the hardness test has been employed as an efficient approach to estimate the strength in the development of a material database, which can provide multiple test data from a single sample [Citation12,Citation13]. In addition, the mechanical properties of small constituents, such as single crystal grains can be extracted using this approach [Citation14,Citation15]. Therefore, hardness testing is gaining attention as a high-throughput experimental approach. Kadambi et al. [Citation16], Asgharzadeh et al. [Citation17], Ikeda et al. [Citation18], and Goto et al. [Citation19] obtained massive data on composition-dependent hardness from a sample by applying the hardness test to composition gradient samples.
The instrumented indentation test is an extension of the hardness test [Citation20,Citation21], in which the relationships between the applied load and penetration depth
were measured. The elastic stiffness and hardness can be estimated from the resulting
–
relationship [Citation22,Citation23]. The instrumented indentation test has been extensively applied to characterize the mechanical behavior of alloys, e.g. crystal orientation dependency [Citation24], dislocation mechanism [Citation25,Citation26], and phase-boundary strengthening [Citation27]. By coupling the instrumented indentation test with its computational simulations, various approaches have been proposed to estimate the stress–strain curve of alloys corresponding to the tensile test [Citation28–30]. A power-law hardening model containing two material constants was employed in the estimation approaches using a standard sharp indenter. Although the constitutive model is simple, additional experimental data with a
–
curve are required to determine the two material constants adequately and estimate a unique stress–strain curve [Citation31,Citation32]. Futakawa et al. [Citation33] developed a dual-indenter approach using two sharp indenters with different apex angles. Iracheta et al. [Citation34] and Goto et al. [Citation35,Citation36] estimated plastic properties based on the effect of pile-up height around the indentation impression on the stress–strain curve. Chen et al. [Citation37] developed an estimation approach based on the interaction between the existing and subsequent indentation tests. However, the simplest constitutive model has a limitation in terms of expressiveness to characterize a stress–strain curve, particularly in high work-hardening alloys. Although a better constitutive model can be employed, additional experimental data are generally required to obtain a unique stress–strain curve. Goto et al. [Citation35] drew response surfaces of the loading curvature of a
–
curve and the pile-up height of an indentation impression to investigate the sensitivity to material constants in the simplest power-law hardening model. Based on the different tendencies of the response surfaces, the pile-up height was used to determine a unique set of material constants in addition to the
–
curve. In this context, additional suitable experimental data must be investigated to employ a modified constitutive model. However, sensitivity analysis and determination of a unique solution, even in a constitutive model containing three material constants, are more challenging in comparison with the simplest model. Moreover, additional experimental evaluation requires time and effort in practice.
In this study, an estimation approach of plastic properties from an instrumented indentation test was proposed based on a response surface method, in which a modified constitutive model combining power-law and linear hardening was employed. In the proposed approach, the additional material constant was determined based on the stress–plastic strain curve of the power-law and linear hardening models. Consequently, the material constants could be determined using an existing approach. In this study, we propose a data-driven estimation approach using the response surfaces of the loading curvature of a –
curve and the pile-up height of an indentation impression, which is an extension of an existing approach [Citation35]. In addition, the proposed approach was applied to high-work-hardening steel for validation.
2. Constitutive model
In this study, an isotropic elastoplastic constitutive model was employed to characterize the material response of an alloy. For elasticity, the St. Venant model was employed in an isotropic format, which contains two material constants: Young’s modulus and Poisson’s ratio
. For the plasticity, the von Mises stress
was used for the stress norm to characterize the stress state in the plastic constitutive model. As an extension of the existing model proposed by Dao et al. [Citation28], the elastoplastic stress–strain relationship is described using the equivalent stress
and strain
as follows:
where , and
are the equivalent elastic modulus, yield stress, plastic coefficient, work-hardening exponent, linear hardening coefficient, and equivalent plastic strain, respectively. The equivalent strain and elastic modulus are defined as follows:
where is the strain tensor. In EquationEquation (1)
(1)
(1) , the continuous condition of the stress and strain states at the initial yield stress
can be written as
From Equations (1) and (2), the yield strength is derived as a solution to the following equation:
where the relationship is used on the assumption of a simple loading process. As mentioned above, the constitutive model has five independent material parameters:
,
,
,
, and
.
The simplest work-hardening models of the power-law and linear hardening can be derived as special cases of Equation (3) as follows:
where and
are sets of yield strength and material constants of the power-law and linear hardening models, respectively. Based on the existing approach [Citation35–37], the two material constants can be determined using the loading curvature
of a
–
curve and additional experimental data, in which the
–
curve is assumed to be
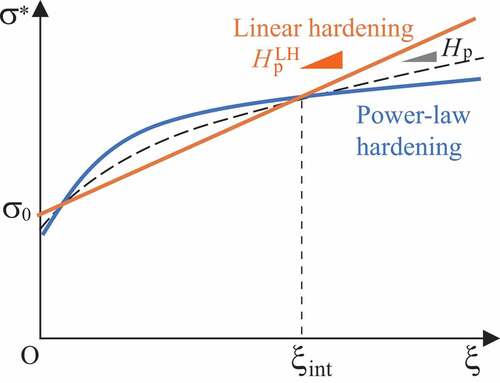
. Note that power-law hardening can characterize the stress–strain curve in a small-strain range but is less expressive for ductile alloys that show high work-hardening in a finite strain range. For such high-work-hardening alloys, linear hardening is generally better for describing the stress–strain curve in a middle strain range; however, it cannot express nonlinear responses in both small and large strain ranges. As mentioned above, both constitutive models have limitations because of their functional features. By combining power-law and linear hardening, the expressiveness can be improved, and the material response of the work-hardening model (3) is expected to be the intermediate between these simplest models. The stress–plastic strain curves of these constitutive models are schematically illustrated in .
Figure 1. Stress–plastic strain curves of two simplest and proposed work-hardening models estimated from instrumented indentation test.
3. Determination of material constants
3.1. Concept
In this study, the linear hardening coefficient , which is approximately the hardening rate in the finite strain range, is determined from the stress–plastic strain curves of the two simplest work-hardening models ().
Let us now focus on the intersection point of the stress–plastic strain curves of the power-law and linear hardening models. This point is defined as a critical strain level in which these simplest models lose their reproducibility, i.e. underestimation of stress in power-law hardening and overestimation in linear hardening. In this context, a suitable hardening rate is assumed to be the intermediate between these two simplest work-hardening models at the equivalent plastic strain of the intersection point. Therefore, the linear hardening coefficient
of Equation (3) can be determined from the stress–plastic strain curves of the power-law hardening and linear hardening models as follows:
where is a weight coefficient. Accordingly, using EquationEquation (6)
(6)
(6) , the remaining two material constants
and
of EquationEquation (3)
(3)
(3) can be determined in the same way as the existing approach. The weight coefficient
controls the feature of the work-hardening model between the two simplest models. In the case of
or low work-hardening materials (
), the constitutive model (3) definitely becomes a power-law hardening model.
3.2. Database production
In this study, the two material constants in the work-hardening models (3), (4), and (5) were determined using a response surface method [Citation37] based on the –
curve and topography of an indentation impression [Citation35]. In this approach, the material constants can be read from a material database prepared by high-throughput simulations based on a finite element method. By comparing a computational optimization approach using a gradient descent method [Citation35], the data-driven approach can provide a suitable set of material constants in an instant without any iterative calculations. In a previous study [Citation37], a response surface of interaction between neighboring indentation tests was generated in addition to that of a
–
curve. In this study, the response surface of a pile-up height of an indentation impression was prepared to determine the material constants instead of the neighboring indentation tests.
3.2.1. Finite element model
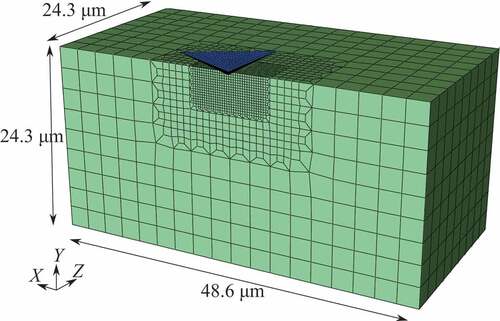
A three-dimensional (3-D) finite element model was prepared for the computational simulations of the instrumented indentation tests, as shown in . A mirror-symmetrical boundary condition was employed for the –
plane along the center of the sample. The vertical displacement at the bottom of the sample was constrained. The finite element model contains 15,358 nodes and 14,138 eight-node hexahedral elements using reduced integration, validated in our previous study [Citation35]. Note that an appropriate finite element model must be defined to quantitatively reproduce the corresponding experimental results, for which its validation and verification are required [Citation27,Citation38,Citation39]. The contact area between the indenter and the sample was more finely discretized than in the other areas. A Berkovich indenter was used and assumed to be a rigid body in this study. The friction between the indenter and the sample was not considered because the effect of friction in the Berkovich indenter is insignificant [Citation29]. The maximum indentation depth
was defined as 1.0 μm. Finite element analyses were performed using displacement control at the top of the indenter and solved as quasi-static boundary value problems with an implicit scheme.
Figure 2. Finite element model of instrumented indentation test.
3.2.2. Response surfaces
In this study, considering the elastic properties of steel, and
were assumed to be 200 GPa and 0.3, respectively. The unknown material constants are
,
, and
in the constitutive model (3). The loading curvature
of the
–
curve and pile-up height
of the indentation impression were chosen as two response variables characterized by the three material constants. Then, high-throughput computational simulations were performed to generate the normalized response variables
and
for these material constants in the range of
MPa
MPa
,
, and
. Note that
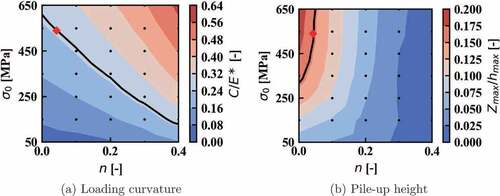
is approximately constant in indentation tests of which the deapth is more than 0.2 µm [Citation40]. Based on calculated mesh data, the response surfaces were depicted using a trilinear interpolation function (or a bilinear interpolation function at a cross section) as shown in . In addition, the response surfaces in the cases of
MP and
are presented to determine the material constants of the power-law and linear hardening in , in which the calculated points are indicated by dots.
Figure 3. Response surfaces of normalized loading curvature and pile-up height for ,
, and
in
GPa and
. Surface of
MPa was indicated to use for validation.
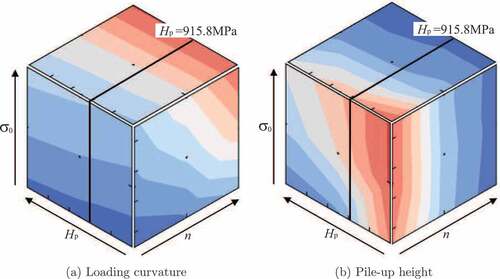
Figure 4. Response surfaces for power-low hardening ( GPa,
, and
MPa). Black lines and a rhomboid mark were drawn for validation.
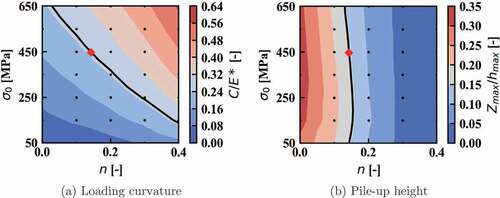
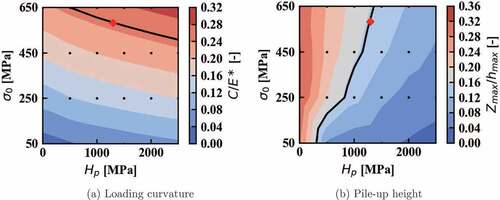
Figure 5. Response surfaces for power-low hardening ( GPa,
, and
). Black lines and a rhomboid mark were drawn for validation.
4. Validation
Instrumented indentation tests were performed for SUS304 stainless steel, and the stress–strain curve was estimated using the proposed approach for validation.
4.1. Experiments
For the instrumented indentation tests, a TI950 TriboIndenter (Bruker Co., USA) was equipped with a scanning probe microscope and a high-load module using a Berkovich indenter. Considering the load limit of the equipment, the maximum indentation depth was set as 5.3
m. Following the computational simulations, the displacement-control mode was used, in which the loading and unloading rates were set as 0.1 µm/s. The sample surface of the SUS304 sample was prepared by mechanical polishing followed by electrical polishing to remove residual plastic strains. After an indentation test, the pile-up topography around the indentation impression was measured using the scanning probe microscope. The maximum pile-up heights along three edges of the indentation impression were measured from the pile-up topography. Then, the average value of the three maximum pile-up heights was used to estimate the plastic properties.
As a result, the –
curve and pile-up topography of the indentation impression were obtained, as shown in . The loading curvature
and maximum pile-up height
of the indentation impression were calculated from the indentation results. The instrumented indentation tests were performed 12 times and the averaged values were used to reduce experimental errors. The experimental data of the 12 indentation tests and those average value and deviations are shown in , respectively.
Figure 6. Experimental results.
Table 1. Experimental results of loading curvatures and pile-up heights: data of 12 indentation tests.
Table 2. Experimental results of loading curvatures and pile-up heights: average value and deviations of 12 indentation tests.
4.2. Determination of material constants
Based on the proposed approach, the material constants of the constitutive model (3) were determined from the experimental results.
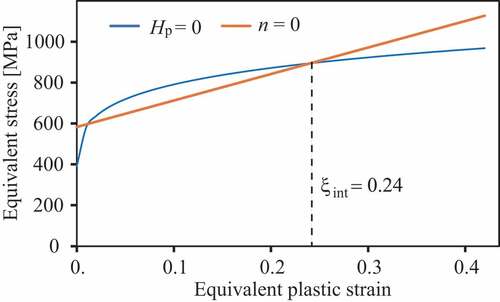
First, the material constants of the two simplest hardening models were determined from the response surfaces shown in . In these figures, black lines are drawn on the values corresponding to the experimental results. The intersection point of the two lines indicates the estimated material constants, at which a rhomboid mark is drawn in . The sets of the material constants of the power-law hardening () and linear hardening (
) were estimated as
and
, respectively. Using the sets of the material constants, the estimated stress–plastic strain curves are drawn, as shown in . In these curves, the intersect equivalent plastic strain
is 0.24. Then, the derivation of power-law hardening at
is
Figure 7. Stress–plastic strain curves of two simplest work-hardening models estimated from instrumented indentation test.
Based on the concept of upper and lower bounds (), we defined as 0.5, which provides a good solution in general. The value of
can be optimized to obtain a better solution, in which the range of
in [0, 1] is preferable rather than a standard material constant. In this case, the linear hardening coefficient
was calculated as 915.8 MPa.
Next, the remaining material constants and
were determined at
MPa. The response surfaces at
MPa are depicted in , which is indicated in . From the response surfaces shown in , these material constants were determined as
MPa and
. As mentioned above, the material constants can be estimated from the material database of based on the experimental results.
Figure 8. Response surfaces for combined hardening model ( GPa,
, and
MPa).
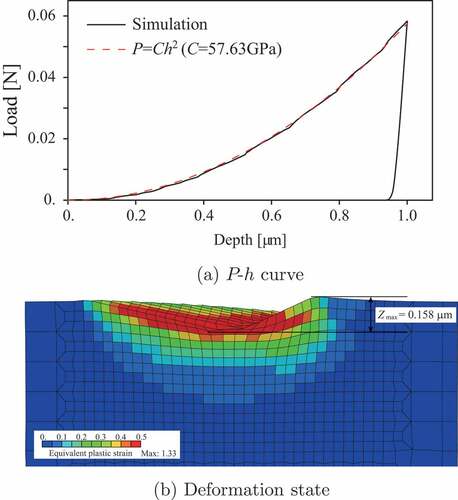
The results of the computational simulation using the estimated material constants, the –
curve, and the deformation state around the indentation impression after the indentation test are shown in . The loading curvature and pile-up height of the corresponding experiment were reproduced in the simulation.
Figure 9. Validation: simulation results using estimated material constants.
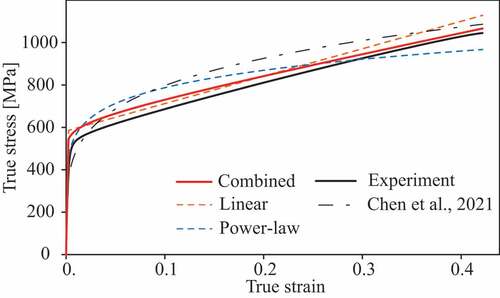
4.3. Comparison with experimental data and existing approaches
The stress–strain curves of the experimental and estimation results are shown in , where the result estimated using another approach [Citation37] was appended for comparison. The material response of the proposed work-hardening model combining power-law and linear hardening is located in the middle of the two simplest models as designed. The estimation is consistent with the corresponding experimental results by improving the expressiveness of the constitutive model. For this material response, the power-law hardening model used in past studies cannot provide a good estimation.
Figure 10. Validation: stress–strain curves estimated from instrumented indentation test.
Although one of the sets of the material constants can be determined using a computational optimization method such as the gradient descent method, a unique solution cannot be obtained without an additional constraint; for example, the two simplest work-hardening models are possible solutions. In the proposed approach, the constraint condition was appended to obtain a unique solution based on the estimated stress–plastic strain curves of the simplest models.
5. Conclusions
In this study, a method for estimating the plastic properties of high-work-hardening alloys was proposed using an instrumented indentation test. A modified constitutive model was defined to describe the intermediate material response between the power-law and linear hardening. The linear hardening coefficient of the modified constitutive model was determined from the estimated material responses of the power-law and linear hardening models based on the –
curve and pile-up height of an instrumented indentation test without any additional experimental data. In addition, the material database was generated using high-throughput computational simulations to determine the material constants from the resulting response surfaces of the
–
curve and pile-up height. The estimated material constants were validated by comparison with the corresponding experiments, and a good agreement was achieved.
In this study, strain-rate-independent plasticity was investigated. Recently, the instrumented indentation test has been extended to evaluate mechanical properties at elevated temperatures [Citation41,Citation42]. At high-temperature evaluation, strain-rate-dependency represented by creep is important [Citation43–45]; however, the estimation of the material constants of the strain-rate-dependent constitutive models is challenging because the models contain more material constants.
Acknowledgement
The authors wish to acknowledge Ms Y. Yamamoto, Dr S. Taniguchi, Ms E. Nakagawa, Mr D. Araki, and Prof. H. Murakami of the National Institute for Materials Science for their technical support.
Disclosure statement
No potential conflict of interest was reported by the author(s).
Additional information
Funding
References
- Onishi T, Kadohira T, Watanabe I. Relationship extraction with weakly supervised learning based on process-structure-property-performance reciprocity. Sci Technol Adv Mater. 2018;19(1):649–659.
- Liu Z, Wu CT. Exploring the 3D architectures of deep material network in data-driven multiscale mechanics. J Mech Phys Solids. 2019;127:20–46.
- Yamanaka A, Kamijyo R, Koenuma K, et al. Deep neural network approach to estimate biaxial stress-strain curves of sheet metals. Mater Des. 2020;195:108970.
- Xiong W, Olson GB. Cybermaterials: materials by design and accelerated insertion of materials. Npj Comput Mater. 2016;2(1):1509.
- de Pablo JJ, Jackson NE, Webb MA, et al. New frontiers for the materials genome initiative. Npj Comput Mater. 2019;5(1):41.
- Enoki M. Development of performance prediction system on SIP-MI project. Mater Trans. 2020;61(11):2052–2057.
- Rovinelli A, Sangid MD, Proudhon H, et al. Predicting the 3D fatigue crack growth rate of small cracks using multimodal data via Bayesian networks: in-situ experiments and crystal plasticity simulations. J Mech Phys Solids. 2018;115:208–229.
- Li H, Kafka OL, Gao J, et al. Clustering discretization methods for generation of material performance databases in machine learning and design optimization. Computational Mechanics. 2019;64(2):281–305.
- Zheng X, Chen T, Guo X, et al. Controllable inverse design of auxetic metamaterials using deep learning. Mater Des. 2021;211:110178.
- Jain A, Ong SP, Hautier G, et al. Commentary: the materials project: a materials genome approach to accelerating materials innovation. APL Mater. 2013;1(1):011002.
- Kirklin S, Saal JE, Meredig B, et al. The open quantum materials database (OQMD): assessing the accuracy of DFT formation energies. Npj Comput Mater. 2015;1(1):15010.
- Gong X, Mohan S, Mendoza M, et al. High throughput assays for additively manufactured Ti-Ni alloys based on compositional gradients and spherical indentation. Integr Mater Manuf Innovation. 2017;6(3):218–228.
- Chen H, Cai LX. Theoretical conversions of different hardness and tensile strength for ductile materials based on stress–strain curves. Metall Mater Trans A. 2018;49(4):1090–1101.
- Cheng G, Choi KS, Hu X, et al. Determining individual phase properties in a multi-phase Q&P steel using multi-scale indentation tests. Mater Sci Eng A. 2016;652:384–395.
- Zhou Y, Fan Z, Liu X, et al. Experimental study and crystal plasticity finite element simulations of nano-indentation-induced lattice rotation and the underlying mechanism in TC6 single α-grain. Mater Des. 2020;188:108423.
- Kadambi SB, Divya YD, Ramamurty U. Evaluation of solid-solution hardening in several binary alloy systems using diffusion couples combined with nanoindentation. Metall Mater Trans A. 2017;48(10):4574–4582.
- Asgharzadeh A, Tiji SAN, Esmaeilpour R, et al. Determination of hardness-strength and-flow behavior relationships in bulged aluminum alloys and verification by FE analysis on Rockwell hardness test. Int J Adv Manuf Technol. 2020;106(1–2):315–331.
- Ikeda A, Goto K, Osada T, et al. High-throughput mapping method for mechanical properties, oxidation resistance, and phase stability in Ni-based superalloys using composition-graded unidirectional solidified alloys. Scr Mater. 2021;193:91–96.
- Goto K, Ikeda A, Osada T, et al. High-throughput evaluation of stress–strain relationships in Ni–Co–Cr ternary systems via indentation testing of diffusion couples. J Alloys Compd. 2022;910:164868.
- Van Landingham MR. Review of instrumented indentation. J Res Natl Inst Stand Technol. 2003;108(4):249–265.
- Walley SM. Historical origins of indentation hardness testing. Mater Sci Technol. 2012;28(9–10):1028–1044.
- Oliver WC, Pharr GM. An improved technique for determining hardness and elastic modulus using load and displacement sensing indentation experiments. J Mater Res. 1992;7(6):1564–1583.
- ISO-14577, Metallic materials – instrumented indentation test for hardness and materials parameters. Geneva, Switzerland: ISO Central Secretariat; 2002.
- Li TL, Gao YF, Bei H, et al. Indentation Schmid factor and orientation dependence of nanoindentation pop-in behavior of NiAl single crystals. J Mech Phys Solids. 2011;59(6):1147–1162.
- Dahlberg CFO, Saito Y, Oztop MS, et al. Geometrically necessary dislocation density measurements at a grain boundary due to wedge indentation into an aluminum bicrystal. J Mech Phys Solids. 2017;105:131–149.
- Lu S, Zhang B, Li X, et al. Grain boundary effect on nanoindentation: a multiscale discrete dislocation dynamics model. J Mech Phys Solids. 2019;126:117–135.
- Matsuno T, Ando R, Yamashita N, et al. Analysis of preliminary local hardening close to the ferrite-martensite interface in dual-phase steel by a combination of finite element simulation and nano-indentation test. Int J Mech Sci. 2020;180:105663.
- Dao M, Chollacoop N, Van Vliet KJ, et al. Computational modeling of the forward and reverse problems in instrumented sharp indentation. Acta Mater. 2001;49(19):3899–3918.
- Bucaille JL, Stauss S, Felder E, et al. Determination of plastic properties of metals by instrumented indentation using different sharp indenters. Acta Mater. 2003;51(6):1663–1678.
- Fernandez-Zelaia P, Joseph VR, Kalidindi SR, et al. Estimating mechanical properties from spherical indentation using Bayesian approaches. Mater Des. 2018;147:92–105.
- Cheng Y, Cheng G. Can stress–strain relationships be obtained from indentation curves using conical and pyramidal indenters? J Mater Res. 1999;14(9):3493–3496.
- Alkorta J, Martinez-Esnaola JM, Sevillano JG. Absence of one-to-one correspondence between elastoplastic properties and sharp-indentation load–penetration data. J Mater Res. 2005;20(2):432–437.
- Futakawa M, Wakui T, Tanabe Y, et al. Identification of the constitutive equation by the indentation technique using plural indenters with different apex angles. J Mater Res. 2001;16(8):2283–2292.
- Iracheta O, Bennett CJ, Sun W. A holistic inverse approach based on a multi-objective function optimisation model to recover elastic-plastic properties of materials from the depth-sensing indentation test. J Mech Phys Solids. 2019;128:1–20.
- Goto K, Watanabe I, Ohmura T. Determining suitable parameters for inverse estimation of plastic properties based on indentation marks. Int J Plast. 2019;116:81–90.
- Goto K, Watanabe I, Ohmura T. Inverse estimation approach for elastoplastic properties using the load–displacement curve and pile-up topography of a single Berkovich indentation. Mater Des. 2020;194:108925.
- Chen T, Watanabe I, Liu D, et al. Data-driven estimation of plastic properties of alloys using neighboring indentation test. Sci Technol Adv Mater Methods. 2021;1(1):143–151.
- Antunes JM, Menezes LF, Fernandes JV. Three-dimensional numerical simulation of Vickers indentation tests. Int J Solids Struct. 2006;43(3–4):784–806.
- Kang JJ, Becker AA, Sun W. Determining elastic–plastic properties from indentation data obtained from finite element simulations and experimental results. Int J Mech Sci. 2012;62(1):34–46.
- Kucharski S, Jarzabek D. Depth dependence of nanoindentation pile-up patterns in copper single crystals. Metall Mater Trans A. 2014;45(11):4997–5008.
- Ruzic J, Watanabe I, Goto K, et al. Nano-indentation measurement for heat resistant alloys at elevated temperatures in inert atmos phere. Mater Trans. 2019;60(8):1411–1415.
- Minnert C, Oliver WC, Durst K. New ultra-high temperature nanoindentation system for operating at up to 1100 °C. Mater Des. 2020;192:108727.
- Ginder RS, Nix WD, Pharr GM. A simple model for indentation creep. J Mech Phys Solids. 2018;112:552–562.
- Chen T, Watanabe I, Funazuka T. Characterization of the strain- rate-dependent plasticity of alloys using instrumented indentation tests. Crystals. 2021;11:1316.
- Phani PS, Oliver WC, Pharr GM. Influences of elasticity on the measurement of power law creep parameters by nanoindentation. J Mech Phys Solids. 2021;154:104527.