
 ?Mathematical formulae have been encoded as MathML and are displayed in this HTML version using MathJax in order to improve their display. Uncheck the box to turn MathJax off. This feature requires Javascript. Click on a formula to zoom.
ABSTRACT
Nitrogen mainly exists as nitrate in aqueous environments. In karst areas, nitrate pollution caused by anthropogenic activities severely endangers aqueous systems. In order to identify nitrate sources, nitrate in the cave water of Mahuang Cave was comprehensively analysed using hydrochemistry, δ15N-δ18O isotopes and stable isotope analysis in R. The results indicate that the nitrate content in the cave water presented insignificant seasonal variations but significant spatial variations. Compared with the variation of δ15N-NO3−, the seasonal variation of δ18O-NO3− was positive (2.68‰) in the dry season and negative (−0.52‰) in the wet season. The variation of NO3− and Cl− and the isotopes of NO3− (δ15N, δ18O) suggest multiple sources of NO3− in the water. The average contribution of different nitrate sources in the karst cave water was assessed by the SIAR model: chemical fertilisers (46.29%) > soil nitrogen (30.57%) > manure & sewage (14.14%) > atmospheric precipitation (9.14%) in the dry season and chemical fertilisers (61.86%) > soil nitrogen (20.29%) > manure & sewage (12.43%) > atmospheric precipitation(5.57%) in the wet season. The contribution in dry and wet seasons was dominated by chemical fertilisers and soil nitrogen.
1. Introduction
Groundwater nitrate contamination has affected groundwater quality worldwide (Jin et al., Citation2018; Xue et al., Citation2009; Zhang et al., Citation2020). In agricultural activities, nitrogen fertilisers are usually used to increase crop yields. It has been found that China accounts for 32% of the global nitrogen fertiliser application (Ata-Ul-Karim et al., Citation2017; Jin et al., Citation2020; Yan et al., Citation2014). However, nitrate pollution caused by irrational fertilisation is highly destructive to ecosystem stability (Jin et al., Citation2020), especially in karst areas (Wang et al., Citation2020). This can be attributed to the fact that karst areas have large undulating terrain, extensive sloping land areas, shallow and discontinuous soils and severe soil erosion (Song et al., Citation2019; Zhou et al., Citation2017). Since nitrate is a soluble compound (Tutmez & Hatipoglu, Citation2010), nitrate in the soil may infiltrate the phreatic zone in heavy rainfall through leaching, affecting aqueous environments (Oscar et al., Citation2023). In addition, fissures, karst pipes and macropores developed in karst aquifers can provide convenient channels for nitrate with high mobility to enter subsurface aqueous systems. Surface nitrate in karst areas is more likely to enter underground spaces than in non-karst areas, causing eutrophication and water quality deterioration (Chen et al., Citation2008; Ford & Williams, Citation2007; Tayefeh et al., Citation2018; Yue et al., Citation2018; Zhang et al., Citation2022). Karst aquifers are the drinking water source for about a quarter of the global human population (Ford & Williams, Citation1989; Wang et al., Citation2020). Thus, drinking water safety issues caused by groundwater nitrate contamination can seriously threaten human health (Cao et al., Citation2022; Fan & Steinberg, Citation1996; Tutmez, Citation2009; Vidueira et al., Citation2020). Therefore, it is important to control nitrate content by reducing nitrate pollution and accurately identifying nitrate sources in the karst groundwater.
Potential mixed sources of nitrate in aqueous systems include atmospheric precipitation (AP), industrial effluents, soil nitrogen (SN) and agricultural activities (mainly applied chemical fertilisers (CF) and manure & sewage (M&S)) (Heaton et al., Citation2012; Kendall et al., Citation2007; Yue et al., Citation2014; Zhang et al., Citation2022). Since the 1970s, some scholars have used NO3− concentrations, δ15N-NO3− isotopes and simple hydrochemical methods (NO3−/Cl−) to analyse nitrogen distribution in rivers in order to determine NO3− sources and sinks in groundwater (Jin et al., Citation2015; Kohl et al., Citation1971; Liu et al., Citation2006). However, quantifying the sources and secondary processes affecting NO3− concentrations is limited by using either single δ15N-NO3− isotopes or hydrochemical methods because the isotope compositions of different sources highly overlap in complex biogeochemical processes (Han et al., Citation2018; Yu et al., Citation2020). The combined effects of many factors lead to uncertainty in the tracing results (Kellman & Hillaire-Marcel, Citation1998; Xue et al., Citation2009).
Stable isotope techniques have been continuously improved and widely applied. Particularly, isotope tracers can effectively identify the sources of nitrate in water bodies. Regarding the mixed sources of nitrate, their δ18O-NO3− values are significantly different (Wassenaar, Citation1995). Based on the dual isotope technique, these differences can provide additional information for analysing nitrate sources (Albertin et al., Citation2012; Li et al., Citation2017; Xing & Liu, Citation2016). Therefore, the combined use of δ15N and δ18O dual isotopes of nitrate can avoid the drawbacks of single-isotope analysis. In recent years, hydrochemistry and δ15N and δ18O isotopes of NO3− have been effectively applied to analyse the mixed sources of nitrate in water bodies (Cui et al., Citation2020; Kim et al., Citation2015; Musgrove et al., Citation2016; Wang et al., Citation2017). Combined with the dual nitrate isotope method, the Bayesian stable isotope mixing model (SIAR) by Parnell et al. (Citation2010) can facilitate more effective and accurate tracing of the mixed sources of NO3− and the estimation of the contribution rate of mixed sources (Cui et al., Citation2020; Kim et al., Citation2015; Matiatos, Citation2016). Compared with other typical quantitative estimation models (e.g. the mass conservation model, the IsoSource model and the IsoError model), the SIAR model is currently the most widely used model to estimate the contribution rate of each nitrate source.
As a typical karst area, Southwest China is rich in karst development types such as fissures, karst pipes, sinkholes and caves. This karst area has a widely distributed karst landscape area, fragile ecological environment, large sloping land area and strong agricultural activities. Thus, nitrate pollution caused by nitrogen fertiliser application has seriously affected the aqueous environment quality. Meanwhile, the unique karst geomorphology can induce an intense exchange between surface water and groundwater. Various foreign substances cannot be adequately excluded and enter the underground spaces through water flow, thus affecting drinking water safety in the karst areas. Therefore, in this study, Mahuang Cave, a first-level branch cave in the Shuanghe Cave System, was taken as the research object. Cave water samples were collected from the sampling points with different drip types over 10 months. The hydrochemical and NO3− isotopic compositions of the cave water were analysed. The objectives are (1) to explore the temporal and spatial distribution characteristics of nitrate; (2) to determine the nitrate source and transformation in cave drip water; (3) to quantify the contribution rate of different nitrate sources using the SIAR model.
2. Materials and methods
2.1. Overview of the study area
The study area is located in Shuanghe Cave National Geopark in Wenquan Town, Suiyang County, Zunyi City, Guizhou Province, China (). Shuanghe Cave is currently the longest dolomite cave, the fifth longest cave in the world and the longest cave in Asia. An analysis of the development and evolution process of the Shuanghe cave system shows that the Shuanghe cave system can mainly be divided into four levels of cave passages (Chen & Zhang, Citation1994), and the cave length has been proved to be 417.696 km (as of 2023). This cave was mainly formed in the middle-upper Cambrian Loushanguan Formation (ϵ2–3ls) and the lower Ordovician Tongzi Formation (O1t), and the exposed rocks are mainly carbonate rocks such as dolomite, dolomitic limestone, flintstone and argillaceous dolomite (Li et al., Citation2008; Zhu & Li, Citation2004). In particular, due to the intermittent uplift in the Quaternary, the topography in the study area is strongly cut, and the gullies are developed under karstification in the longitudinal and horizontal directions. The geological effects control the direction of the gullies, which are mainly formed by water erosion, dissolution and collapse along the fault joints. Karst landforms are widely distributed in the region. There are rich karst landforms, mainly including peak-cluster depressions, canyons, sinkholes, water caves, karst caves and hidden underground rivers. Thus, a more typical and unique geomorphological feature has developed in the three-dimensional binary structure of karst areas (Liu, Citation2008; Zhang et al., Citation2018). Carbonate rock fissure cave water, carbonate rock with clastic rock fissure cave water and clastic rock fissure water are the main groundwater types in the study area. Underground rivers are the main recharge source of surface watersheds, and the flow of underground rivers in the region is no less than 100 L·s−1. Combined with the changes in water chemistry and δ13CDIC values of the water bodies in the existing studies, it shows that the cave water is mainly recharged by atmospheric rainfall (P. Li et al., Citation2008; H. Zhang et al., Citation2023). The climate type in this area is characterised as a subtropical humid monsoon climate with four distinct seasons. The atmospheric CO2 concentration generally ranges from 350 to 400 ppm. The average temperature difference between day and night is less than 10°C, and the annual mean temperature is around 15.5°C. Annual rainfall is mainly concentrated between April and October, with an annual mean value of about 1210 mm, and the humidity in this area ranges from 85% to 98%. The abundant rainfall and humid monsoon climate provide necessary hydrodynamic conditions and a good ecological environment for forming topographical features such as abnormal peaks and caves in karst areas (Li et al., Citation2008).
Figure 1. (a) Location of the study area; (b) Hydrogeological map of the study area; (c) Tunnel structure and sampling point distribution of Mahuang Cave; (d) Overlying land use image of Mahuang Cave.
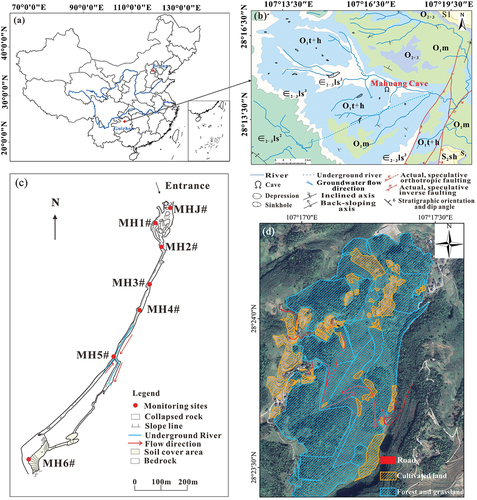
This study selected Mahuang Cave, one of the main caves, as the object of study. Mahuang Cave, as a local undeveloped carbonate cave, is the first-level branch of the Shuanghe Cave System, with a total cave passage length of about 1100 m, an entrance height of about 32 m and a width of about 15 m. The altitude of the whole cave ranges between 678 ~ 720 m. The altitude of the cave entrance is about 720 m. The roof rock strata thickness of the cave is about 85.3 m (P. Li et al., Citation2008). The whole cave has a complex structure. Folded fault zones were formed in the NE, NW and SN directions under geotectonic stresses and hydrodynamic forces. A hidden subterranean river is developed at about 720 m from the cave entrance. The cave is also rich in developing secondary carbonate sediments such as stalagmites, mantles, stalactites and goose tubes. The whole cave presents a spatial structure characteristic of larger cavities at a larger distance from the cave entrance. Land use types overlying the cave mainly include woodland, cultivated land and grassland. The soils are mainly yellow loam and limestone soils (Gong et al., Citation2024). The crops are grown on the overlying cropland of Mahuang Cave mainly include beans, maize, sorghum, rapeseed and other vegetables. The natural environment overlying the cave is influenced by grazing activities in addition to the farming of local farmers. The vegetation type in this area is mainly subtropical evergreen broad-leaved forest, with a vegetation coverage exceeding 60%.
2.2. Data acquisition and testing
2.2.1. Sample collection
To investigate the nitrate source in the water body of Mahuang Cave, water samples were collected from April 2021 to February 2022 (sampling was not conducted in October 2021 due to the COVID-19 epidemic in the study area). The dry season includes April, November and December 2021 and January and February 2022. The wet season includes May to September 2021. A total of seven sampling sites were selected according to the composition structure of the study area and the study objectives (). The hydrologic path pattern of the cave water recharge is shown in . The basic parameters of water samples (such as water temperature (T), electrical conductivity (EC), dissolved oxygen concentration (DO) and pH) were monitored on site using a Multi3430 portable multi-parameter water quality analyser (WTW, Germany). The measurement range and accuracy are as follows: T (−5.0 ~ 105.0℃, 0.1℃), EC (0 ~ 2000 μS·cm−1, 0.1 μS·cm−1), DO (0 ~ 20 mg·L−1, 0.01 mg·L−1) and pH (−2 ~ 20, 0.001). The water samples were collected using 50 mL polyethylene bottles. The bottles were repeatedly rinsed with the water samples 2 ~ 3 times before sampling. Then, the water samples were filtered with a 0.22 μm acetate fibre filter membrane and loaded into a polyethylene bottle. Before loading, retained air in the sample should be avoided to ensure that no air bubbles are filled into the water samples. Next, the samples were sealed and refrigerated at 4°C to prevent biochemical reactions during storage.
Figure 2. Flow paths for cave water recharge.
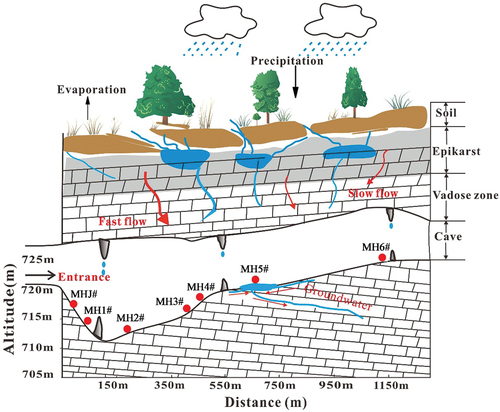
Table 1. Sampling points and water sample types.
2.2.2. Laboratory testing
Anion and cation testing in the water samples was conducted using an ICS90 ion chromatograph (Dionex Corporation, U.S.A.) and a VISTA MPX inductively coupled plasma-emission spectrometer (Varian Corporation, U.S.A.), respectively, at the Institute of Geochemistry, Chinese Academy of Sciences. Nitrogen and oxygen isotope testing of water nitrates was performed at the Third Institute of Oceanology, Ministry of Natural Resources, China. A chemical conversion method was adopted, and the specific operation process was as follows: a total of 20 mL water sample was placed in a 40 mL headspace bottle. 0.1 mL CdCl2 solution (20 g·L−1), 0.8 mL NH4Cl solution (250 g·L−1) and 3 × 10 cm 4N clean zinc sheet were added sequentially and then shaken at 220 r·min−1 for 15 min (full reaction). Then, the zinc sheet was removed. The bottle was sealed. This mainly aims to reduce NO3− to NO2−. Next, 1 mL of the NaN3-CH3COOH (1:1) solution was added to the bottle in order to reduce NO2− to N2O. Water and CO2 were removed using the chemical trap of magnesium perchlorate and caustic lime. Finally, N2O was fed to the chromatographic column by low-flow helium for further separation and purification. Then, the nitrogen and oxygen isotope values of N2O were measured online using a gas bench stable isotope mass spectrometer (Ryabenko et al., Citation2009). The analytical precision for nitrogen and oxygen isotope values were ± 0.3‰ and 0.3‰, respectively. Hydrogen and oxygen isotopes in the cave water were measured using a liquid water stable isotope analyser (IWA-35 d-EP; Los Gatos Research, U.S.A.), with a precision of ± 2.0‰ and ± 0.1‰, respectively.
2.3. Quantitative estimation of the contribution rate of different nitrate sources
A SIAR model was used to quantitatively analyse the contribution rate of different nitrate sources in cave water (Parnell et al., Citation2010). This model is expressed as
where Xij and Sjk are the δ values of Isotope j of mixture i and Source k, respectively (i = 1,2,3…, N; j = 1,2,3……., J); Pk is the proportion of Source k to be estimated; μjk and ω2jk are the mean and variance of the normal distribution, respectively; Cjk is the fractionation factor of Isotope j of Source k, which obeys a normal distribution with a mean of λjk and a variance of τjk; εij is the residual error, indicating the unquantifiable variation among the components, with a mean of 0 and a standard deviation of σj.
3. Results
3.1. Variation characteristics of main parameters of cave water
The statistics of the main hydrochemical parameters at each cave water sampling point are shown in . pH values of all seven sampling sites were above 8 (), indicating that the water was weakly alkaline. Seasonal pH variations were insignificant, ranging between 8.03 ~ 8.39 (8.26 on average) and 8.00 ~ 8.66 (8.36 on average) in the dry and wet seasons, respectively. Spatial pH variations were independent of the distance from the cave entrance, with similar pH values at various points. Temporal water temperature (T) variations were significant, ranging between 7.3 ~ 15.1°C in the dry season (11.24°C on average) and between 13.1 ~ 17.8°C in the wet season (15.24°C on average). Water temperature in the wet season showed slightly larger variations than in the dry season. In addition, the water temperature variation gradually stabilised with increasing distance from the cave entrance. This indicates that deeper locations of the cave were less disturbed by external environments. Water temperature at MHJ# and MH1# (closest to the cave entrance) showed significantly different variations, with larger seasonal variations at MHJ#. Water temperature at MHJ# ranged between 7.3 ~ 12.4°C (9.5°C on average) and 15.1 ~ 17.8°C (17.1°C on average) in the dry and wet seasons, respectively. Seasonal average water temperature at MH1# was 9.6 and 15.9°C in the dry and wet seasons, respectively. Seasonal water temperature variations at the sampling points near the cave entrance were more significant than those inside the cave. This may be due to significant ventilation effects inside and outside the cave and the influence of external environments. Water EC ranged between 253 ~ 392 μS·cm−1 (318 μS·cm−1 on average) and 276 ~ 441 μS·cm−1 (344 μS·cm−1 on average) in the dry and wet seasons, respectively: the dry season < the wet season. DO of cave water in the dry season was slightly higher than that in the wet season. DO varied between 9.06 ~ 10.97 mg·L−1 (9.9 mg·L−1 on average) and 8.38 ~ 9.27 mg·L−1 (8.95 mg·L−1 on average) in the dry and wet seasons, respectively. The changing trend of DO indicates that the whole cave environment was in an aerobic state. The DO concentration showed an opposite trend to the temperature, suggesting that the temperature may affect the DO concentration. Average Cl− concentrations were 2.90 and 2.72 mg·L−1 in the dry and wet seasons, respectively, with slight seasonal variations.
Table 2. Variation characteristics of the main hydrochemical parameters in the study area.
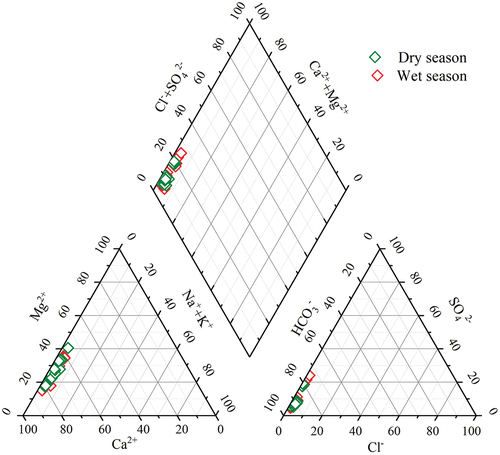
The trends of the major ions are shown in (the shaded part indicates the wet season and the rest is the dry season). The changes of Ca2+ in the cave water ranged from 36.78 to 53.58 mg·L−1 in the dry season (47.87 mg·L−1 on average) and from 37.3 to 61.11 mg·L−1 in the wet season (48.71 mg·L−1). The changes of Mg2+ ranged from 10.65 to 27.92 mg·L−1 in the dry season (16.96 mg·L−1 on average) and from 11.26 to 26.73 mg·L−1 in the wet season (16.99 mg·L−1). The changes of Na+ ranged from 0.21 to 1.35 mg·L−1 in the dry season (0.8 mg·L−1 on average) and from 0.34 to 2.74 mg·L−1 in the wet season (0.77 mg·L−1). The changes of K+ ranged from 0.4 to 2.93 mg·L−1 in the dry season (0.99 mg·L−1 on average) and from 0.16 to 2.78 mg·L−1 in the wet season (0.94 mg·L−1). The changes of SO42- ranged from 10.77 to 48.07 mg·L−1 in the dry season (19.11 mg·L−1 on average) and from 10.57 to 52.83 mg·L−1 in the wet season (19.19 mg·L−1). Overall, there were no significant seasonal variation characteristics, except for SO42-. The SO42- content in the cave water exhibited significant spatial variation characteristics and was significantly higher at MH6# than that at MHJ#-MH5#. This may be attributed to the lithology. The gypsum rock layer in the bedrock corresponding to the sample point MH6# may promote the SO42- content in the cave water. The changes of HCO3− in the cave water during the dry and wet seasons ranged from 143.35 to 213.5 mg·L−1 and from 122 to 280.6 mg·L−1, with an average of 180.39 mg·L−1 and 190.76 mg·L−1, respectively. Seasonally, this indicates that the change characteristics in the wet season were slightly larger than those in the dry season. The changes of the concentration of each ion in the cave water indicate that the main cations in the water were Ca2+ and Mg2+, and the main anion was HCO3−. Therefore, in order to clarify the changes of the main water chemistry in the cave water, we plotted Piper diagrams (). The results show that in the anion triangulation diagrams, ion changes in the dry and wet seasons were located in HCO3−. In the cation triangulation diagrams, ion changes in the dry and wet seasons were mainly located in Ca2+ and Mg2+, respectively. Therefore, we concludes that the water chemistry type in the study area is mainly the HCO3-Ca-Mg type.
Figure 3. Characterization of changes in major ions.
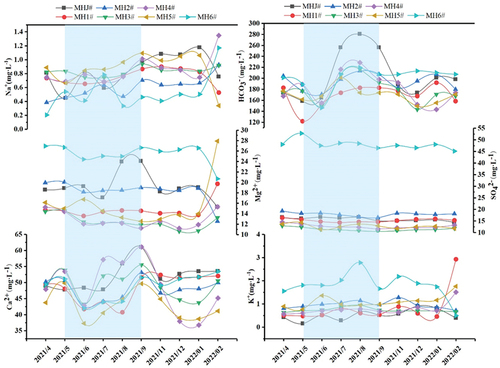
Figure 4. Piper diagrams of the cave water.
3.2. Composition characteristics of isotopes
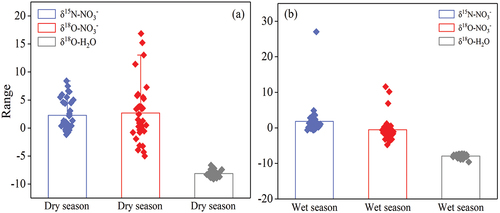
The seasonal variation characteristics of δ15N-NO3−, δ18O-NO3− and δ18O-H2O are shown in . The changes of δ18O-NO3− ranged from −5‰ to 16.85‰ (2.68‰ on average) in the dry season and from −4.78‰ to 11.59‰ (−0.52‰) in the wet season. This showed an overall trend of positive and negative changes in the dry and wet seasons, respectively. The changes of δ15N-NO3− in the wet season were greater than those in the dry season, with the dry and wet season changes of −1.17‰~8.40‰ and −0.63‰~27.06‰ (dry season: 2.28‰, wet season: 1.83‰). This indicated overall insignificant seasonal changes. The changes in both the dry and wet seasons showed a positive trend. δ18O-H2O varied in the dry and wet seasons in the ranges of −9.12‰~-6.63‰ (−8.13‰ on average) and −9.62‰~-7.29‰ (−7.91‰ on average), respectively. The δ18O-H2O was slightly heavier in the wet season than in the dry season. This may be mainly related to abundant rainfall, long sunshine duration, high temperature and high evaporation in the wet season.
Figure 5. Seasonal variations of δ15N-NO3−, δ18O-NO3− and δ18O-H2O in the cave water during the (a) dry and (b) wet seasons.
4. Discussion
4.1. Spatial and temporal variation characteristics of NO3− concentration
Nitrogen mainly exists as nitrate (Kang et al., Citation2022; Tutmez & Hatipoglu, Citation2010). Clarifying its sources and transport mechanisms (Particularly the source of nitrate in groundwater in karst areas) is important in understanding the impact of human activities and environmental changes on aqueous systems (Canfield et al., Citation2010; Guo et al., Citation2020). Due to the special geological structure, surface water resources in karst areas are scarce. Since groundwater resources are indispensable sources of drinking water, it is critical to accurately grasp the source and transformation of NO3− in groundwater. The NO3− content in the Mahuang Cave water showed a stable seasonal variation (). In the dry season, the concentration varied between 0.05 ~ 23.16 mg·L−1, with an average value of 12.10 mg·L−1. The maximum value (23.16 mg·L−1) was located at sampling site MH1#, and the minimum value (0.05 mg·L−1) was located at sampling site MH6#. In the wet season, the concentrations ranged between 0.06 ~ 25.21 mg·L−1, with an average of 12.35 mg·L−1. The maximum value (25.21 mg·L−1) was located at MH1#, and the minimum value (0.06 mg·L−1) was located at MH6#. However, it is found that nitrate content in groundwater is usually relatively low (<2.5 mg.L−1, as N) (Panno et al., Citation2006; Zhang et al., Citation2020). Spatially, the NO3− content was relatively higher at the sample sites closer to the cave entrance (). For example, the nitrate content at MHJ#, MH1# and MH2#, which were closer to the cave entrance, was relatively higher than that at MH3#, MH4#, MH5# and MH6#. The average nitrate content at MHJ#, MH1# and MH2# was 18.7 mg.L−1, 21.6 mg.L−1 and 14.3 mg.L−1 in the dry season and 15.6 mg.L−1, 22.8 mg.L−1 and 16.0 mg.L−1 in the wet season, respectively. Previous studies have shown that the nitrate content at MH3#, MH4#, MH4#, MH5# and MH6# was relatively higher than that at MH3#, MH4#, MH5# and MH6#. It has also been shown that under the same level of disturbance by anthropogenic activities, the nitrate content may be related to the thickness of cave rock cover. There was a thinner rock cover at MHJ#, MH1# and MH2#. These three sites were closely connected to the external environment of the cave and better responded to the external changes. When nitrate enters a karst pipe with stormwater, the degree of connectivity of the karst hydrologic flow paths may result in differences in nitrate levels between sampling sites. At the same time, the contribution from stormwater transport into karst pipes increases as the discharge increases (Yue et al., Citation2020, Citation2023). The average NO3− concentration (about 8.5 mg·L−1) at MH5# (about 720 m away from the entrance) was relatively lower than that at MHJ# and MH1#. This is because MH5# is an underground river and may be influenced by the recharge of diverse water sources. Due to different degrees of dilution, the NO3− content was low. The NO3− concentration at the farthest sample site, MH6# (about 1169.73 m from the cave entrance), was the lowest and had a stable seasonal variation. The average concentration was only about 0.1 mg·L−1 during the dry and wet seasons. The nitrate concentration at MH6# was lower than that at other sampling points. This may be related to the flow path and the intensity of human activities over the cave, resulting in certain spatial differences in the nitrate concentration of the cave water in Mahuang Cave.
4.2. Source identification of nitrate in the cave water
4.2.1. Identification of nitrate sources by hydrochemical characteristics
The correlation of ions in water can indicate the hydrochemical characteristics and sources of ions during transport in water (Gaillardet et al., Citation1999). Cl− is a relatively conserved element with strong biological inertia and stable physicochemical properties (Mengis et al., Citation1999; Xing et al., Citation2013). Due to its special properties, Cl− is commonly regarded as a reliable indicator for identifying pollution sources (Lu et al., Citation2015; Wei et al., Citation2017). Potential Cl− sources in water mainly include recharge of groundwater by seawater, lixiviation of volcanic eruptions, weathering and dissolution of chloride-containing minerals in magmatic rocks and dissolution of rock salts or chlorides in sedimentary rocks in the natural environment. Anthropogenic sources mainly include agricultural potassium fertiliser, domestic sewage and animal manure (J. Liu et al., Citation2018; Mengis et al., Citation1999). Since the geological background and the exposed rock formations of Mahuang Cave are mainly carbonate rocks with few gypsum interlayers, there are no apparent lithological Cl− sources. Thus, Cl− was mainly derived from human activities (agricultural activities, domestic sewage and animal manure) and atmospheric precipitation. The nitrate sources in water mainly include atmospheric precipitation, domestic sewage, animal excrement and agricultural activities. The variation of NO3− and Cl− in the water of Mahuang Cave () showed a significant positive correlation in the dry and wet seasons (R2 = 0.86; R2 = 0.79), indicating that NO3− and Cl− in the cave water had similar pollution sources.
Figure 6. Relationships between NO3−, NO3−/Cl− and Cl−.
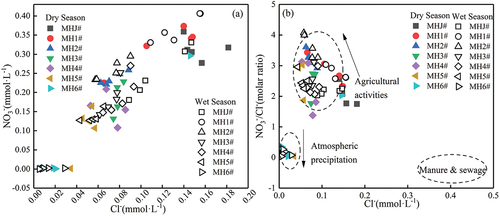
Based on the results of previous studies, it was concluded that there are usually significant differences in the NO3−/Cl− ratio in different sources of nitrate (Li et al., Citation2019; Liu et al., Citation2006). Thus, the correlation between the NO3−/Cl− ratio and Cl− can be traced as a potential mixed source of NO3− pollution (Liu et al., Citation2006). In general, the NO3−/Cl− ratio and the Cl− concentration in different nitrate sources showed the following characteristics: low/high in M&S, high/low in agricultural fertilisers and low/low in atmospheric precipitation (Liu et al., Citation2006). The Cl− content in production and domestic wastewater is much higher than that in the natural water environment due to the significant influence of anthropogenic activities. Meanwhile, the application of agricultural fertilisers in agricultural production activities is mainly nitrogen fertilisers. Thus, the correlation between the NO3−/Cl− ratio and the Cl− content can provide additional valid information for source identification, making the analysis results more reliable. The concentration diagram of NO3−/Cl− and Cl− () showed high NO3−/Cl− ratios (the maximum ratio reached 4.07 mmol·L−1) and low Cl− concentrations in Mahuang Cave water. All water sampling sites are near the side of agricultural activities and atmospheric precipitation, indicating that the nitrate in the Mahuang Cave water may mainly originate from agricultural activities and atmospheric precipitation. In terms of the sampling sites, only the value of sampling site MH6# was on the side of atmospheric precipitation, suggesting that atmospheric precipitation contributed the most to MH6#. Regarding seasonal variations, no points fell within the manure & sewage range during the dry and wet seasons. Firstly, grazing activities and the amount of applied manure above the cave had no significant impact on the natural environment. Secondly, the strong dilution effect of abundant precipitation during the wet season and fewer agricultural activities in the dry season led to the insignificant contribution of manure & sewage to nitrate in the cave water. In addition, this may also be affected by the rock structure, the migration path of water flow and the biochemical effect in the process of water flow, which could mean that some of the information identified by the hydrochemistry testing methods was masked by the above comprehensive factors. Therefore, the specific situation should be further analysed using δ15N-NO3−and δ18O-NO3− isotopes.
4.2.2. Identification of nitrate sources by δ15N-NO3−and δ18O-NO3− isotopes
Nitrogen has complex biogeochemical cycle processes, often accompanied by nitrification, denitrification, assimilation, mineralisation and volatilisation in the process of migration and transformation (Chen et al., Citation2020). These processes are affected by geological structure, water flow path and the strength of microbial action. When nitrogen transports from surface soil to groundwater, the above effects can cause isotopic fractionation of the δ15N-NO3− in water. Thus, the δ15N-NO3− value in different nitrate sources differs and highly overlaps (Xue et al., Citation2009). Relying on a single δ15N isotope analysis alone may distort the tracer results and cannot yield accurate source results. Therefore, the identification of potential mixed contamination sources of NO3− must be combined with δ15N-NO3− and δ18O-NO3− dual isotopes to make the tracing results more reliable. The empirical values of δ15N-NO3− and δ18O-NO3− in different pollution sources were summarised in the results of previous studies as follows: atmospheric precipitation, −13‰~13‰ and + 25‰~+75‰ (Kendall, Citation1998; Saccon et al., Citation2013; Xue et al., Citation2009); nitrate fertiliser, −8‰~+7‰ and + 17‰~+25‰ (Bu et al., Citation2016; Kendall et al., Citation2007; Yin et al., Citation2020); SN, 0‰~+8‰ and −10‰~+10‰ (Ding et al., Citation2014; Kelley et al., Citation2013; Kendall et al., Citation2007); M&S, +4‰~+25‰ and −15‰~+15‰ (Z. F. Jin et al., Citation2015); ammonia N fertiliser, −6‰~+6‰ and −10‰~+10‰ (Cui et al., Citation2020; Kelley et al., Citation2013; Xue et al., Citation2009), respectively. The correlation diagram of δ15NNO3- and δ18ONO3- was drawn according to the empirical values. The distribution of NO3-isotope (δ15N, δ18O) values in the Mahuang Cave water during the dry and wet seasons is shown in . The δ15N and δ18O values of all water samples in the dry and wet seasons were located within the three mixed end elements of chemical fertilisers, soil nitrogen and manure & sewage, respectively. This suggests that the nitrate source in the cave water was less affected by seasonal variations. In addition, manure & sewage sources had slightly larger contributions in the dry season than in the wet season.
Figure 7. Relationships between δ15N-NO3− and δ18O-NO3− in the (a) dry and (b) wet seasons and relationships between ln(NO3−/Cl−) and δ15N-NO3 in the (c) dry and (d) wet seasons in the cave water.
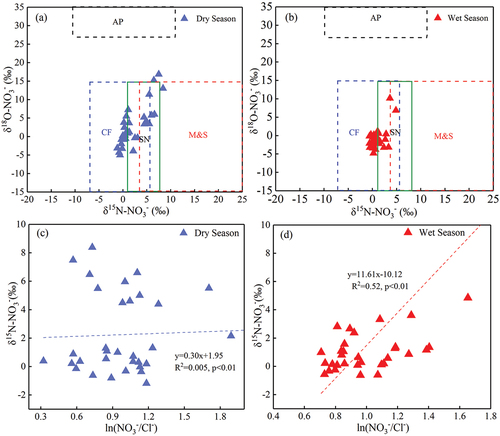
Generally, when the nitrate content in the aqueous environment is caused by manure & sewage sources, it will show high δ15N-NO3− values with low NO3−/Cl− values. When the nitrate content is caused by soil nitrogen and chemical fertilisers, the δ15N-NO3− values will be negative, and the NO3−/Cl− values will show more variations (Jiang et al., Citation2021; Zhang et al., Citation2022). show that most water samples in the dry and wet seasons showed the changing characteristics of low δ15N-NO3− and high NO3−/Cl− values, suggesting that soil nitrogen and chemical fertilisers may be the main contributing sources of NO3− in the cave water. Meanwhile, δ15N-NO3− values in some water samples were higher in the dry season than in the wet season, indicating that higher δ15N-NO3− values in the dry season were mainly controlled by manure & sewage. This is consistent with the findings in .
4.3. Identification of nitrate transport and transformation
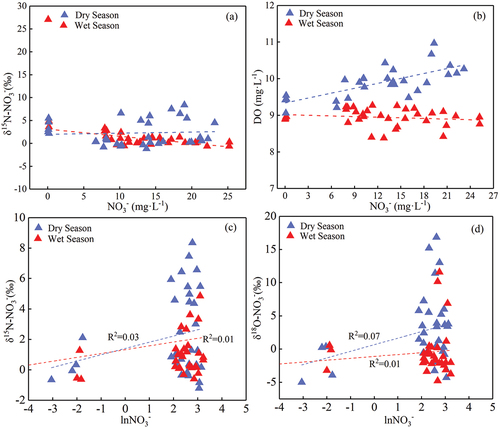
Denitrification is a nitrogen removal process under anaerobic conditions, whose main principle of action is that microorganisms reduce NO3− to N2O and N2. During denitrification, δ15N-NO3− and δ18O-NO3− in the water increase with the decrease of the NO3− concentration because denitrification preferentially uses light isotopes in nitrate and enriches heavy isotopes. This phenomenon is the isotopic fractionation effect. The isotopic fractionation effects caused by nitrification were larger, compared with those by mineralisation, diffusion, volatilisation and assimilation. In addition, in the assimilation processes, the ratio of δ15N-NO3− and δ18O-NO3− showed a 1:1 relationship (Fadhullah et al., Citation2019; Fry, Citation2006), which did not occur in the relationship between δ15N-NO3− and δ18O-NO3− (). Ammonia volatilisation also has specific requirements for the pH of water bodies. It is found in this study that a pH near 9.3 was the most conducive to ammonia volatilisation (Kendall, Citation1998). In contrast, the water pH in the study area varied between 8.03 ~ 8.39 (8.26 on average) and 8.00 ~ 8.66 (8.36 on average) during the dry and wet seasons, respectively. Thus, these pH values did not meet the conditions for ammonia volatilisation. Therefore, this study mainly considered the impacts of nitrification and denitrification on the isotopic composition characteristics of NO3− in the Mahuang Cave water. It was found that the NO3− content would gradually decrease with increasing abundance of δ15N in NO3− during denitrification. shows that the correlation between δ15N-NO3− and NO3− was inconsistent with the variation characteristics of denitrification, indicating that denitrification was not the dominant process of nitrate transformation in the Mahuang Cave water. The correlation between DO and NO3− in shows that denitrification was not the dominant factor affecting the composition of NO3− isotopes since denitrification occurred under anaerobic conditions. It was also found that denitrification requires the dissolved oxygen content of the surrounding water environment to be below 2 mg·L−1 (Chen et al., Citation2021; Gillham & Cherry, Citation1978; Jin et al., Citation2020). The ideal denitrification rate was achieved when the dissolved oxygen concentration in the surrounding water environment was below 0.5 mg·L−1 (Chen et al., Citation2021; Desimone & Howes, Citation1998). Some scholars have also concluded that denitrification occurred when the dissolved oxygen content was between 2 and 6 mg·L−1 but was insignificant (Desimone & Howes, Citation1998; Harris et al., Citation2022; Wu, Citation2002). Since the karst dynamic system is a semi-open and semi-closed system, the DO concentration is generally high due to the rapid response and circulation of karst water. The DO concentration in the study area was 8.38 ~ 10.97 mg·L−1, well above the denitrification threshold of 2 mg·L−1, which did not meet the denitrification conditions. There was no significant negative correlation between δ15N-NO3−, δ18O-NO3− and ln(NO3−) (), confirming that no denitrification occurred.
Figure 8. Relationships of NO3− with (a) δ15N-NO3− and (b) dissolved oxygen, and relationships of ln(NO3−) with (c) δ15N-NO3− and (d) δ18O-NO3− in the cave water.
Nitrification is the process in which ammonia (NH4+) is first oxidised to nitrite (NO2−) by nitrifying bacteria under aerobic conditions and then further oxidised to nitrate (NO3−) (Ma et al., Citation2019; Xu et al., Citation2016). Nitrification usually occurs in soil and water. The principle of action is demonstrated in EquationEquations (2)(2)
(2) and (Equation3
(3)
(3) ). About one-third of the oxygen atoms in NO3− generated by nitrification come from O2 (23.5‰) dissolved in water (Amberger & Schmidt, Citation1987; Kendall, Citation1998; Ma et al., Citation2019), and two-thirds from oxygen in the surrounding water environment (Andersson & Hooper, Citation1983). Therefore, whether nitrification occurs in water can be determined according to δ18O-NO3− variations. The calculation principle is shown in EquationEquation (4)
(4)
(4) .
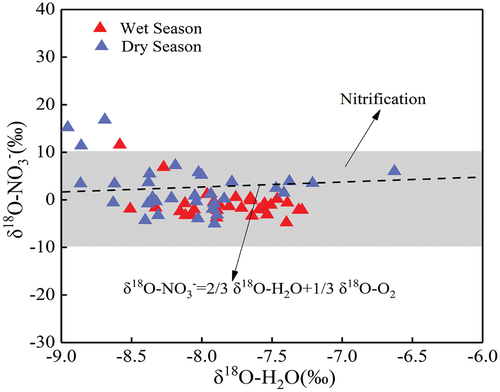
The typical range of δ18O-NO3− generated by nitrification is −10 ~ 10‰. shows that in terms of the relationship between δ18O-NO3− and δ18O-H2O, the samples were located in the classical range of nitrification, except that the δ18O-NO3− at MH6# in individual months were higher than 10‰. The concentration of dissolved oxygen in cave water ranged from 8.38 to 10.97 mg·L−1. The whole environment was in an aerobic state, which also met the conditions for nitrification. This indicates that nitrate transport and transformation in Mahuang Cave were mainly affected by nitrification. In addition, 80% of δ18O-NO3− in the water during the wet season was below the theoretical value of δ18O-NO3−. This may be because microorganisms combined O from the unevaporated H2O in the soil during nitrification, thus reducing the generated δ18O-NO3− (Zhao et al., Citation2020).
Figure 9. Relationships between δ18O-NO3− and δ18O-H2O in the cave water.
4.4. Estimation of the contribution of different nitrate sources
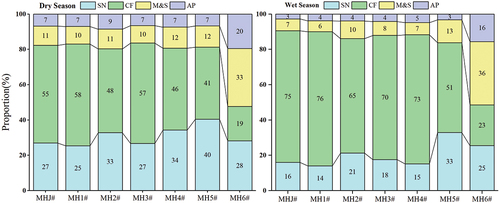
The average contribution of different nitrate sources in the Mahuang Cave water was estimated using a stable isotope mixing model (SIAR) in descending order (): chemical fertilisers (46.29%) > soil nitrogen (30.57%) > manure & sewage (14.14%) > atmospheric precipitation (9.14%) in the dry season and chemical fertilisers (61.86%) > soil nitrogen (20.29%) > manure & sewage (12.43%) > atmospheric precipitation (5.57%) in the wet season. The nitrate contribution in the cave water was dominated by chemical fertilisers and soil nitrogen in the dry and wet seasons. Seasonally, the contribution rate of chemical fertilisers in the wet season was 15.57% higher than that in the dry season. Although the dilution effect of precipitation existed in the wet season (May, June, July, August and September), agricultural activities were more frequent and intensive than in the dry season, with higher fertiliser application. Thus, the chemical fertilisers contribution in the wet season was higher than in the dry season. Spatially, the nitrate contribution at MHJ#, MH1#, MH2#, MH3#, MH4# and MH5# was the largest from chemical fertilisers and the smallest from atmospheric precipitation. The nitrate contribution rate of the four sources differed significantly. In contrast, soil nitrogen had a larger nitrate contribution at MH6# compared with the above six sites, and the contribution rate of the sources was close. The overall analysis shows that the average contribution of chemical fertilisers and soil nitrogen to nitrate reached more than 70%, showing that nitrate in the cave water was significantly impacted by chemical fertilisers and soil nitrogen. In contrast, manure & sewage and atmospheric precipitation had relatively small effects on nitrate. In the agricultural activities of the study area, fertilisers applied to improve crop yields were mainly chemical fertilisers and manure & sewage. The estimation results show that agricultural fertilisation was dominated by chemical fertilisers, and the contribution rate of chemical fertilisers reached more than 40% in both dry and wet seasons.
Figure 10. Contribution rates of different nitrate sources in the cave water.
Therefore, reasonable and effective measures should be taken to control chemical fertilisers application in agricultural activities to reduce nitrate pollution and protect aqueous systems. In karst areas with large sloping arable land, broken surfaces, thin soil layers, undulating terrain, fragile ecological environment and severe soil erosion, nitrate can easily enter the underground system through fissures and karst pipes under the scouring of heavy rainfall and then pollute the groundwater.
5. Significance of nitrate management
In karst regions, groundwater, as an important drinking water resource (Li Vigni et al., Citation2023), is highly susceptible to nitrate contamination. In this study, the maximum nitrate content in the collected cave water samples was determined as 25.21 mg·L−1, without exceeding the maximum allowable content of 50 mg·L−1 recommended by the World Health Organization (WHO, Citation2011). The nitrate source analysis indicates that the nitrate in the cave water mainly resulted from agricultural fertiliser application and soil nitrogen input. Meanwhile, nitrification during nitrogen transport can also improve the nitrate content in the cave water. Therefore, from the perspective of water resource protection and environmental protection, rational fertiliser application or reduction of fertiliser application is an effective way to control nitrate content and reduce nitrate pollution.
6. Conclusions
In the present study, the sources and transformation processes of nitrate in the karst cave water were analysed using the hydrochemical and stable isotope techniques. The changes in DO and pH of the cave water indicate that the cave was in an aerobic state and that the water was weakly alkaline. The average nitrate contents in the study area were 12.10 and 12.35 mg·L−1 in the dry and wet seasons, respectively. The seasonal variations were consistent in the dry and wet seasons. The average variation of δ15N-NO3− in the dry and wet seasons were 2.28‰ and 1.83‰, respectively, with slight differences. The average seasonal variations of δ18O-NO3− in the dry and wet seasons were 2.68‰ and −0.52‰, respectively. Regarding seasonal variations, δ18O-NO3− increased in the dry season and decreased in the wet season. This may be due to the combination of oxygen atoms from non-evaporating water in the soil layer during microbial action. In addition, the analysis of δ18O in the water and nitrate shows that nitrification was the dominant process during nitrate transport and conversion in the karst aquifer. The composition characteristics of δ15N and δ18O in NO3− in cave water were not affected by denitrification. The Bayesian mixing model (SIAR) combined with isotopes showed that the potential mixed sources of nitrate in cave water were mainly agricultural fertiliser and soil nitrogen, followed by manure & sewage and atmospheric deposition. The average contribution rates of agricultural fertiliser and soil nitrogen to nitrate were 46.29% and 30.57% in the dry season and 61.86% and 20.29% in the wet season, respectively. Seasonally, the contribution of agricultural fertiliser in the wet season was higher than that in the dry season. This may be because overlying soil of the cave is washed by rainfall in the wet season. During leaching and percolation, a large amount of soluble nitrate from nitrogen fertilisers enters the underground space via microorganisms through various karst channels. Thus, this results in higher nitrate content in the wet season than in the dry season. In general, the nitrate content of the cave water is significantly influenced by agricultural activities.
This study clarified the seasonal variation of the NO3− content in the cave water and its source and transformation processes. These results can provide some basis for managing nitrate pollution in karst groundwater. Appropriate agricultural fertiliser application is key to improving crop yields and controlling chemical nitrogen losses in order to reduce groundwater pollution. Therefore, optimising agricultural fertilisation schemes in karst areas, rationally controlling chemical fertiliser application and promoting the application of inorganic fertilisers in combination with organic fertilisers can effectively control nitrate leaching and reduce nitrate pollution.
Author contributions
All authors contributed to the study conception and design. Dan Su: Conceptualization, Investigation, Methodology, Software, Data curation, Validation, Visualization, Writing-Original Draft, Writing-Review & Editing. Zhongfa Zhou: Conceptualization, Methodology, Resources, Supervision, Project Administration, Funding Acquisition, Writing-Review & Editing. Xiaohuan Gong: Investigation, Software. Lihui Yan: Investigation, Funding Acquisition, Project Administration. Shengjun Ding: Investigation. Hui Dong: Investigation, Funding Acquisition. Ye Zhang: Investigation. Xiaoduo Wang: Investigation. All authors read and approved the final manuscript.
Disclosure statement
No potential conflict of interest was reported by the author(s).
Data availability statement
Data will be provided by the authors upon a written request.
Additional information
Funding
References
- Albertin, A. R., Sickman, J. O., Pinowska, A., & Stevenson, R. J. (2012). Identification of nitrogen sources and transformations within karst springs using isotope tracers of nitrogen. Biogeochemistry, 108(1–3), 219–232. https://doi.org/10.1007/s10533-011-9592-0
- Amberger, A., & Schmidt, H. L. (1987). Natürliche isotopengehalte von nitratals indikatoren für dessen herkunft. Geochimica et Cosmochimica Acta, 175(4016), 1331–1334. https://doi.org/10.1016/0016-7037(87)90150-5
- Andersson, K. K., & Hooper, A. B. (1983). O2 and H2O are each the source of one O in NO−2 produced from NH3 by nitrosomonas: 15N-NMR evidence. FEBS Letters, 164(2), 236–240. https://doi.org/10.1016/0014-5793(83)80292-0
- Ata-Ul-Karim, S. T., Liu, X. J., Lu, Z. Z., Zheng, H. B., Cao, W. X., & Zhu, Y. (2017). Estimation of nitrogen fertilizer requirement for rice crop using critical nitrogen dilution curve. Field Crops Research, 201, 32–40. https://doi.org/10.1016/j.fcr.2016.10.009
- Bu, H. M., Zhang, Y., Meng, W., & Song, X. F. (2016). Effects of land-use patterns on in-stream nitrogen in a highly-polluted river basin in Northeast China. Science of the Total Environment, 553, 232–242. https://doi.org/10.1016/j.scitotenv.2016.02.104
- Canfield, D. E., Glazer, A. N., & Falkowski, P. G. (2010). The evolution and future of Earth’s nitrogen cycle. Science, 330(6001), 192–196. https://doi.org/10.1126/science.1186120
- Cao, M. D., Yin, X. J., Zhang, J., Jin, M. G., & Huang, X. (2022). Sources and transformations of nitrogen in an agricultural watershed on the Jianghan Plain, China: An integration of δ15N-NH4+, δ15N-NO3−, δ18-O-NO3− and a Bayesian isotope mixing model. Applied Geochemistry: Journal of the International Association of Geochemistry & Cosmochemistry, 142, 105329. https://doi.org/10.1016/j.apgeochem.2022.105329
- Chen, X., Chen, C., Hao, Q. Q., Zhang, Z. C., & Shi, P. (2008). Simulation of rainfall–underground outflow responses of a karstic watershed in Southwest China with an artificial neural network. Water Science and Engineering, 433–443. https://doi.org/10.1061/41003(327)41
- Chen, X., Jiang, L., Huang, X. L., & Cai, Z. C. (2021). Identifying nitrogen source and transport characteristics of the urban estuaries and gate-controlled rivers in northern Taihu Lake, China. Ecological Indicators, 30, 108035. https://doi.org/10.1016/j.ecolind.2021.108035
- Chen, X., Jiang, C. L., Zheng, L. G., Dong, X. L., Chen, Y. C., & Li, C. (2020). Identification of nitrate source-s and transformations in basin using dual isotopes and hydrochemistry combined with a Bayesian mixing model: Application in a typical mining city. Environmental Pollution, 267, 115651. https://doi.org/10.1016/j.envpol.2020.115651
- Chen, J. G., & Zhang, Y. J. (1994). Development and genesis of the Shuanghe Cave System in Suiyang, Guizhou. China Karst, 03, 247–255. In chinese.
- Cui, R. Y., Fu, B., Mao, K. M., Chen, A. Q., & Zhang, D. (2020). Identification of the sources and fate of NO3−-N in shallow groundwater around a plateau lake in southwest China using NO3− isotopes (δ15N and δ18O) and a Bayesian model. Journal of Environmental Management, 270, 110897. https://doi.org/10.1016/j.jenvman.2020.110897
- Desimone, L. A., & Howes, B. L. (1998). Nitrogen transport and transformations in a shallow aquifer receiving wastewater discharge: A mass balance approach. Water Resources Research, 34(2), 271–285. https://doi.org/10.1029/97WR03040
- Ding, J. T., Xi, B. D., Gao, R. T., He, L. S., Liu, H. L., Dai, X. L., & Yu, Y. J. (2014). Identifying diffused nitrate sources in a stream in an agricultural field using a dual isotopic approach. Science of the Total Environment, 484, 10–18. https://doi.org/10.1016/j.scitotenv.2014.03.018
- Fadhullah, W., Yaccob, N. S., Syakir, M. I., Muhammad, S. A., Yue, F. J., & Li, S. L. (2019). Nitrate sources and processes in the surface water of a tropical reservoir by stable isotopes and mixing model. Science of the Total Environment, 700, 134517. https://doi.org/10.1016/j.scitotenv.2019.134517
- Fan, A. M., & Steinberg, V. E. (1996). Health implication of nitrite and nitrate in drinking water: An update on methemoglobinemia occurrence and reproductive and development toxicity. Regulatory Toxicology and Pharmacology: RTP, 23(1), 35–43. https://doi.org/10.1006/rtph.1996.0006
- Ford, D., & Williams, P. W. (1989). Karst geomorphology and hydrology. Chapman & Hall.
- Ford, D., & Williams, P. W. (2007). Karst hydrogeology and geomorphology. John Wiley and Sons, Ltd. ( p. 562)
- Fry, B. (2006). Stable isotope ecology. Springer.
- Gaillardet, J., Dupré, B., & Louvat, P. (1999). Global silicate weathering and CO2 consumption rates deduced from the chemistry of large rivers. Chemical Geology, 159(4), 3–30. https://doi.org/10.1016/S0009-2541(99)00031-5
- Gillham, R. W., & Cherry, J. A. (1978). Field evidence of denitrification in shallow groundwater flow systems. Water Quality Research Journal, 13(1), 53–72. https://doi.org/10.2166/wqrj.1978.006
- Gong, X. H., Zhou, Z. F., Su, D., Dong, H., Yan, L. H., Ding, S. J., Wang, X. D., & Zhang, Y. (2024). Sulfur-oxygen isotope analysis of SO42− sources in cave dripwater and their influence on the karst carbon cycle. Environmental Research, 240, 117508. https://doi.org/10.1016/j.envres.2023.117508
- Guo, X. J., Tang, Y. C., Xu, Y., Zhang, S. S., Ma, J., Xiao, S. B., Ji, D. B., Yang, Z. J., & Liu, D. F. (2020). Using stable nitrogen and oxygen isotopes to identify nitrate sources in the Lancang River, upper Mekong. Journal of Environmental Management, 274, 111197. https://doi.org/10.1016/j.jenvman.2020.111197
- Han, L., Huang, M., Ma, M., Wei, J., Hu, W., & Chouhan, S. (2018). Evaluating sources and processing of nonpoint source nitrate in a small suburban watershed in China. Journal of Hydrology, 559, 661–668. https://doi.org/10.1016/j.jhydrol.2017.04.057
- Harris, S. J., Cendón, D. I., Hankin, S. I., Peterson, M. A., Xiao, S., & Kelly, B. F. J. (2022). Isotopic evidence for nitrate sources and controls on denitrification in groundwater beneath an irrigated agricultural district. Science of the Total Environment, 817, 152606. https://doi.org/10.1016/j.scitotenv.2021.152606
- Heaton, T. H. E., Stuart, M. E., Sapiano, M., & Sultana, M. M. (2012). An isotope study of the sources of nitrate in Malta’s groundwater. Journal of Hydrology, 414-415, 244–254. https://doi.org/10.1016/j.jhydrol.2011.10.037
- Jiang, H., Zhang, Q., Liu, W., Zhang, J., Pan, K., Zhao, T., & Xu, Z. (2021). Isotopic compositions reveal the driving forces of high nitrate level in an urban river: Implications for pollution control. Journal of Cleaner Production, 298, 126693. https://doi.org/10.1016/j.jclepro.2021.126693
- Jin, Z. F., Cen, J. R., Hu, Y. M., Li, L. J., Shi, Y. S., Fu, G. W., & Li, F. L. (2018). Quantifying nitrate sources in a large reservoir for drinking water by using stable isotopes and a Bayesian isotope mixing model. Environmental Science and Pollution Research, 26(20), 20364–20376. https://doi.org/10.1007/s11356-019-05296-7
- Jin, Z. F., Qin, X., Chen, L. X., Jin, M. T., & Li, F. L. (2015). Using dual isotopes to evaluate sources and transformations of nitrate in the West Lake Watershed, Eastern China. Journal of Contaminant Hydrology, 177, 64–75. https://doi.org/10.1016/j.jconhyd.2015.02.008
- Jin, Z. X., Wang, J. F., Chen, J. A., Zhang, R. X., Li, Y., & Lu, Y. T. (2020). Identifying the sources of nitrate in a small watershed using δ15N-δ18O isotopes of nitrate in the Kelan Reservoir, Guangxi, China. Agriculture, Ecosystems & Environment, 297, 106936. https://doi.org/10.1016/j.agee.2020.106936
- Kang, X. Q., Niu, Y., Yu, H., Gou, P., Hou, Q. Y., Lu, X. F., & Wu, Y. L. (2022). Effect of rainfall-runoff process on sources and transformations of nitrate using a combined approach of dual isotopes, hydrochemical and Bayesian model in the Dagang River basin. Science of the Total Environment, 837, 155674. https://doi.org/10.1016/j.scitotenv.2022.155674
- Kelley, C. J., Keller, C. K., Evans, R. D., Orr, C. H., Smith, J. L., & Harlow, B. A. (2013). Nitrate–nitrogen and oxygen isotope ratios for identification of nitrate sources and dominant nitrogen cycle processes in a tile-drained dryland agricultural field. Soil Biology & Biochemistry, 57, 731–738. https://doi.org/10.1016/j.soilbio.2012.10.017
- Kellman, L., & Hillaire-Marcel, C. (1998). Nitrate cycling in streams: Using natural abundances of NO3−-δ15N to measure in-situ denitrification. Biogeochemistry, 43(3), 273–292. https://doi.org/10.1023/A:1006036706522
- Kendall, C. (1998). Tracing nitrogen sources and cycling in catchments. In C. Kendall & J. H. McoDonnell (Eds.), Isotope tracers in catchment hydrology (pp. 519–576). Elsevier.
- Kendall, C., Elliott, E. M., & Wankel, S. D. (2007). Tracing anthropogenic inputs of nitrogen to ecosystems. Stable Isotopes in Ecology and Environmental Science, 375–449. https://doi.org/10.1002/9780470691854
- Kim, K., Yun, S., Mayer, B., Lee, J., Kim, T., & Kim, H. (2015). Quantification of nitrate sources in groundwater using hydrochemical and dual isotopic data combined with a Bayesian mixing model. Agriculture, Ecosystems & Environment, 199, 369–381. https://doi.org/10.1016/j.agee.2014.10.014
- Kohl, D. H., Shearer, G. B., & Commoner, B. (1971). Fertilizer nitrogen: Contribution to nitrate in surface water in a corn belt watershed. Science, 174(4016), 1331–1334. https://doi.org/10.1126/science.174.4016.1331
- Li, P., He, W., & Qian, Z. (2008). Study on Shuanghe dong Geopark. Guizhou People’s Publishing House. (pp. 58–101) in chinese.
- Li, C., Li, S. L., Yue, F. J., Liu, J., Zhong, J., Yan, Z. F., Zhang, R. C., Wang, Z. J., & Xu, S. (2019). Identification of sources and transformations of nitrate in the Xijiang River using nitrate isotopes and Bayesian model. Science of the Total Environment, 646, 801–810. https://doi.org/10.1016/j.scitotenv.2018.07.345
- Li, R. F., Ruan, X. H., Bai, Y., Ma, T., & Liu, C. (2017). Effect of wheat-maize straw return on the fate of nitrate in groundwater in the Huaihe River Basin, China. Science of the Total Environment, 592, 78–85. https://doi.org/10.1016/j.scitotenv.2017.03.029
- Liu, P. (2008). Basic features and causes of caves in Suiyang Shuanghe Cave National Geopark, Guizhou. Guizhou Geology, 04, 302–305. chinese.
- Liu, C. Q., Li, S. L., Lang, Y. C., & Xiao, H. Y. (2006). Using δ15N- and δ18O-values to identify nitrate sources in karst ground water, Guiyang, Southwest China. Environmental Science & Technology, 40(22), 6928–6933. https://doi.org/10.1021/es0610129
- Liu, J., Shen, Z. Y., Yan, T. Z., & Yang, Y. C. (2018). Source identification and impact of landscape pattern on riverine nitrogen pollution in a typical urbanized watershed, Beijing, China. Science of the Total Environment, 628-629, 1296–1307. https://doi.org/10.1016/j.scitotenv.2018.02.161
- Li Vigni, L., Daskalopoulou, K., Calabrese, S., Brusca, L., Bellomo, S., Cardellini, C., Kyriakopoulos, K., Brugnone, F., Parello, F., & Alessandro, W. D. (2023). Hellenic karst waters: Geogenic and anthropogenic processes affecting their geochemistry and quality. Scientific Reports, 13(1), 11191. https://doi.org/10.1038/s41598-023-38349-6
- Lu, L., Cheng, H. G., Pu, X., Liu, X. L., & Cheng, Q. D. (2015). Nitrate behaviors and source apportionment in an aquatic system from a watershed with intensive agricultural activities. Environmental Sciences: An International Journal of Environmental Physiology and Toxicology, 17(1), 131–144. https://doi.org/10.1039/C4EM00502C
- Ma, P., Liu, S. X., Yu, Q. B., Li, X. Y., & Han, X. Q. (2019). Sources and transformations of anthropogenic nitrogen in the highly disturbed Huai River Basin, Eastern China. Environmental Science and Pollution Research, 26(11), 11153–11169. https://doi.org/10.1007/s11356-019-04470-1
- Matiatos, I. (2016). Nitrate source identification in groundwater of multiple land-use areas by combining isotopes and multivariate statistical analysis: A case study of Asopos basin (central Greece). Science of the Total Environment, 541, 802–814. https://doi.org/10.1016/j.scitotenv.2015.09.134
- Mengis, M., Schiff, S. L., & Harris, M. (1999). Multiple geochemical and isotopic approaches for assessing ground water NO3−Elimination in a Riparian Zone. Ground Water, 37(3), 448–459. https://doi.org/10.1111/j.1745-6584.1999.tb01124.x
- Musgrove, M., Opsahl, S. P., Mahlera, B. J., Herrington, C., Sample, T. L., & Banta, J. R. (2016). Source, variability, and transformation of nitrate in a regional karst aquifer: Edwards aquifer, central Texas. Science of the Total Environment, 568, 457–469. https://doi.org/10.1016/j.scitotenv.2016.05.201
- Oscar, D. P., Usamentiaga, R., Trichakis, Y., & Bouraoui, F. (2023). Remote sensing for detecting freshly manure-d fields. Ecological Informatics, 75, 102006. https://doi.org/10.1016/j.ecoinf.2023.102006
- Panno, S. V., Kelly, W. R., Martinsek, A. T., & Hackley, K. C. (2006). Estimating background and threshold nitrate concentrations using probability graphs. Groundwater, 44(5), 697–709. https://doi.org/10.1111/j.1745-6584.2006.00240.x
- Parnell, A. C., Inger, R., Bearhop, S., & Jackson, A. L. (2010). Source partitioning using stable isotopes: Coping with too much variation. Public Library of Science ONE, 5(3), e9672. https://doi.org/10.1371/journal.pone.0009672
- Ryabenko, E., Altabet, M. A., & Wallace, D. W. R. (2009). Effect of chloride on the chemical conversion of nitrate to nitrous oxide for δ15N analysis. Limnology and Oceanography, 7, 545–552. https://doi.org/10.4319/lom.2009.7.545
- Saccon, P., Leis, A., Marca, A., Kaiser, J., Campisi, L., Böttcher, M. E., Savarino, J., Escher, P., Eisenhauer, A., & Erbland, J. (2013). Multi-isotope approach for the identification and characterisation of nitrate pollution sources in the Marano lagoon (Italy) and parts of its catchment area. Applied Geochemistry: Journal of the International Association of Geochemistry & Cosmochemistry, 34, 75–89. https://doi.org/10.1016/j.apgeochem.2013.02.007
- Song, X. W., Gao, Y., Green, S. M., Wen, X. F., Dungait, J. A. J., Xiong, B. L., Quine, T. A., & He, N. P. (2019). Rainfall driven transport of carbon and nitrogen along karst slopes and associative interaction characteristic. Journal of Hydrology, 573, 246–254. https://doi.org/10.1016/j.jhydrol.2019.03.083
- Tayefeh, M., Sadeghi, S. M., Noorhosseini, S. A., Bacenetti, J., & Damalas, C. A. (2018). Environmental impact of rice production based on nitrogen fertilizer use. Environmental Science and Pollution Research, 25(16), 15885–15895. https://doi.org/10.1007/s11356-018-1788-6
- Tutmez, B. (2009). Assessing uncertainty of nitrate variability in groundwater. Ecological Informatics, 4(1), 42–47. https://doi.org/10.1016/j.ecoinf.2008.10.001
- Tutmez, B., & Hatipoglu, Z. (2010). Comparing two data driven interpolation methods for modeling nitrate distribution in aquifer. Ecological Informatics, 5(4), 311–315. https://doi.org/10.1016/j.ecoinf.2009.08.001
- Vidueira, R. G., Oteroa, R. R., Nocelo, M. L. G., Gonzalez, E. R., Gonzalez, D. M., Roca, D. F., Itziar Santos, I. V., & Gandara, G. S. (2020). Identification of nitrates origin in Limia river basin and pollution-determinant factors. Agriculture, Ecosystems & Environment, 290, 106775. https://doi.org/10.1016/j.agee.2019.106775
- Wang, Z. J., Li, S. L., Yue, F. J., Qin, C. Q., Buckerfield, B., & Zeng, J. (2020). Rainfall driven nitrate transport in agricultural karst surface river system: Insight from high resolution hydrochemistry and nitrate isotopes. Agriculture, Ecosystems & Environment, 291, 106787. https://doi.org/10.1016/j.agee.2019.106787
- Wang, S. Q., Zheng, W. B., Currell, M., Yang, Y. H., Zhao, H., & Lv, M. (2017). Relationship between land-use and sources and fate of nitrate in groundwater in a typical recharge area of the North China Plain. Science of the Total Environment, 609, 607–620. https://doi.org/10.1016/j.scitotenv.2017.07.176
- Wassenaar, L. I. (1995). Evaluation of the origin and fate of nitrate in the Abbotsford Aquifer using the isotopes of15N and18O in NO3−. Applied Geochemistry: Journal of the International Association of Geochemistry & Cosmochemistry, 10(4), 391–405. https://doi.org/10.1016/0883-2927(95)00013-a
- Wei, Y. N., Wen, F., Wei, W., & Deng, L. S. (2017). Identification of nitrate pollution sources of groundwater and analysis of potential pollution paths in loess regions: A case study in Tongchuan region, China. Environmental Earth Sciences, 76(12), 4231–423.13. https://doi.org/10.1007/s12665-017-6756-9
- WHO. (2011). Guidelines for drinking-water quality (4th ed.). WHO Press.
- Wu, Y. G. (2002). Denitrification in groundwater environments. Environmental Pollution Control Technology and Equipment, 3(3), 27–31. in Chinese.
- Xing, M., & Liu, W. G. (2016). Using dual isotopes to identify sources and transformations of nitrogen in water catchments with different land uses, Loess Plateau of China. Environmental Science and Pollution Research, 23(1), 388–401. https://doi.org/10.1007/s11356-015-5268-y
- Xing, M., Liu, W. G., Wang, Z. J., & Hu, J. (2013). Relationship of nitrate isotopic character to population de-nsity in the Loess Plateau of Northwest China. Applied Geochemistry: Journal of the International Association of Geochemistry & Cosmochemistry, 35, 110–119. https://doi.org/10.1016/j.apgeochem.2013.04.002
- Xue, D. M., Botte, J., De Baets, B., Accoe, F., Nestler, A., Taylor, P., Van Cleemput, O., Berglund, M., & Boeckx, P. (2009). Present limitations and future prospects of stable isotope methods for nitrate source identification in surface- and groundwater. Water Research, 43(5), 1159–1170. https://doi.org/10.1016/j.watres.2008.12.048
- Xu, S. G., Kang, P. P., & Sun, Y. (2016). A stable isotope approach and its application for identifying nitrate source and transformation process in water. Environmental Science and Pollution Research, 23(2), 1133–1148. https://doi.org/10.1007/s11356-015-5309-6
- Yan, X. Y., Ti, C. P., Vitousek, P., Chen, D. L., Leip, A., Cai, Z. C., & Zhu, Z. L. (2014). Fertilizer nitrogen recovery efficiencies in crop production systems of china with and without consideration of the residual effect of nitrogen. Environmental Research Letters, 9(9), 095002. https://doi.org/10.1088/1748-9326/9/9/095002
- Yin, C., Yang, H. Q., Wang, J. F., Guo, J. Y., Tang, X. Y., & Chen, J. A. (2020). Combined use of stable nitrogen and oxygen isotopes to constrain the nitrate sources in a karst lake. Agriculture, Ecosystems & Environment, 303, 107089. https://doi.org/10.1016/j.agee.2020.107089
- Yue, F. J., Liu, C. Q., Li, S. L., Zhao, Z. Q., Liu, X. L., Ding, H., Liu, B. J., & Zhong, J. (2014). Analysis of δ15N and δ18O to identify nitrate sources and transformations in Songhua River, Northeast China. Journal of Hydrology, 519, 329–339. https://doi.org/10.1016/j.jhydrol.2014.07.026
- Yue, F. J., Li, S. L., Waldron, S. S., Oliver, D. M., Chen, X., Li, P., Peng, T., & Liu, C. Q. (2023). Source availability and hydrological connectivity determined nitrate-discharge relationships during rainfall events in karst catchment as revealed by high-frequency nitrate sensing. Water Research, 231, 119616. https://doi.org/10.1016/j.watres.2023.119616
- Yue, F. J., Li, S. L., Waldron, S. S., Wang, Z. J., Oliver, D. M., Chen, X., & Liu, C. Q. (2020). Rainfall and conduit drainage combine to accelerate nitrate loss from a karst agroecosystem: Insights from stable isotope tracing and high-frequency nitrate sensing. Water Research, 186, 116388. https://doi.org/10.1016/j.watres.2020.116388
- Yue, F. J., Li, S. L., Zhong, J., & Liu, J. (2018). Evaluation of factors driving seasonal nitrate variations in surface and underground systems of a Karst Catchment. Vadose Zone Journal, 17(1), 1–10. https://doi.org/10.2136/vzj2017.04.0071
- Yu, Y., Jin, Z., Chu, G., Zhang, J., Wang, Y., & Zhao, Y. (2020). Effects of valley reshaping and damming on surface and groundwater nitrate on the Chinese Loess Plateau. Journal of Hydrology, 584, 124702. https://doi.org/10.1016/j.jhydrol.2020.124702
- Zhang, J., Cao, M. D., Jin, M. G., Huang, X., Zhang, Z. X., & Kang, F. X. (2022). Identifying the source and transformation of riverine nitrates in a karst watershed, North China: Comprehensive use of major ions, multiple isotopes and a Bayesian model. Journal of Contaminant Hydrology, 246, 103957. https://doi.org/10.1016/j.jconhyd.2022.103957
- Zhang, Q. Y., Shu, W., Li, F. D., Li, M., Zhou, J., Tian, C., Liu, S. B., Ren, F. T., & Chen, G. (2022). Nitrate source apportionment and risk assessment: A study in the largest ion-adsorption rare earth mine in China. Environmental Pollution, 302, 119052. https://doi.org/10.1016/j.envpol.2022.119052
- Zhang, H., Xu, Y., Cheng, S. Q., Li, Q. L., & Yu, H. R. (2020). Application of the dual-isotope approach and Bayesian isotope mixing model to identify nitrate in groundwater of a multiple land-use area in Chengdu Plain, China. Science of the Total Environment, 717, 137134. https://doi.org/10.1016/j.scitotenv.2020.137134
- Zhang, H., Zhou, Z. F., Dong, H., Yan, L. H., Ding, S. J., Huang, J., Gong, X. H., & Su, D. (2023). Seasonal variations of cave dripwater hydrogeochemical parameters and δ13CDIC in the subtropical monsoon region and links to regional hydroclimate. Science of the Total Environment, 881, 163509. https://doi.org/10.1016/j.scitotenv.2023.163509
- Zhang, J., Zhou, Z. F., Wang, Y. L., Pan, Y. X., Xue, B. Q., Zhang, H. T., & Tian, Z. H. (2018). Characterization of cave CO2 changes and response to drip hydrogeochemistry under short-term high-intensity tourism activities. Journal of Geography, 73(9), 1687–1701. chinese.
- Zhao, H. J., Xiao, Q., Miao, Y., Wang, Z. J., & Wang, Q. G. (2020). Sources and transformations of nitrate constrained by nitrate isotopes and Bayesian model in karst surface water, Guilin, Southwest China. Environmental Science and Pollution Research. https://doi.org/10.1007/s11356-020-08612-8
- Zhou, Z. F., Tian, L. Y., Yin, C., Yan, L. H., & Chen, Q. (2017). Soil physicochemical properties of different land use types in karst basin under human intervention. Journal of Guizhou Normal University (Natural Science Edition), 35(4). in chinese. https://doi.org/10.16614/j.cnki.issn1004-5570.2017.04.001
- Zhu, W. X., & Li, P. (2004). Introduction to Shuanghe Cave National Geopark, Suiyang, Guizhou. Guizhou Geology, 03, 205–212. In chinese.