
 ?Mathematical formulae have been encoded as MathML and are displayed in this HTML version using MathJax in order to improve their display. Uncheck the box to turn MathJax off. This feature requires Javascript. Click on a formula to zoom.
ABSTRACT
Despite China’s efforts to conduct unified investigations and monitoring, gaps remain in the comprehensive evaluation of natural resources. A major challenge is the aggregation of data from different categories at the county level, which is crucial for sustainable development. We collected data for Huanggang City, China, for the years 2020–2022, converted them into plane data, and applied multi-criteria decision analysis to examine the natural resource characteristics of Huanggang, which has 10 county-level administrative regions. An evaluation system comprising 56 indices for land, water, forest, wetlands, and minerals was constructed. The analytic hierarchy process and ordered weighted averaging were used for single-resource categories, while the entropy weight method and technique for order preference by similarity to the ideal solution were used to aggregate multi-resource categories. The southern alluvial plain of Huanggang is a favourable location for mineral and land development, whereas northern mountainous and hilly areas are well suited for the growth of green ecological industries focused on water, forest, and wetland ecological functions. The results of this study provide guidance for resource development policies at the county-level, offer a reference for enhancing resource development and protection, and support the Sustainable Development Goals.
Key policy highlights
Comprehensive evaluation of natural resources in Huanggang prefecture-level city, China, was performed.
Natural resource evaluation was conducted based on spatial plane data.
Development policies for natural resource management at the county administrative level were obtained.
Recommendations for natural resource management in each county were proposed based on the macro orientation of Huanggang City.
1. Introduction
‘Transforming our World: The 2030 Agenda for Sustainable Development’ was published by the United Nations in 2015. Various countries are committed to working tirelessly for the full implementation of the Sustainable Development Goals (SDGs) by 2030, requiring policymakers and researchers to understand all dimension of the SDGs in detail (Caglar, Daştan, et al., Citation2024). Natural resources are essential for human survival and development and are closely linked to a range of SDGs, including the environment and climate (Solangi et al., Citation2024). Therefore, it is particularly important to conduct comprehensive analyses and systematic evaluations of natural resources to manage the relationship between natural resources and humanity accurately and effectively (Jianing et al., Citation2024).
Many studies on SDGS and natural resources provide macro-policy recommendations (Caglar, Avci, Ahmed, et al., Citation2024) for natural resources management (Chopra et al., Citation2022). However, action policies at more nuanced administrative levels have been neglected. China has six administrative levels (Country > Province > Municipality > County > Town > Village); the smallest level for natural resources management is the county. Effective implementation of policies at this level is the foundation for achieving the SDGs. Beijing established the Ministry of Natural Resources in March 2018 to coordinate the management and planning of natural resources and improve sustainable development (X. Q. Wang & Pu, Citation2021). This department has issued many standards and documents based on a comprehensive survey of natural resources (Zuo et al., Citation2022) and reported a series of results (Y. Wang et al., Citation2020). However, in China, different categories of natural resources (such as land, forest, and water) were long managed by different departments; as such, the data for individual natural resources are based on different evaluation systems and are often inconsistent (Qiu et al., Citation2022; Yang et al., Citation2023). Therefore, the current challenge is to integrate the data for different natural resources at the smallest level in order to obtain a more comprehensive evaluation.
The present study focused on Huanggang City, which has abundant and varied resources. Huanggang City has 10 county-level administrative regions. County development types have macro directions, but the specific policies for natural resources are not clear (Peng et al., Citation2023). The Huanggang Statistical Yearbook 2020–2022 shows that Huanggang City’s industrial output has increased significantly. The value-added of mining grew at an mean rate of 14.9% between 2020 and 2022, and energy supply increased by 19.4% in 2022. This fluctuating trend requires a thorough investigation into the sustainability of natural resources.
In this study, we developed a comprehensive evaluation system and conducted an in-depth evaluation based on individual natural resources at the county level in. We collected natural resources data for each county in Huanggang City for the years 2020–2022. We then converted this information into spatial plane data and applied multi-criteria decision analysis (MCDA). The functional potentiality of natural resource (FPNR) was determined for the different categories of resource, which were then integrated to produce a comprehensive FPNR index. This index yields different results according to changes in the actual objective, thereby enriching the diversity and flexibility of policy decisions.
2. Literature review
In recent years, there has been an increase in comprehensive evaluation research related to resources and the environment. Cai et al. (Citation2022) proposed an integrated evaluation indicator system for natural resources in land areas using the force – pressure – state – response (state) model. Y. Xu et al. (Citation2023) conducted an comprehensive evaluation of the water ecological environment within the driving force – carrying source – state – management (DCSM) framework. S. Y. Chen et al. (Citation2022) used factor analysis (FA) to construct an indicator system and evaluate the sustainable development of seven typical islands in China. Many researchers have conducted evaluations based on the load-capacity curve (Caglar, Destek, et al., Citation2024) and augmented autoregressive distributed lag (Yavuz et al., Citation2023). However, such evaluations focus on temporal data changes and make little contribution to research on the distribution characteristics of spatial planes. The results of these studies depend mainly on the indicator system (L. Huang et al., Citation2024), which is obtained through scientific methods and is considered unchangeable (Caglar, Gökçe, et al., Citation2024). However, different regions have distinct characteristics, and evaluation based solely on a single indicator system may not be suitable for other regions (Mendoza & Martins, Citation2006).
Another aspect related to the comprehensive evaluation of natural resources is ecosystem service value (Lourdes et al., Citation2022). This involves assessing the ecological value of various natural resources, and analysing whether they can meet the requirements to make management recommendations (Sannigrahi et al., Citation2019). This type of evaluation can be used to analyse individual or multiple natural resources (Kim & Ryu, Citation2022). Some studies have used remote sensing or spatial data to suggest urban spatial plans (Zaman-Ul-Haq et al., Citation2022). However, such research is mainly oriented towards ecology rather than development, and cannot meet the needs of managers and policy makers.
In China, research on the comprehensive evaluation of natural resources mainly focuses on resource, environmental, or ecological carrying capacity (Świąder et al., Citation2020; Ye et al., Citation2021); territorial spatial development suitability (Lin et al., Citation2021); or conservation and intensive utilisation (Liu et al., Citation2021). Studies have mostly focused on certain policies and key points that are biased towards managers. For example, the core problem of resource environment carrying capacity is the relationship between resources, environment, population, and economy (Bjørn et al., Citation2020). Spatial development focuses on the suitability of ecology, living, and production (Bibri et al., Citation2020). Conservation and intensive utilisation are analysed based on the consumption, benefits and utilisation mechanisms of resources (W. W. Li et al., Citation2020). However, these methods can only achieve certain effects for the current target and only describe the characteristics of current policy guidance (Caglar, Avci, Daştan, et al., Citation2024). When the policy and economic backgrounds change, the existing system must be adjusted according to the updated situation (Kumar et al., Citation2021). This need arises because current evaluation systems have a policy orientation instead of a resource feature orientation, which means that they cannot objectively and comprehensively reflect the background characteristics of natural resources.
Overall, many comprehensive evaluation studies have focused on the various characteristics of natural resources; however, gaps in the literature remain. First, there is a lack of a detailed evaluation of the spatial distribution of multiple natural resources. To address this issue, the research presented herein offers a reference for the spatial and intuitive analysis of spatial planes, from which suggestions for natural resources development at the county level can be obtained. Another limitation of past approaches is the lack of a comprehensive method for aggregating the evaluation results of individual natural resources. The comprehensive evaluation index (CI) developed herein not only offers a more thorough understanding of natural resources in this region, but will also aids in identifying the most effective approaches to promote sustainable resource in the spatial plane, catering to sustainably conscious consumers.
3. Materials and methods
3.1. Study area
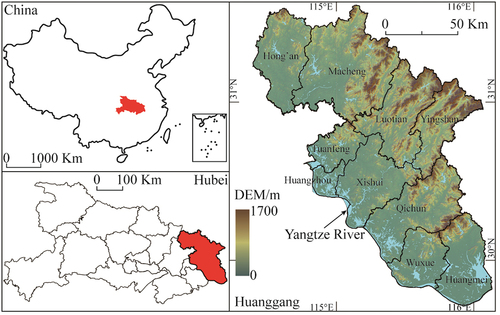
The study area was Huanggang City (114°25‘−116°8’ E, 29°45‘−31°35’N), located in eastern Hubei Province, China (), within the Wuhan City circle. Huanggang has a unique geographical location and multiple ecological functions (Zhong, Citation2018). Moreover, this region has unique developmental advantages in terms of healthcare tourism (Ding & Shen, Citation2019). However, currently, there are few studies on the natural resources of Huanggang, and only a single resource has been evaluated (For example, Land(Dai et al., Citation2020), Water(Xiang et al., Citation2022)). Little research has been conducted on the capacity of the geological environment or on land eco-environmental sensitivity relevant to sustainable resource development (Ding & Shen, Citation2019; M. J. Xu et al., Citation2021). A comprehensive evaluation of natural resources is urgently needed to ensure a balance between environmental protection and economic development. Therefore, this study aimed to provide support for sustainable development by comprehensively and objectively evaluating the characteristics of natural resources in Huanggang City.
Figure 1. Study area location.
3.2. Indicator system construction
The Ministry of Natural Resources in China is responsible for managing various resources, including land, minerals, forests, wetlands, water, and oceans. However, Huanggang City does not contain grasslands or oceans. Therefore, the comprehensive indicator system in this study focused on five types of natural resources (): land quality (Dumanski & Pieri, Citation2000), water regional balance (Menció et al., Citation2010), forest exploitation and conservation (Hauer et al., Citation2010), wetland protection (Fennessy et al., Citation2007), and mineral development and protection (X. H. S. Y. Chen et al., Citation2022).
Table 1. Comprehensive evaluation index system and data sources in Huanggang City.
The criterion layer was constructed within the framework of the connotations of the resource category, and can also be called a conceptual or dimensional layer. It was designed to incorporate various factors, such as background status, efficient utilisation status, ecological environment impact, and governance policies (Zuo et al., Citation2022). To strike a balance between data redundancy and insufficiency, we summarised each natural resource into three-four dimensions (El-Araby et al., Citation2022). We designed four criterion layers for land (Lu et al., Citation2021), including terrain, property, cultivation, and health; three criterion layers for water (Y. Xu et al., Citation2023), including supply, efficiency, and environment; four criterion layers for forests (Zuo et al., Citation2022), including quality, utilisation, ecology, and economy; three criterion layers for wetlands (Qiu et al., Citation2022), including biodiversity (wetlands), health, and guarantees; and four criterion layers for minerals (Ge & Xia, Citation2020), including ecology, inventory, utilisation, and economy.
The third index layer was established through a combination of literature review and expert discussions within the framework of the criterion layer. It comprises 56 specific indices relevant to natural resources and socioeconomic (), the selection of which detailed in the Discussion section. The data were obtained from the following sources: China National Catalogue Service for Geographic Information, Harmonized World Soil Database (HWSD), websites of Huanggang and Hubei Provincial Governments, other public websites, unpublished databases, and supplementary field surveys.
3.3. Methodology
MCDA has emerged as a formal methodology to use available technical information and stakeholder values to support decisions in many fields, and can be especially valuable in policy decision making (Al-Shammari et al., Citation2021; I. B. Huang et al., Citation2011). However, although MCDA is widely used to support decision-making, there is no fixed scheme for model construction (L. Huang et al., Citation2024), which means that MCDA is best applied to spatial plane data (Dimple Singh et al., Citation2024). The MCDA methodology used in this study consisted of two tiers: (1) single-category natural resource evaluation and (2) comprehensive evaluation. Comprehensive evaluations were based on the results of the single category results, which interacted with each other. So, they should not be modelled in the same model. Based on previous studies (Hirai & Comim, Citation2022; J. Li et al., Citation2021; Minea et al., Citation2022), the analytic hierarchy process (AHP) and ordered weighted averaging method (OWA) were used for the single-resource categories (Solangi et al., Citation2024) to obtain criterion weights through importance evaluation and to simulate different decision-making directions (protection or development), respectively. The entropy weight method (EWM) and technique for order preference by similarity to ideal solution (TOPSIS) were used to aggregate the multi-resource categories (Jiang et al., Citation2021), through which the CI of the FPNR was finally obtained.
3.3.1. Data reduction
The original data were sorted when data collection was completed. Here, all data were converted into plane data and normalised for geographic information system (GIS) analysis (Jin et al., Citation2022). The indices in this study were divided into plane, distance, and point data as follows:
Plane data: data containing values for each grid, such as altitude obtained from the digital elevation model. This data type does not require additional processing, whereas other types must be converted to this type.
Distance data: The distance between the grid and the feature must be calculated. For example, the degree of irrigation assurance is the distance between the grid and the nearest waterbody (river, lake, reservoir, etc.).
Point data: Data distributed in the form of discrete sampling points. Generally, Kriging interpolation was used directly to obtain plane results; however, some point data were measured at a certain administrative level. The point values were assigned to the grid within the administrative region. This was the main data type.
After all the data were converted into plane data, some data were scored according to the relevant standards. Data forms are not uniform, which means that their distributions and meanings are inconsistent even after direct normalisation. Therefore, the Chinese national and provincial standards were used. For example, the ‘Specification of Arable Land Survey, Monitoring and Evaluation’ was used to score topography, slope, elevation, and beneficial microelements data, among other parameters. Other standards used in this study included the ‘Environmental Quality Standards for Surface Water’, ‘Technical Regulations for Wetland Resource Investigation’, and ‘Technical Regulations for Continuous Forest Inventory’.
Finally, all index plans were normalised using minimum – maximum normalisation. The specific calculations were divided into two types: the positive index (the higher, the better) was calculated using Equation (1), and the negative index (the lower, the better) was calculated using Equation (2), as follows (Irfan et al., Citation2022):
where is the value to be normalised,
is the maximum,
is the minimum, and
is the normalised value.
3.3.2. AHP
AHP is a common MCDA method (Thomas, Citation1990) based on a mathematical thinking process. This approach obtains parameters according to the relationship between paired parameters, and derives the priority level from the judgement of experts (Jorge-García & Estruch-Guitart, Citation2022). Each resource category is analysed separately during AHP. In this study, the criterion weights were calculated by AHP using the following steps:
Build a hierarchy model: The indices and model are listed in .
Construct a comparison matrix: Criteria/indices under the same category/criterion were compared, and a matrix was constructed for each criterion. The lower triangle of the matrix used values from 1 to 9 (where 1 means that two factors are equally important and 9 means that one factor is much more important than the other). The upper triangles represented the reciprocal of the lower triangles.
Conduct a hierarchical single-sorting and consistency test: The maximum eigenvalues of the matrix and the corresponding eigenvector were calculated using the sum – product method. An eigenvector is the relative criterion weight for each criterion/index in the same resource category/criterion layer. The consistency ratio (CR) was then calculated. When CR < 0.1, the matrix was considered acceptable. The purpose of the consistency test was to determine whether the matrix contained logical problems. If the test failed (CR ≥ 0.1), the matrix needed to be reconstructed.
Conduct a total hierarchy permutation and consistency test: The weights of the relative importance of all indices to the highest layer were calculated using the weighted product of the index layer and corresponding criterion layer. Subsequently, the CR was calculated, and the consistency was determined in the last step. When CR < 0.1, the matrix was acceptable and the criterion weight of each index (
) was calculated using the weighted product.
3.3.3. OWA
OWA, which was proposed by (Ronald, Citation1988), ranks indices according to their importance and transforms different ranking weights to simulate the decision results under different preferences (Firozjaei et al., Citation2019). The criteria and order weights are used in the OWA calculation. The criterion weight was calculated using APH, and the order weight was assigned according to the value of the index. In the traditional layer overlay, the order weights are equal to those of the OWA (Drobne & Lisec, Citation2009).
The functional potential of each single natural resource category was calculated using OWA. For any spatial position g, the OWA result was calculated using Equation (3), as follows (Fahmi et al., Citation2019):
where is the OWA result, which represents the FPNR of a single natural resource, in which the subscript
represents resource category and the subscript
represents different positions;
is the index number of the
th resource category;
is the
th index value of the
th resource category in position
; and
;
is the criterion weight of the
th index, obtained by AHP;
is the order weight of the
th index, which is calculated based on the RIM qualifier function provided by Yager (Citation1996), as shown in (Equation (4):
where is the order of indices and
indicates the degree of optimism.
In OWA, gives the probability of making type I errors (rejecting the true hypothesis). When
, managers are optimistic or pay more attention to the top indices; the probability of mistakes is low, which implies that decisions are inclined towards natural resources protection. When
, managers have no obvious preference in terms of weight and risk, and the order weight is the same for each position. When
, managers are pessimistic about possible deviations, and they hope to reduce the impact by adjusting the order weight, which means that indices ranked lower are more valued, and decisions are inclined towards developing natural resources. Therefore, we can change the optimism index
to change the functional potentiality tendency of different categories of resources, which means that the evaluation results can be adapted to different policies and needs.
3.3.4. EWM
EWM is an objective weighting method that uses entropy to determine the weight according to the degree of data dispersion (Zhang & Duan, Citation2024). The concept of entropy originated from thermodynamics and was later introduced into information theory. Entropy can be used to measure system disorder. Smaller entropy indicates a greater degree of variation, more information, and a more important index (Mukhametzyanov, Citation2021); in contrast, the larger the entropy, the less important the index. This reduces the influence of subjective judgements. The subjective weighting method described above describes a single natural resource category. To reflect the characteristics of various natural resources more objectively, EWM was adopted to ensure high reliability and accuracy.
EWM starts with normalisation, and the method is the same as that in Equation (1). After normalisation, the entropy weight was calculated using Equation (5), as follows (El-Araby et al., Citation2022):
where is the entropy weight of the
th resource category;
, with
representing the number of natural resources categories (in this study,
);
, representing information entropy, with
(referring to spatial coordinate information); and
, representing the characteristic proportion. Particularly, when
,
.
3.3.5. TOPSIS
The TOPSIS method is often used to solve multi-attribute or multi-standard decision-making problems (Sarkar et al., Citation2022). It is a comprehensive evaluation method that is widely used in the field of resource management (Behzadian et al., Citation2012). The basic theory involves drawing an index for the evaluation object in the coordinate system. The closeness between the evaluation scheme and ideal solution can be obtained by calculating the Euclidean distance between each index and the optimal (worst) solution. Closeness reflects the distance between the evaluated and ideal schemes; the closer the distance, the better the scheme. The specific steps were as follows:
Construct a spatial evaluation matrix based on the entropy weight using EquationEquation (6)(6)
(6) .
(2) Determine the optimal (worst) ideal solution. The optimal solution is the most preferred scheme for evaluating the FPNR in the data; it is also the maximum value and is recorded as . The worst ideal solution is the minimum value, which is recorded as
. These can be calculated using Equation (7) and Equation (8), as follows (Salih et al., Citation2019):
Calculate the Euclidean distance between each index and the optimal (worst) solution using EquationEquation (9)(9)
(9) and EquationEquation (10)
(10)
(10) , as follows (Salih et al., Citation2019):
Calculate the closeness (i.e. the CI) using EquationEquation (11)(11)
(11) as follows (Salih et al., Citation2019):
4. Results
4.1. Weights
4.1.1. Criteria weight
Based on the evaluation method, we invited five experts to score the index for each category of natural resources in Huanggang; the criterion weight given by each expert was obtained using AHP. The final criterion weight () was the average of all experts’ results (). The weighted results show that experts have a bias towards certain indices under different resource categories.
Table 2. Result of weights.
In the land category (cultivated land), the most important criterion was cultivation, with a total weight of 0.33. This represents the main question regarding the functional potential of land, which is whether land can be farmed. Other indices were distributed across properties and terrain, which determine the efficiency of land cultivation.
The most important water criterion layer was environment, with a total weight of 0.42. The highest weights in the index layer were for the chemical characteristics and quality, number of protections, and amount of resources, with a cumulative weight of 0.57. Water resources are the basis of human survival, and the aquatic environment is a priority matter. The second most important criterion was the amount of resources that determine the abundance of water resources in an area.
In the forest category, quality and ecology were equally important, with weights of approximately 0.349 each. In the index layer, the highest weights were for biodiversity (forest), the number of forest parks, and community structure, with a cumulative weight of 0.47. The first two indices relate to ecology, and the community structure reflects forest species diversity, which is consistent with the primary functional orientation of forests (ecological function).
Biodiversity (wetland) was the most important criterion in the wetland category, with a total weight of 0.49. The most important indicators in the index layer were animal and plant species, the degree of species threat, and the degree of water quality, with a cumulative weight of approximately 0.61. Wetlands are known as the ‘kidneys of the Earth’, and the functional potential should be biased towards ecological purification, which is well reflected in the weights scored by the experts.
In the mineral category, the inventory was slightly important in the criterion layer with a weight of approximately 0.31. The layer’s most important indices were the identification of resource reserves, transportation accessibility, greening of derelict mines, and proportion of the mining economy, with a cumulative weight of approximately 0.51. These four indices were derived from different criteria, which means that ecology needs to be considered in the development of minerals, but the main functional potential is economic orientation.
4.1.2. Comprehensive evaluation weight
The comprehensive evaluation weight () of each natural resource () was calculated using EWM after the functional potential of each single category of natural resources was calculated.
The results show that there is little difference in among the various natural resources, with the values for minerals being slightly higher. Objectively, although each natural resource emphasises natural functions, their objective weights should not differ significantly. However, in actual resource utilisation, minerals are closely related to economic development; water, forests, and wetlands are related to environmental protection and ecology and have relatively equal status; land is the basis of human access to food, but the efficiency of obtaining food is higher because of technological developments. The problem of soil pollution is superimposed, and the functional potential of the land is relatively low among all natural resources. This is reflected in the objective calculation of EWM.
The objective weights of the indicators varied little with different developmental preferences. The natural resources development orientation is changed by , and this change affects the functional potential characteristics of natural resources, while the amount of information does not change. In addition, under different development preferences (
), the change of functional potential is retained in terms of numerical changes, which leads to objectively less variability in the importance of each natural resources. Therefore, changing
has a small impact on
.
4.2. Single categories of natural resources
After obtaining the criterion weights, we calculated the functional potential of each major natural resource in Huanggang using the OWA method; the results are as follows:
4.2.1. Land
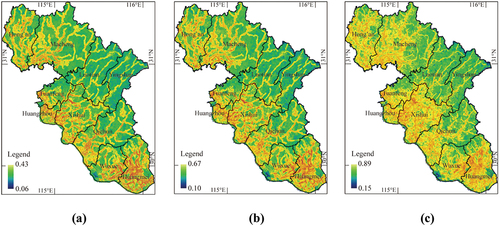
shows the results for the land category; the functional potential of land (SLand) is closely related to water systems (lakes and rivers). Areas with high SLand (suitable for cultivation) were in alluvial plains, with dense lakes along the Yangtze River, whereas the value of SLand in mountainous and hilly areas was low. When the evaluator preference was changed from protection-oriented () to development-oriented (
), the value of SLand and the areas with high SLand gradually increased.
Figure 2. Functional potentiality of land. (a) α = 0.5 (protection-oriented); (b) α = 1 (balance-oriented); (c) α = 2 (development-oriented).
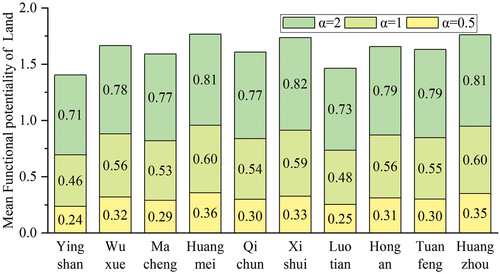
A comparison of the mean SLand for each county under different evaluator preferences is shown in . Regardless of the evaluator preference, SLand was higher in Huangmei and Huangzhou; Xishui had high SLand when the preference was balance-oriented () and development-oriented (
); Luotian, Yingshan, and the east of Macheng had lower values.
Figure 3. Mean functional potentiality of land in each county.
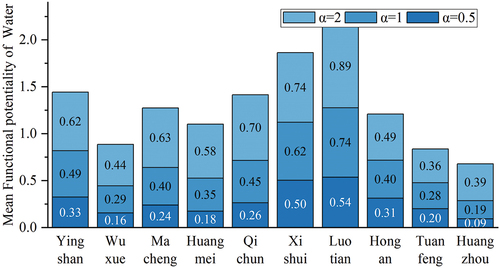
4.2.2. Water
Water evaluations were primarily conducted at the county level. shows the results of the functional potential of water (Swater), and shows the mean functional potential of water in each county. Luotian had the highest Swater, followed by Xishui, ranking first and second, respectively, under all evaluator preferences. Yingshan, Qichun, Macheng, and Hong’an were in the second tier; the Swater in these counties increased with changed orientation (increased ), and Qichun was ranked third among all counties when the preference was development-oriented (
). Swater in Huangzhou, Tuanfeng, Wuxue, and Huangmei was low, and Huangmei improved only under the development orientation. In terms of indicator characteristics and the actual situation, Huangzhou, Tuanfeng, Xishui, Qichun, Wuxue, and Huangmei, which are near the Yangtze River, are rich in water resources. However, except in Huangmei, water pollution is serious, and the water quality of the main lakes is poor; therefore, Swater was low. Swater was higher in Luotian, but its main feature was better water quality; its resource amount was lower than that of Xishui and Qichun.
Figure 4. Functional potentiality of water. (a) α = 0.5 (protection-oriented); (b) α = 1 (balance-oriented); (c) α = 2 (development-oriented).
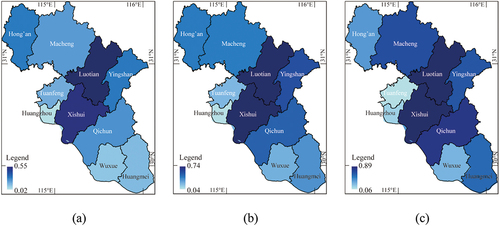
Figure 5. Mean functional potentiality of water in each county.
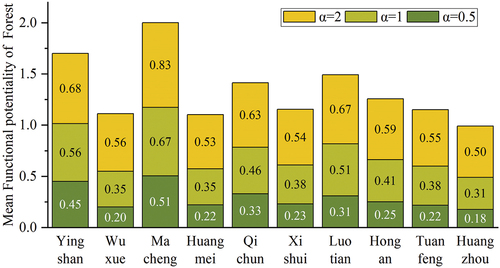
4.2.3. Forests
shows the functional potential of forests (SForest). The areas with the highest SForest values were concentrated in the mountains north of Huanggang. The impact plains along the Yangtze River had the lowest SForest, even under a developmental orientation. shows the mean SForest values for each county. Considering the combined values, Macheng had the highest SForest for all evaluator preferences, followed by Yingshan, where SForest differed from north to south (being lower in the south). In general, Macheng and Yingshan were suitable for forest development, with Luotian and Qichun showing potential as replacement or alternative counties; other counties along the Yangtze River had low SForest, and are not suitable for forest development.
Figure 6. Functional potentiality of forests. (a) α = 0.5 (protection-oriented); (b) α = 1 (balance-oriented); (c) α = 2 (development-oriented).
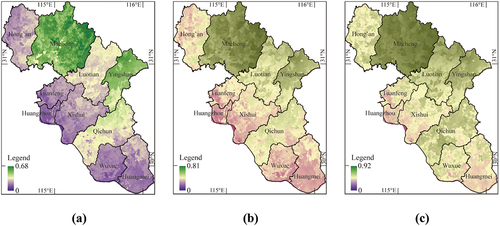
Figure 7. Mean functional potentiality of forests in each county.
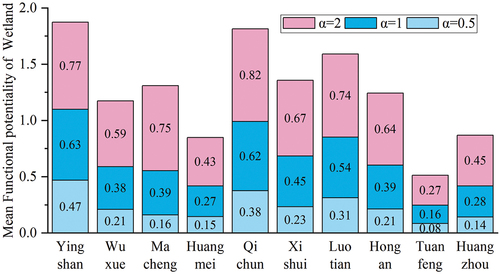
4.2.4. Wetlands
shows the results of the functional potential of wetlands (Swetland), and shows the mean Swetland for each county. Yingshan and Qichun had high Swetland, with a higher value in Yingshan when the preference was protection-oriented () and balance-oriented (
) and higher value in Qichun when it was development-oriented (
). The Swetland of Luotian was slightly lower than that of the other two counties, and it offers an alternative or successor area. Tuanfeng, Huangmei, and Huangzhou ranked lowest. Huangmei is rich in wetland resources and is the only county with inland beaches, but wetland diversity is under greater threat owing to serious pollution. Therefore, the current task of these counties should focus on the ecological restoration and pollution control of wetlands.
Figure 8. Functional potentiality of wetlands. (a) α = 0.5 (protection-oriented); (b) α = 1 (balance-oriented); (c) α = 2 (development-oriented).
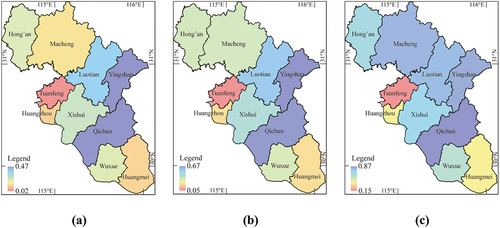
Figure 9. Mean functional potentiality of wetlands in each county.
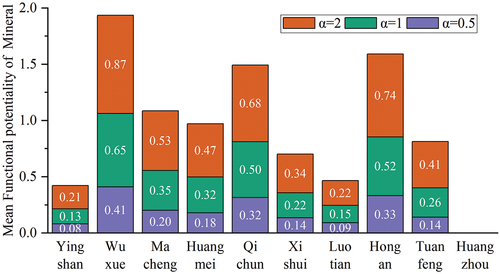
4.2.5. Minerals
shows the functional potential of minerals (SMineral), and shows the mean SMineral in each county. The results show that each county’s rank changed slightly with its policy orientation. Wuxue, Hong’an, and Qichun were always ranked in the top three. Yingshan, Luotian, and Xishui had lower SMineral; Huangzhou is shown as blank because there is no mineral resources. Wuxue is the most suitable region for the development of mineral resources. Qichun and Hong’an offer resource recharge areas. Macheng and Huangmei are rich in mineral resources; however, their ecology and utilisation conditions are poor. As such, they can only develop mineral resources alongside ecological protection and as such offer reserve and optimisation areas. Other counties had low mineral resources, and external conditions for mineral utilisation were poor, leading to disadvantages in mineral development.
Figure 10. Functional potentiality of minerals. (a) α = 0.5 (protection-oriented); (b) α = 1 (balance-oriented); (c) α = 2 (development-oriented).
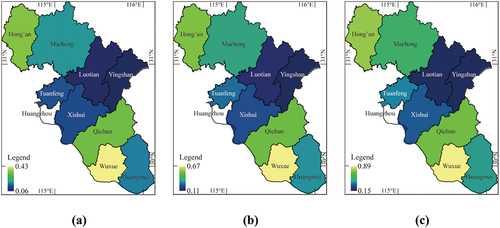
Figure 11. Mean functional potentiality of minerals in each county.
4.3. Comprehensive evaluation
shows the CI results of the FPNR and shows the mean CI in each county. Qichun had the highest CI value under any policy orientation, followed by Hong Kong and Wuxue. The CI of Macheng was low when the preference was protection-oriented (), but rose to second place when the preference was development-oriented (
). The CI values for Luotian, Xishui, and Yingshan were similar to those for Wuxue and Hong’an when the preference was protection-oriented (
), and were higher than the value for Macheng. However, the CI values differed from those of Wuxue and Hong’an when the preference was balance-oriented (
), and were slightly lower than the value for Macheng when the preference was development-oriented (
). The CI values of Huangmei and Huangzhou were slightly lower than the value for Yingshan only when the preference was development-oriented (
); the values for Huangmei, Huangzhou, and Tuanfeng were far lower than those for other counties in other cases.
Figure 12. Comprehensive evaluation index of natural resource functional potentiality. (a) α = 0.5 (protection-oriented); (b) α = 1 (balance-oriented); (c) α = 2 (development-oriented).
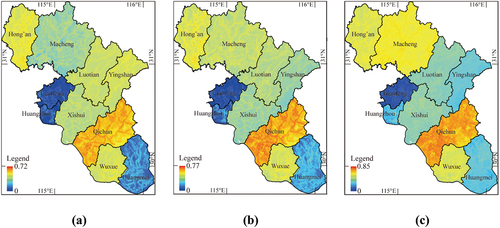
Figure 13. Mean comprehensive evaluation index of natural resource functional potentiality in each county.
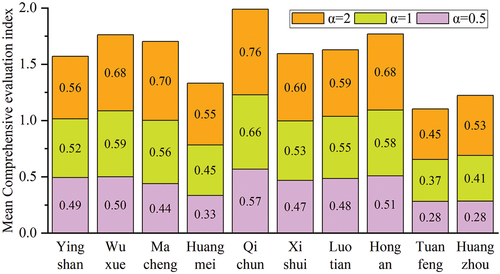
Based on the cumulative mean value, the FPNR of each county was ranked by CI (). On this basis, the natural resources characteristics of each county were analysed visually and specific natural resources development suggestions were considered. Qichun was ranked first. The natural resources with a high FPNR in Qichun are wetlands and minerals, with land having a low FPNR. However, water pollution in Qichun is relatively serious, and water has a high FPNR only when the preference was development-oriented. That is, Qichun should develop minerals and make full use of wetlands to protect the water environment. Forests in hilly areas should be developed according to local conditions, and land protection should be actively carried out.
Table 3. Ranking of natural resource functional potentiality.
Hong’an and Wuxue ranked second and third, respectively, with similar characteristics. They had high FPNR for minerals, but other resources were ranked in the middle or lower. On this basis, Hong’an can increase the development of minerals by optimising existing ecological protection. Wuxue ranked lower in water, forests, and wetlands, showing that it needs to protect other resources before developing minerals.
In Macheng forest offered the main advantages, while land offered the main disadvantages; other FPNR were ranked in the middle. In reality, Macheng has abundant mineral resources; therefore, the preference should be to develop minerals after land protection and restoration. Simultaneously, forests could be fully expanded to optimise forest park construction and develop forest-related tertiary industries.
Luotian and Yingshan were similar in that their superior resources are ecologically related to water, forests, and wetlands, whereas their inferior resources are related to land and minerals. These are mountainous and hilly areas with scarce cultivated land and low mineral content. Therefore, their policies should focus on ecological protection and the active development of green-related industries.
The most advantageous resources in Xishui were land and water, and the topography (alluvial plains) makes it suitable for land development.
The most advantageous resource in Huangmei was land. Other resources were ranked low, except for minerals. Huangmei contains a national wetland park in Longgan Lake and abundant gypsum reserves. Therefore, Huangmei should implement an ecological protection policy to solve its ecological and pollution problems, and then properly develop its cultivated land. Huangmei produces green gypsum minerals with improved functional potential.
Huangzhou is an urban area in Huanggang with high population density. Although the functional potential of cultivated land was found to be high, its per-capita amount was low. Therefore, resources and the environment should be actively restored by protecting existing cultivated land to create a better ecological environment in urban areas and provide green resources for its citizens.
Tuanfeng had the lowest functional potential for natural resources. Land protection and environmental restoration should be actively conducted, after which secondary and tertiary industries that do not affect natural resources should be developed.
5. Discussion
5.1. Policy implications
We evaluated the current characteristics of the natural resources in Huanggang, China. The result of the comprehensive evaluation was the FPNR, which was defined as the development suitability and utilisation potential of natural resources under the current situation. A high FPNR indicates that the resource is suitable for development and vice versa. The results revealed the relative advantages and disadvantages of natural resources in each county. To translate these evaluations into specific policies, the actual local situation was considered. On this basis, relevant policies for Huanggang in terms of natural resources management were identified. These recommendations will facilitate policy consistency at multiple levels of government, thereby contributing to achieving macro SDGs. After Huanggang released the 14th Five-Year Plan and Long-Range Objectives through 2035, various plans related to natural resources have been introduced. In the plan for ecology and the environment, the main elements related to natural resources in Huanggang are water and soil conservation and biodiversity. In the Hubei Province plan for minerals, Huanggang is the second city in the mineral recharge area and is mainly a successor rather than a fully-fledged supplier. We collated the position and needs of each county in the plan, and identified natural resources development priorities based on the evaluation results ().
Table 4. Policy implications for natural resource development in Huanggang City.
5.2. Index system principle
The evaluation index system established in this study is oriented towards sustainable development and is directed towards developing and utilising natural resources. Owing to the different research subjects and available information, the index systems of other regions should change according to the actual situation. The index system is the basis of a comprehensive evaluation that relies on an evaluator’s understanding of the relationship between human survival, development, and the economy (Hussain et al., Citation2022). The selection process should include the following principles:
Operability. The index is spatially operable, meaning that the data can be transformed into quantitative spatial plane data (Jin et al., Citation2018). In addition, the data must be accessible. Counties are the basic geographic units in China’s main functional area planning, and county data are easy to obtain. Therefore, the main indices used in this study were county-related parameters.
Comparability. The magnitude of each index value should be uniformly comparable and the meaning should be linearly distributed after normalisation. Some nonlinearly distributed metrics should satisfy a linear distribution after manual scoring. For example, the field surface slope in the land category was scored as 1–5 according to the relevant criteria (where the score corresponds to the slope: ≤ 2, 2–6, 6–15, 15–25, > 25).
Difference. The contents of different indices should not be repeated and should point to different characteristics.
Comprehensiveness. Indices should be as comprehensive as possible. We prioritised the determination of the criterion layer framework for each natural resources and then established an index system by referring to the references and specifications within this framework.
5.3. Limitations
The main contribution of this study lies in the accentuation of distinct resource characteristics across various categories instead of formulating a comprehensive evaluation system. This approach will empower different departments to efficiently utilise their existing evaluation results or unique evaluation systems, paving the way for rapid and comprehensive evaluation. However, expecting a single expert to evaluate all natural resources is deemed unscientific because of an individual’s in-depth expertise in their own field and potential shortcomings in others. Thus, establishing individual methods for each resource, in line with the practicalities of natural resources management in China, is a more appropriate approach. Nevertheless, potential risks, such as overlooking the interconnections between natural resources and duplicating indicators, can occur, which require careful consideration during the construction of indicator systems via the AHP method.
However, this evaluation still contains elements of subjectivity, which arises from factors such as the index system, index values, and AHP weights. Issues related to the index system are discussed in Section 5.2. AHP weights are prone to fluctuations depending on the biases of the experts. Different regulations in various countries have led to disputes over index values. Given that human activities invariably affect natural resources, subjectivity in comprehensive evaluation is inevitable. Moreover, managers usually exhibit certain developmental preferences and may lean towards ecological protection driven by political pressures. This bias indirectly affects evaluators, who are expected to align their evaluations with managers’ preferences, resulting in recommendations being disregarded contrary to officials’ views. Hence, there is a pressing need for further research to devise ways to achieve objective evaluation to the extent possible.
This evaluation was conducted under the constraints of the current situation. When resource restoration or protection is implemented, or certain conditions are improved, the functional potential of natural resources will increase. Suitable development does not imply disorderly development. Resource development must meet environmental protection and ecological requirements. Therefore, a comprehensive evaluation must be dynamically updated according to changing situations. After implementing our recommendations, Huanggang needs to be re-evaluated, and new recommendations made. Constant re-evaluation can identify weaknesses in the development of natural resources and ultimately achieve high-quality development.
5.4. Future recommendations
A comprehensive evaluation of natural resources based on MCDA in the spatial plane is well suited for situations that require a comprehensive spatial assessment. For instance, in the case of Huanggang, an inland riverside district, the spatial outcomes derived from this evaluation can serve as guidelines for future spatial planning concerning natural resources. When applying this methodology to other regions, a key aspect requiring improvement is the reconstruction of the index system. While previous principles can serve as references, careful consideration should be given to the selection of appropriate indices that align with the local economy, legal framework, and regulations. This approach yielded distinctive assessment results tailored to each specific area.
We propose a method based on the spatial plane location that can obtain an evaluation result at every position. However, the accuracy of the results depended on the accuracy of the original data. As much of the data in this study were from county-level regions, the evaluation results are appropriate at the county-level. More detailed evaluation results could be obtained if lower-level regional data were available.
A future study will evaluate different natural resources polygons. Natural resources such as water, forests, land, wetlands, and minerals can be identified and divided into different polygons in the plane, at which point they can be analysed separately in the plane. In this way, different natural resource polygons can obtain their own evaluation results for single categories of natural resources, and the comprehensive evaluation results will contain the interactions among various natural resources. For example, a polygon with a low score will result in a lower comprehensive evaluation score within a region; polygons in a region that achieve high scores in the evaluation of single categories of natural resources will not be suitable for development after a comprehensive evaluation. This study yields valuable insights for both practical applications and policy decisions.
6. Conclusions
In this study, we developed a comprehensive evaluation method for natural resources based on spatial plane location and evaluated the natural resources of Huanggang City. We found that the southern alluvial plain has good potential for mineral and land development; however, it is crucial to manage and control water and soil pollution. The northern mountainous and hilly regions are well suited for the growth of green ecological industries, particularly those associated with water, forests, and wetlands; however, it is necessary to focus on the restoration of wildlife habitats and river shorelines. These findings offer practical recommendations that can significantly enhance the development and protection of the natural resources, thereby fostering high-quality regional development and achieving the SDGs.
Multicriteria decision analysis in the spatial plane is a valuable tool for rapidly assessing the current characteristics of natural resources and generating spatial analysis results that are useful to decision makers. This method focuses on the specific characteristics of different resource categories, and can be applied to small-scale administrative regions. However, the accuracy of the results depends on the accuracy of the original data. Future work will benefit from lower-level regional data and data based on natural resources polygons, which will provide a comprehensive evaluation of natural resources at each spatial location and will be of great significance for the precise development of new policies.
Abbreviations
| AHP | = | analytic hierarchy process |
| CI | = | comprehensive evaluation index |
| EWM | = | entropy weight method |
| FPNR | = | functional potentiality of natural resource |
| GIS | = | geographic information system |
| MCDA | = | multi-criteria decision analysis |
| OWA | = | ordered weighted averaging method |
| SDGs | = | Sustainable Development Goals |
| TOPSIS | = | technique for order preference by similarity to ideal solution |
Author contributions statement
Xuebo Weng: methodology, software, validation, formal analysis, investigation, data curation, writing-original draft preparation; Xianbin Shi: conceptualisation, methodology, writing-review and editing, funding acquisition; Xiaoning Zhou: conceptualisation, methodology, validation, investigation, writing-review and editing; Shuai Leng: validation, software, visualisation; Jingmeng Huang: writing-review and editing, project administration, funding acquisition; Shaonan Peng: validation, data curation, visualisation. All authors have read and agreed to the published version of the manuscript.
Acknowledgments
We would like to thank Baishu Guo at China University of Geosciences and Xiaoqiang Chen at Hubei University for their help during the paper preparation. We thank the anonymous referees for their comments on the article.
Disclosure statement
No potential conflict of interest was reported by the author(s).
Data availability statement
The achievement data of this paper has been uploaded to ScienceDB (doi: 10.57760/sciencedb.18532).
Additional information
Funding
References
- Al-Shammari, M. M. A., Al-Shamma’a, A. M., Al Maliki, A., Hussain, H. M., Yaseen, Z. M., & Armanuos, A. M. (2021). Integrated water harvesting and aquifer recharge evaluation methodology based on remote sensing and geographical information system: Case study in Iraq. Natural Resources Research, 30(3), 2119–2143. https://doi.org/10.1007/s11053-021-09835-3
- Behzadian, M., Khanmohammadi Otaghsara, S., Yazdani, M., & Ignatius, J. (2012). A state-of the-art survey of TOPSIS applications. Expert Systems with Applications, 39(17), 13051–13069. https://doi.org/10.1016/j.eswa.2012.05.056
- Bibri, S. E., Krogstie, J., & Kärrholm, M. (2020). Compact city planning and development: Emerging practices and strategies for achieving the goals of sustainability. Developments in the Built Environment, 4, 100021. https://doi.org/10.1016/j.dibe.2020.100021
- Bjørn, A., Chandrakumar, C., Boulay, A.-M., Doka, G., Fang, K., Gondran, N., Hauschild, M. Z., Kerkhof, A., King, H., Margni, M., McLaren, S., Mueller, C., Owsianiak, M., Peters, G., Roos, S., Sala, S., Sandin, G., Sim, S., Vargas-Gonzalez, M., & Ryberg, M. (2020). Review of life-cycle based methods for absolute environmental sustainability assessment and their applications. Environmental Research Letters, 15(8), 083001. https://doi.org/10.1088/1748-9326/ab89d7
- Brown, D. G., Verburg, P. H., Pontius, R. G., & Lange, M. D. (2013). Opportunities to improve impact, integration, and evaluation of land change models. Current Opinion in Environmental Sustainability, 5(5), 452–457. https://doi.org/10.1016/j.cosust.2013.07.012
- Caglar, A. E., Avci, S. B., Ahmed, Z., & Gökçe, N. (2024). Assessing the role of green investments and green innovation in ecological sustainability: From a climate action perspective on European countries. Science of the Total Environment, 928, 172527. https://doi.org/10.1016/j.scitotenv.2024.172527
- Caglar, A. E., Avci, S. B., Daştan, M., & Destek, M. A. (2024). Investigation of the effect of natural resource dependence on environmental sustainability under the novel load capacity curve hypothesis. International Journal of Sustainable Development & World Ecology, 31(4), 431–446. https://doi.org/10.1080/13504509.2023.2296495
- Caglar, A. E., Daştan, M., Bulut, E., & Marangoz, C. (2024). Evaluating a pathway for environmental sustainability: The role of competitive industrial performance and renewable energy consumption in European countries. Sustainable Development, 32(3), 1811–1824. https://doi.org/10.1002/sd.2755
- Caglar, A. E., Destek, M. A., & Manga, M. (2024). Analyzing the load capacity curve hypothesis for the Turkiye: A perspective for the sustainable environment. Journal of Cleaner Production, 444, 141232. https://doi.org/10.1016/j.jclepro.2024.141232
- Caglar, A. E., Gökçe, N., & Şahin, F. (2024). Sustaining environment through municipal solid waste: Evidence from European Union economies. Environmental Science and Pollution Research, 31(4), 6040–6053. https://doi.org/10.1007/s11356-023-31494-5
- Cai, Y. M., Meng, C., Zhou, J. C., Feng, W. L., Li, J. C., & Dong, C. (2022). Research on the integrated evaluation indicator system of natural resources. Science of Surveying & Mapping, 47(10), 168–175. https://doi.org/10.16251/j.cnki.1009-2307.2022.10.022
- Chen, S. Y., Liu, N., Xiao, L., Gong, Y. W., & Xiao, Y. (2022). Comprehensive evaluation of environmental dimension reduction of multi-type islands: A sustainable development perspective. Environmental Science and Pollution Research, 29(14), 20947–20962. https://doi.org/10.1007/s11356-021-17240-9
- Chenery, H. B., Sherman, R., & Moshe, S. (2015). Industrialization experience. In Q. Wu & S. B. Wang (Eds.) Industrialization and growth: A comparative study (Vol. 2). Shanghai People’s Publishing House.
- Chopra, R., Magazzino, C., Shah, M. I., Sharma, G. D., Rao, A., & Shahzad, U. (2022). The role of renewable energy and natural resources for sustainable agriculture in ASEAN countries: Do carbon emissions and deforestation affect agriculture productivity? Resources Policy, 76, 102578. https://doi.org/10.1016/j.resourpol.2022.102578
- Dai, J., Guo, L., & Liu, M. B. (2020). Study on evaluation of intensive use of agricultural land in Huanggang City. Hubei Agricultural Sciences, 59(3), 33–37. https://doi.org/10.14088/j.cnki.issn0439-8114.2020.03.007
- Dimple Singh, P. K., Yadav, M., Kothari, K. K., Bhakar, S. R., & Bhakar, S. R. (2024). Multi-criteria decision analysis for groundwater potential zones delineation using geospatial tools and analytical hierarchy process (AHP) in Nand Samand catchment, Rajasthan, India. Environment, Development, and Sustainability, 26(6), 14003–14037. https://doi.org/10.1007/s10668-023-03177-1
- Ding, Z., & Shen, M. (2019). Study on the bearing capacity of geological environment in Huanggang City based on analytic hierarchy process and variation coefficient method. Resources Environment and Engineering, 33(S1), 70–74. https://doi.org/10.16536/j.cnki.issn.1671-1211.2019.S1.014
- Drobne, S., & Lisec, A. (2009). Multi-attribute decision analysis in GIS: Weighted linear combination and ordered weighted averaging. Informatica, 33(4), 459–474. www.informatica.si/index.php/informatica/article/view/263
- Dumanski, J., & Pieri, C. (2000). Land quality indicators: Research plan. Agriculture, Ecosystems and Environment, 81(2), 93–102. https://doi.org/10.1016/S0167-8809(00)00183-3
- El-Araby, A., Sabry, I., & El-Assal, A. (2022). A comparative study of using MCDM methods integrated with entropy weight method for evaluating facility location problem. Operational Research in Engineering Sciences: Theory and Applications, 5(1), 121–138. https://doi.org/10.31181/oresta250322151a
- Fahmi, A., Abdullah, S., Amin, F., & Khan, M. S. A. (2019). Trapezoidal cubic fuzzy number Einstein hybrid weighted averaging operators and its application to decision making. Soft Computing, 23(14), 5753–5783. https://doi.org/10.1007/s00500-018-3242-6
- Fennessy, M. S., Jacobs, A. D., & Kentula, M. E. (2007). An evaluation of rapid methods for assessing the ecological condition of wetlands. Wetlands, 27(3), 543–560. https://doi.org/10.1672/0277-5212(2007)27[543:AEORMF]2.0.CO;2
- Firozjaei, M. K., Nematollahi, O., Mijani, N., Shorabeh, S. N., Firozjaei, H. K., & Toomanian, A. (2019). An integrated GIS-based ordered weighted averaging analysis for solar energy evaluation in Iran: Current conditions and future planning. Renewable Energy, 136, 1130–1146. https://doi.org/10.1016/j.renene.2018.09.090
- Ge, L. S., & Xia, R. (2020). Research on comprehensive investigation work system of natural resources. Journal of Natural Resources, 35(9), 2254–2269. https://doi.org/10.31497/zrzyxb.20200917
- Hauer, G., Cumming, S., Schmiegelow, F., Adamowicz, W., Weber, M., & Jagodzinski, R. (2010). Tradeoffs between forestry resource and conservation values under alternate policy regimes: A spatial analysis of the western Canadian boreal plains. Ecological Modelling, 221(21), 2590–2603. https://doi.org/10.1016/j.ecolmodel.2010.07.013
- Hirai, T., & Comim, F. (2022). Measuring the sustainable development goals: A poset analysis. Ecological Indicators, 145, 109605. https://doi.org/10.1016/j.ecolind.2022.109605
- Huang, I. B., Keisler, J., & Linkov, I. (2011). Multi-criteria decision analysis in environmental sciences: Ten years of applications and trends. Science of the Total Environment, 409(19), 3578–3594. https://doi.org/10.1016/j.scitotenv.2011.06.022
- Huang, L., Solangi, Y. A., Magazzino, C., & Solangi, S. A. (2024). Evaluating the efficiency of green innovation and marketing strategies for long-term sustainability in the context of environmental labeling. Journal of Cleaner Production, 450, 141870. https://doi.org/10.1016/j.jclepro.2024.141870
- Hussain, M. A., Zhang, S., Muneer, M., Moawwez, M. A., Kamran, M., & Ahmed, E. (2022). Assessing and mapping spatial variation characteristics of natural hazards in Pakistan. The Land, 12(1), 140. https://doi.org/10.3390/land12010140
- Irfan, M., Elavarasan, R. M., Ahmad, M., Mohsin, M., Dagar, V., & Hao, Y. (2022). Prioritizing and overcoming biomass energy barriers: Application of AHP and G-TOPSIS approaches. Technological Forecasting & Social Change, 177, 121524. https://doi.org/10.1016/j.techfore.2022.121524
- Jiang, Z., Liu, Z., Xu, J., Wu, M., Xie, X., & Hou, Y. (2021). An integrated energy system evaluation method based on FAHP-EWM-TOPSIS. 2021 IEEE 4th International Electrical and Energy Conference (CIEEC) (pp. 1–6). https://doi.org/10.1109/CIEEC50170.2021.9510670
- Jianing, P., Bai, K., Solangi, Y. A., Magazzino, C., & Ayaz, K. (2024). Examining the role of digitalization and technological innovation in promoting sustainable natural resource exploitation. Resources Policy, 92, 105036. https://doi.org/10.1016/j.resourpol.2024.105036
- Jin, G., Deng, X. Z., Zhao, X. D., Guo, B. S., & Yang, J. (2018). Spatiotemporal patterns in urbanization efficiency within the Yangtze River economic belt between 2005 and 2014. Journal of Geographical Sciences, 28(8), 1113–1126. https://doi.org/10.1007/s11442-018-1545-2
- Jin, G., Guo, B. S., Cheng, J. H., Deng, X. Z., & Wu, F. (2022). Layout optimization and support system of territorial space: An analysis framework based on resource efficiency. Acta Ecologica Sinica, 77(3), 534–546. https://doi.org/10.11821/dlxb202203003
- Jorge-García, D., & Estruch-Guitart, V. (2022). Comparative analysis between AHP and ANP in prioritization of ecosystem services—A case study in a rice field area raised in the Guadalquivir Marshes (Spain). Ecological Informatics, 70(9), 101739. https://doi.org/10.1016/j.ecoinf.2022.101739
- Kim, H. N., & Ryu, H. (2022). Estimating the economic value of change in ecosystem habitat quality in South Korea using an integrated environmental and economic analysis. The Land, 11(12), 2249. https://doi.org/10.3390/land11122249
- Kumar, R., Singh, S., Bilga, P. S., Jatin Singh, J., Singh, S., Scutaru, M.-L., Pruncu, C. I., & Pruncu, C. I. (2021). Revealing the benefits of entropy weights method for multi-objective optimization in machining operations: A critical review. Journal of Materials Research and Technology, 10, 1471–1492. https://doi.org/10.1016/j.jmrt.2020.12.114
- Li, J., Chen, X., Kurban, A., Van de Voorde, T., De Maeyer, P., & Zhang, C. (2021). Identification of conservation priorities in the major basins of Central Asia: Using an integrated GIS-based ordered weighted averaging approach. Journal of Environment Manage, 298, 113442. https://doi.org/10.1016/j.jenvman.2021.113442
- Li, T., Chen, T. Y., & Hui, B. H. (2022). Economic value of forest ecosystem services in Huangshan City Based on meta-analysis. SCIENTIA GEOGRAPHICA SINICA, 42(12), 2179–2188. https://doi.org/10.13249/j.cnki.sgs.202212.014
- Li, W. W., Wang, J. X., Zhou, X. D., & Zhou, S. L. (2020). Research on connotation and evaluation index of intensive use of natural resources. Territory & Natural Resources Study, 2, 12–14. https://doi.org/10.16202/j.cnki.tnrs.2020.02.004
- Lin, G., Fu, J., & Jiang, D. (2021). Production–living–ecological conflict identification using a multiscale integration model based on spatial suitability analysis and sustainable development evaluation: A case study of Ningbo, China. The Land, 10(4), 383. https://doi.org/10.3390/land10040383
- Liu, T. K., Jia, M. M., & Ma, P. Z. (2021). Research on economical and intensive utilization and management of water resources of the yellow river under strengthen rigid constraint. Yellow River, 43(7), 70–73. https://doi.org/10.3969/j.issn.1000-1379.2021.08.013
- Lourdes, K. T., Hamel, P., Gibbins, C. N., Sanusi, R., Azhar, B., & Lechner, A. M. (2022). Planning for green infrastructure using multiple urban ecosystem service models and multicriteria analysis. Landscape and Urban Planning, 226, 104500. https://doi.org/10.1016/j.landurbplan.2022.104500
- Lu, X. H., Zhang, Y. W., Lin, C. R., & Wu, F. (2021). Analysis and comprehensive evaluation of sustainable land use in China: Based on sustainable development goals framework. Journal of Cleaner Production, 310, 127205. https://doi.org/10.1016/j.jclepro.2021.127205
- Menció, A., Folch, A., & Mas-Pla, J. (2010). Analyzing hydrological sustainability through water balance. Environmental Management, 45(5), 1175–1190. https://doi.org/10.1007/s00267-010-9461-y
- Mendoza, G. A., & Martins, H. (2006). Multi-criteria decision analysis in natural resource management: A critical review of methods and new modelling paradigms. Forest Ecology & Management, 230(1), 1–22. https://doi.org/10.1016/j.foreco.2006.03.023
- Minea, I., Boicu, D., Chelariu, O.-E., Iosub, M., & Enea, A. (2022). Assessment of recharge capacity potential of groundwater using comparative multi-criteria decision analysis approaches. Journal of Geographical Sciences, 32(4), 735–756. https://doi.org/10.1007/s11442-022-1970-0
- Mukhametzyanov, I. (2021). Specific character of objective methods for determining weights of criteria in MCDM problems: Entropy, CRITIC and SD. Decision Making: Applications in Management and Engineering, 4(2), 76–105. https://doi.org/10.31181/dmame210402076i
- Peng, Y., Zhu, Z. L., Tan, X. Y., Liu, X., Xiang, L. J., & Wu, F. (2023). Evaluation and forewarning of resources and environment carrying capacity in Hubei Province from the perspective of pressure, support and regulation. Environmental Science & Technology, 46(10), 209–218. https://doi.org/10.19672/j.cnki.1003-6504.0881.23.338
- Qiu, Q. Q., Zhong, L. R., & Song, Y. B. (2022). Study on comprehensive evaluation methods of natural resources in Jiangsu Province. Science of Surveying & Mapping, 47(8), 70–78. https://doi.org/10.16251/j.cnki.1009-2307.2022.08.009
- Ronald, R. Y. (1988). On ordered weighted averaging aggregation operators in multicriteria decision making. IEEE Transactions on Systems, Man, and Cybernetics, 18(1), 183–190. https://doi.org/10.1109/21.87068
- Salih, M. M., Zaidan, B. B., Zaidan, A. A., & Ahmed, M. A. (2019). Survey on fuzzy TOPSIS state-of-the-art between 2007 and 2017. Computers & Operations Research, 104, 207–227. https://doi.org/10.1016/j.cor.2018.12.019
- Sannigrahi, S., Chakraborti, S., Joshi, P. K., Keesstra, S., Sen, S., Paul, S. K., Kreuter, U., Sutton, P. C., Jha, S., & Dang, K. B. (2019). Ecosystem service value assessment of a natural reserve region for strengthening protection and conservation. Journal of Environment Manage, 244, 208–227. https://doi.org/10.1016/j.jenvman.2019.04.095
- Sarkar, P., Kumar, P., Vishwakarma, D. K., Ashok, A., Elbeltagi, A., Gupta, S., & Kuriqi, A. (2022). Watershed prioritization using morphometric analysis by MCDM approaches. Ecological Informatics, 70, 101763. https://doi.org/10.1016/j.ecoinf.2022.101763
- Shao, H., Liu, D. D., Wang, X. F., Yin, Z. Q., Wang, Y., Xing, B., Wan, L. Q., & An, Y. L. (2022). Exploration and practice of double evaluation supported by comprehensive investigation of natural resources exemplified by the national ecological civilization demonstration area in Chengde City. Mineral Exploration, 13(4), 517–525. https://doi.org/10.20008/j.kckc.202204016
- Solangi, Y. A., Alyamani, R., & Magazzino, C. (2024). Assessing the drivers and solutions of green innovation influencing the adoption of renewable energy technologies. Heliyon, 10(9), E30158. https://doi.org/10.1016/j.heliyon.2024.e30158
- Świąder, M., Lin, D., Szewrański, S., Kazak, J. K., Iha, K., van Hoof, J., Belčáková, I., & Altiok, S. (2020). The application of ecological footprint and biocapacity for environmental carrying capacity assessment: A new approach for European cities. Environmental Science & Policy, 105, 56–74. https://doi.org/10.1016/j.envsci.2019.12.010
- Thomas, L. S. (1990). How to make a decision: The analytic hierarchy process. European Journal of Operational Research, 48(1), 9–26. https://doi.org/10.1016/0377-2217(90)90057-I
- Ullah, K. M., & Mansourian, A. (2016). Evaluation of land suitability for urban land-use planning: Case study Dhaka City. Transactions in GIS, 20(1), 20–37. https://doi.org/10.1111/tgis.12137
- Wang, X. Q., & Pu, L. J. (2021). A review of the classification of natural resources. Resources Science, 43(11), 2203–2214. https://doi.org/10.18402/resci.2021.11.05
- Wang, Y., Zhang, D., Ji, Q., & Shi, X. (2020). Regional renewable energy development in China: A multidimensional assessment. Renewable and Sustainable Energy Reviews, 124, 109797. https://doi.org/10.1016/j.rser.2020.109797
- Xiang, W. X., Chen, M. L., Liu, M. H., Cai, S. W., Chen, C. X., & Chen, J. X. (2022). Pollutants distribution characteristics and environmental quality evaluation of water in a Typical Urban Lake, Huanggang City. Resources Environment and Engineering, 36(3), 280–285. https://doi.org/10.16536/j.cnki.issn.1671-1211.2022.03.003
- Xu, M. J., Niu, R. Q., Yang, K., & Duan, S. Z. (2021). A weighted clustering model for land eco-environmental sensitivity evaluation. Science of Surveying & Mapping, 46(10), 118–129. https://doi.org/10.16251/j.cnki.1009-2307.2021.10.016
- Xu, Y., Yang, L., Zhang, C., & Zhu, J. Q. (2023). Comprehensive evaluation of water ecological environment in watersheds: A case study of the Yangtze River economic belt, China. Environmental Science and Pollution Research, 30(11), 30727–30740. https://doi.org/10.1007/s11356-022-24333-6
- Yager, R. R. (1996). Quantifier guided aggregation using OWA operators. International Journal of Intelligent Systems, 11(1), 49–73. https://doi.org/10.1002/(SICI)1098-111X(199601)11:1<49:AID-INT3>3.0.CO;2-Z
- Yang, B., Wu, Q. S., Li, Z. H., & Tan, J. (2023). Thoughts on natural resources survey and monitoring in the perspective of ecological civilisation. Natural Resource Economics of China, 36(7), 34–43. https://doi.org/10.19676/j.cnki.1672-6995.000915
- Yang, Z., Yu, T., Hou, Q., Xia, X., Feng, H., Huang, C., Wang, L., Lv, Y., & Zhang, M. (2014). Geochemical evaluation of land quality in China and its applications. Journal of Geochemical Exploration, 139, 122–135. https://doi.org/10.1016/j.gexplo.2013.07.014
- Yavuz, E., Kilic, E., & Caglar, A. E. (2023). A new hypothesis for the unemployment-environment dilemma: Is the environmental Phillips curve valid in the framework of load capacity factor in Turkiye? environment, development and sustainability. Environment, Development, and Sustainability. https://doi.org/10.1007/s10668-023-04258-x
- Ye, S., Wei, C., Wang, Z., Wang, H., & Chai, J. (2021). Resources and environment carrying capacity, social development and their decoupling relationship: A case study of Hubei Province, China. International Journal of Environmental Research Public Health, 18(23), 12312. https://doi.org/10.3390/ijerph182312312
- Zaman-Ul-Haq, M., Kanwal, A., Gardezi, A. A., Fatima, H., Saqib, Z., Bokhari, S. A., Nasr, E. A., Ahmad, S., & Shafiq, M. (2022). Assessing spatial-temporal changes in monetary values of urban ecosystem services through remotely sensed data. Sustainability, 14(22), 15136. https://doi.org/10.3390/su142215136
- Zhang, X., & Duan, X. (2024). Evaluating water resource carrying capacity in Pearl River-West River economic belt based on portfolio weights and GRA-TOPSIS-CCDM. Ecological Indicators, 161, 111942. https://doi.org/10.1016/j.ecolind.2024.111942
- Zhang, X. Q., He, S. Y., & Yang, Y. (2021). Evaluation of wetland ecosystem services value of the yellow river delta. Environmental Monitoring and Assessment, 193(6), 353. https://doi.org/10.1007/s10661-021-09130-x
- Zhong, C. M. (2018). On several issues of green development under ecological carrying capacity in Yangtze River economic belt. Journal of China University of Geosciences (Social Sciences Edition), 18(6), 8–22. https://doi.org/10.16493/j.cnki.42-1627/c.2018.06.002
- Zuo, S., Hu, L., & Yang, L. N. (2022). Research on the construction of comprehensive evaluation index system of natural resources. Forest Resources Management, 3, 12–18. https://doi.org/10.13466/j.cnki.lyzygl.2022.03.002