
ABSTRACT
TFEBexplorer is a comprehensive web-tool to study genes modulated by the transcription factor EB (TFEB), a master regulator of lysosomal biogenesis and autophagy, that integrates multiple datasets following genetic perturbation of TFEB with experimentally validated and bioinformatically-predicted binding sites across multiple species. Given one gene, or a set of genes of interest, in input (query), the results are displayed in different panels, each reporting results of experiments or bioinformatic analyses.
TFEBdb is a unique resource for those interested in understanding the effect of TFEB on a set of genes of interest. The database offers an intuitive interface and results are displayed in an easy-to-interpret format offering information on the expression changes following inducible over-expression, knock-down and knock-out of TFEB across cell lines and species together with experimentally validated and bioinformatically predicted binding sites in the proximal promoter of the gene(s) of interest. The TFEBdb homepage can be found at http://tfeb.tigem.it.
Abbreviations ChIP-seq: chromatin-immunoprecipitation followed by sequencing; CLEAR: Coordinated Lysosomal Expression and Regulation; DMEM: Dulbecco’s modified Eagle’s medium; FDR: False discovery rate; GEPs: gene expression profiles; PBS: phosphate-buffered saline; RMA: robust multiarray average TFEB: The transcription factor EB; TFEBdb: database; ToA: time of activation of the gene.
Introduction
The transcription factor EB (TFEB) is a basic Helix-Loop-Helix (bHLH) leucine zipper transcription factor, member of the microphthalmia/ transcription factor E (MiT/TFE) family of transcription factors, which also includes MITF, TFE3, and TFEC proteins [Citation1]. As in other bHLH-Zip transcription factors, the MiT/TFE members share a basic DNA-binding domain and an HLH plus a leucine zipper domain important for dimerization [Citation2]. The MiT/TFE members form homo- and hetero-dimers to activate transcription [Citation3]. TFEB and TFE3 play a crucial role in the regulation of lysosomal and autophagy-related genes [Citation4–6], while MITF regulates melanosomal biogenesis [Citation7]. All three genes play an important role in the regulation of cell metabolism [Citation8]. TFEB activity is largely controlled by its subcellular localization, which is mainly regulated by mechanistic target of rapamycin complex 1 (mTORC1)-dependent phosphorylation; in presence of nutrients, TFEB is mainly cytoplasmic but, upon stresses such as nutrient depletion, inactivation of the mTORC1 complex causes its rapid translocation to the nucleus [Citation9–11] where it activates a tissue-specific transcriptional program. The binding to DNA of the MiT/TFE members is mediated by the recognition of the E-box sequence (CACGTG) [Citation1], which is typically recognized by other bHLH-Zip transcription factors. However, MiT/TFE factors preferentially recognize a particular type of E-box that is flanked by specific nucleotide residues, known as the “Coordinated Lysosomal Expression and Regulation” (CLEAR) motif (GTCACGTGAC) [Citation12-14].
The TFEB-regulated transcriptional program coordinates the biogenesis of autophagosomes and lysosomes inducing a striking increase in autophagy flux via regulation of the expression of genes involved in different steps of the autophagy process, such as genes important for: autophagy initiation (BECN1, WIPI1, ATG9B, and NRBF2); autophagosome membrane elongation (GABARAP, MAP1LC3B, and ATG5); substrate capture (SQSTM1) and autophagosomes trafficking and fusion with lysosomes (UVRAG, RAB7) [Citation5]; and lysosomal biogenesis and degradation [Citation4, Citation5, Citation14]. Two family members, TFE3 and MITF, were also identified as regulators of autophagy and lysosomal biogenesis [Citation15, Citation16]. In addition to its role in lysosomal biogenesis and autophagy, TFEB is involved in the regulation mTORC1 signaling [Citation17], in the integrated stress response (ISR) [Citation13, Citation18] and in the peripheral clock machinery [Citation19]. Despite many target genes are similarly modulated by TFEB in different cell types, TFEB has been shown to have specialized functions in different tissues: in the liver, in addition to lysosomal function and autophagy, TFEB regulates genes important for the control of lipid metabolism, including lipophagy and fatty acid oxidation [Citation20] [Citation21]; in osteoclasts, TFEB deletion specifically results in impaired function and increased bone mass, suggesting that TFEB regulates bone resorption [Citation22]; in skeletal muscle, TFEB directly controls glucose homeostasis and mitochondrial biogenesis independently from its role in the modulation of autophagy [Citation23]; in macrophages, TFEB and TFE3 control the expression and secretion of pro-inflammatory cytokines, thus modulating inflammatory and immune responses ([Citation24, Citation25]).
Owing to its role as a master modulator of cell catabolism, transient induction of TFEB-mediated transcriptional programs may have beneficial effects in several disease conditions characterized by impaired lysosomal activity or autophagy [Citation26]. Several compounds have been suggested as a potential TFEB activator: polyphenols such as curcumin are able to activate the TFEB-lysosome pathway for induction of autophagy [Citation34]; “resveratrol” attenuates endothelial oxidative injury by inducing autophagy via the activation of TFEB [Citation35]; trehalose has been recently demonstrated to induce TFEB nuclear translocation and autophagy in models of motoneuron degeneration [Citation36], and it was found also able to reduce atherosclerotic plaque burden [Citation37].
On the other hand, constitutive TFEB overexpression or activation has been linked to cystic disorders and cancer. Indeed, up-regulation or constitutive activation of MiT/TFE genes supports the energy-demanding growth and metabolism of different types of cancer, including renal cell carcinoma (RCC), Birt–Hogg–Dubé syndrome, pancreatic ductal adenocarcinoma, and melanoma [Citation25] [Citation29-33]. The Open Targets Platform [Citation27, Citation28], includes more than 300 diseases and/or phenotypes associated to TFEB, such as cystic disorders and cancer.
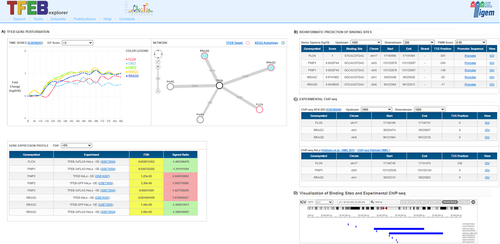
Despite the intricate network of genes regulated by TFEB and the pleiotropic roles this transcription factor plays in numerous tissues, as of today, no systematic collection of genes modulated and targeted by TFEB exists. Here, we present the first online tool, available at http://tfeb.tigem.it, and schematically depicted in .
Figure 1. The TFEBexplorer interface. Given a set of genes in input (query), the results of the Search are displayed in different panels, each reporting results of experiments or bioinformatic analyses: (A) TFEB gene perturbation panel includes: a time-series box with expression changes of the query genes over time following inducible TFEB overexpression in human HEK293 cells; a network box with a network representation showing query genes as nodes (red=direct TFEB targets; cyan filled circles=autophagy pathway gene); and a gene expression profile box listing the significant differentially expressed genes in the query in the available human and mouse transcriptional datasets; (B) Bioinformatic prediction panel reports the genome-wide predictions of TFEB CLEAR binding sites; (C) Experimental ChIP-seq panel lists the TFEB binding sites in HEK293 and HeLa cells identified in published Chromatin immunoprecipitation followed by sequencing experiments (ChIP-seq); (D) Visualization of binding site panel is opened by clicking on the “IGV” link and shows a gene-wise graphical representation of the binding sites in panel B and C along the genomic region in the Integrative Genome Browser.
Results and Discussion
TFEBexplorer is built on an integrated collection of experimental data and bioinformatics predictions to yield the first comprehensive resource for the study of genes regulated by TFEB. The databases includes the following publicly available dataset: (i) 18 gene expression profiles (GEPs) in human (GSE16267, GSE73055, GSE73054) and 36 GEPs in mouse (GSE41139, GSE41140, GSE62975, GSE62976, GSE62977, GSE63376) following TFEB overexpression, down-regulation or knock-down; (ii) two TFEB chromatin-immunoprecipitation followed by sequencing (ChIP-seq) in two human cell lines (HeLa [Citation14] and Hek293[Citation13]) and (iii) a genome-wide bioinformatic prediction of TFEB binding sites across three species (human, mouse and rat). A brief description and relevant references for each dataset is reported in Supplementary Table 1 and in the online website (“Datasets” section).
In brief, human specific datasets include time-resolved transcriptome profiles (GSE98247) of a stable clone with inducible overexpression of TFEB in Hek293 cells [Citation13]; transcriptional profiles in HeLa cells following wild-type TFEB transient transfection (GSE16267) and stable overexpression of the fusion construct TFEB-GFP ([Citation38], GSE73055). We also added a previously unpublished dataset of transcriptional profiles in HeLa cells with stable expression of the fusion construct TFEB-3xFLAG from the CMV promote measured by Affymetrix Gene-Chip hybridization experiments (GSE73054).
Mouse specific datasets include transcriptional profiles from three tissues: (liver) wild-type mice or mice knocked-out for PPARα (peroxisome proliferator activated receptor alpha) were injected with an adenoviral vector that expresses human TFEB (HDAd-TFEB) under control of the liver-specific promoter PEPCK [Citation21] (GSE41139 and GSE41140); (skeletal muscle) gene expression profiles include both TFEB gain- and loss-of-function approaches (SuperSeries-GSE62980): the overexpression of Tcfeb, (the murine homolog of the human TFEB), in adult mouse skeletal muscle was achieved by means of intramuscular viral-mediated gene transfer using the adeno-associated virus (AAV) system (GSE62975); for loss-of-function studies (GSE62976), a mouse model with muscle-specific conditional TFEB KO was generated by crossing Tcfeb floxed [Citation21] with MLC1f-Cre transgenic mice [Citation39]. Muscle fibers from TFEB KO animals and controls were then profiled by Affymetrix microarray experiments, as previously described [Citation39]; (kidney), transcriptome analysis by Affymetrix microarrays was performed on total RNA of kidneys from mice overexpressing Tcfeb in the kidney (heterozygous KSP_CRE/KSP_Tcfeb mice) and from matched controls (KSP_CRE mice) at two different time-points of mice development (P0 and P14) (GSE62977, GSE63376) [Citation40].
The TFEBexplorer web-tool is divided into six sections: “Search”, “Tools”, “Datasets”, “Help”, “Publications” and “Contacts”:
The “Search” page is the home page, and it allows the user to choose the species of interest and to enter a set of genes in the Query Box as official gene symbols or aliases (up to 10 genes are allowed), which autocompletes for ease of use. The gene set of interest in the search box is automatically updated if the user decides to change the species of interest. Examples of gene sets are also present in the home page; by clicking on the example gene set name, the gene list is automatically added to the Query Box . The results of the query are displayed across different panels as depicted in :
the “TFEB gene perturbation” panel reports the expression dynamics of the genes following inducible overexpression of TFEB in Hek293 cells (GSE98247, [Citation13]). The time-course gene expression profile experiments were performed by RNA-seq on total RNA extracted at time 0, in presence of tetracycline to evaluate the basal expression level of TFEB, and at consecutive time point (from 6 to 90hrs) following the removal of tetracycline to evaluate the effect of TFEB overexpression. In this section, there is also a TFEB network diagram to graphically depict the genes that are significantly modulated in the time-series data; significance is measured by a Gaussian Process (GP) approach [Citation41] and results can be filtered by GP score. In the network diagram, TFEB targets [Citation13] are shown as red circles. By clicking on the circle it is possible to access the gene card website; an additional link is shown for those genes belonging to the KEGG autophagy [Citation42] pathway, which are shown as filled cyan circles.
the “Gene Expression Profile” panel shows the fold-change, as signed ratio value, for the query genes (negative values colored in green for inhibition, and positive values colored in red for induction) in all of the gene expression dataset included in TFEBexplorer, together with its significance reported as False Discovery Rate (FDR).
the “Bioinformatic Prediction of binding sites” panel reports the predicted CLEAR binding motives in the proximal promoter of the query genes.
the “Experimental ChIP-seq” panel lists the chromosomal coordinates of binding sites in the promoter as found in two different ChIP-seq datasets performed in HeLa [Citation14] and Hek293 [Citation13]. The panel is interactive with gene names hyperlinked to the GeneCard website [Citation43], the dataset ID hyperlinked to the GEO expression omnibus database [Citation44], while the promoter sequence and the bioinformatically predicted CLEAR binding sites can be visualized by clicking on the “IGV” hyperlink.
The “Tools” page is used to perform analyses on multiple genes and includes three type of analyses: by clicking on “Prediction of Binding Sites”, it is possible to paste a list of genes of interest (with no limit in length of the gene list) and obtain the bioinformatics prediction of the CLEAR binding sites in their promoters; the “Gene Expression Profile” tool allows to query a set of genes (no limit in number) to check the effect of TFEB perturbations on its expression across all the datasets included in the database; finally by clicking on the “Time Series TFEB Network” it is possible to visualise the genes modulated by TFEB overexpression (dataset GSE98247) as a network.
The “Dataset” page displays a version of Supplementary Table 1 with hyperlinks to download any of the datasets used in the database. The “Help” page displays a document with a step-by-step guide to the use of the database, while the “Contacts” page reports name and email of contact persons for queries related to the use of the database.
We introduced two demo sets as query examples for all the tools: “mTOR regulators” and “Autophagy-lysosomal pathway”. In details, in the “mTOR regulators” gene set, we included the previously established TFEB targets [Citation17] RRAGC, RRAGD, FLCN, and two homologous FLCN-binding proteins FNIP1 and FNIP2, which are known modulators of mTORC1 [Citation45]; the “autophagy-lysosomal” set includes two lysosomal hydrolases (GNS and NEU1), three v-ATPase subunits (ATP6V0D1, ATP6V0A1 and ATPV1H), the lysosomal membrane protein LAMP1, the vesicle mediated protein VPS18 [Citation14], and the small GTPase RAB7 [Citation14].
We believe TFEBexplorer will be a useful and user-friendly resource for researchers interested in the physiological and pathological roles of TFEB and the MiT/TFE members and in the transcriptional regulation of lysosomal biogenesis and autophagy.
We will update the database yearly by introducing relevant datasets as these become available. In a future version of TFEBexplorer, we will also add data for two additiona species Caenorhabditis elegans [Citation21], and Oryzias latipes [Citation46](i.e. Medaka fish).
Materials and Methods
The website (http://tfeb.tigem.it/) is implemented in PHP and Javascript. The database is implemented in PostgreSQL. This resource is usable with any browser () and has been optimized to be used with PC or Tablet.
Table 1. Browser compatibility
Bioinformatic prediction of TFEB binding sites and visualization of results
To bioinformatically identify the CLEAR motifs in gene promoters, we downloaded genomic sequences including 2000 bp upstream and 500 bp downstream from the transcription start site (TSS) for all the known genes for human, mouse, and rat species. The sequences were downloaded from UCSC Genome Browser website [Citation47, Citation48] using these genome versions: hg19 for human, mm10 for mouse and rn6 for rat. For the determination of the binding sites, we applied the package match-PWM by Biostrings with default parameters while the threshold for the PWM Score (min.score) was set to 0.85. [Citation49]. The position-weight matrix of the TFEB consensus binding sequence was identified using the Weeder tool 2.0, as previously described [Citation13] and it can be downloaded from the “DATASETS” section of the TFEBexplorer website. The algorithm match-PWM establishes an enrichment score (PWM Score) for each sequence referred to the TFEB matrix. The PWM score ranges from 0 to 1, with 1 corresponding to the maximum score that can be obtained with that PWM. For more details on the PWM method and a recent review we refer the reader to the relevant literature [Citation50]. The visualization of the binding sites on the website is performed by making use of the Integrative Genomics Viewer (IGV), a high-performance, easy-to-use, interactive tool for the visual exploration of genomic data developed by the BROAD Institute [Citation51, Citation52].
Generation of the TFEB-3xFLAG dataset
HeLa cells were grown in Dulbecco’s Modified Eagle’s Medium (DMEM, Euroclone), supplemented with 10% heat- inactivated Fetal Bovine Serum (FBS, Hyclone). Cells were seeded in six-well plates at 10% confluence before transfection by using PolyFect Transfection Reagent (Qiagen) or Interferin (PolyPlus transfection) according to the manufacturer’s protocols. Transfectants for full-length TFEB-3xFLAG were selected with 1 mg/ml G418 (Sigma) to generate the TFEB-3xFLAG stable clones. To perform the transcriptome study, HeLa TFEB-FLAG stable clones [Citation4] were grown in DMEM+ 10% FBS+ 1% Pen/Strep+ 1% Glutamine. The cells were seeded in triplicate in basal condition and RNA extraction was performed by using Qiagen Mini Kit, following the manufacturer’s instructions. 3 µg of total RNA was reverse transcribed to single-stranded cDNA with a special oligo (dT)24 primer containing a T7 RNA promoter site, added 3’ to the poly-T tract, prior to second strand synthesis (One Cycle cDNA Synthesis Kit by Affymetrix). Biotinylated cRNAs were then generated, using the GeneChip IVT Labeling Kit (Affymetrix). 20 µg of biotinylated cRNA was fragmented and 10 µg hybridized to the Affymetrix Human Genome U133 Plus 2.0 Array [HG-U133_Plus_2] as described in [Citation53]. Low-level analysis to convert probe level data to gene level expression data was done using robust multiarray average (RMA) implemented using the RMA function of the Affymetrix package of the Bioconductor project [Citation54] in the R programming language [Citation55]. The low-level analysis for the BAMarray tool was performed using the MAS5 method, implemented using the corresponding function of the same Bioconductor package. For each gene, a t-test was used on RMA normalized data to determine if there was a significant difference in expression between the two groups of microarrays (TFEB-FLAG stable clones versus control cells). P-value adjustment for multiple comparisons was done with the FDR of Benjamini-Hochberg [Citation56]. The BAM analysis was performed with BAMarray v3.0. The analysis was performed on MAS5 normalized array data using the default settings except for the following parameters: accuracy was set to high; clustering was set to manual with a value of 25, and variance was set to unequal. In this statistical analysis the threshold for statistical significance chosen was a FDR < 0.05. The Expression data from HeLa cells stable clones overexpressing TFEB-3xFLAG are available in the GEO database as GSE73054.
Author contributions
RDC collected, analysed and interpreted data, and wrote the manuscript. DS: performed the experiments. GG: bioinformatics and data analysis. DC: programming and development of the web-tool. GN, CDM, AB: provided critical discussion and contributed to manuscript writing. DdB: conceived the original idea, contributed to manuscript writing and supervised the work.
Supplemental Material
Download MS Excel (9.3 KB)Acknowledgments
We thank the TIGEM Informatics Core and Gennaro Oliva for helping with the website.
Disclosure statement
There is no conflict of interest
Supplemental Material
Supplemental data for this article can be accessed online at https://doi.org/10.1080/27694127.2022.2097822
Additional information
Funding
References
- Hemesath TJ. microphthalmia, a critical factor in melanocyte development, defines a discrete transcription factor family. Genes Dev. 1994;8(22):2770–80.
- Steingrimsson E. Mitf, Tfe3, two members of the Mitf-Tfe family of bHLH-Zip transcription factors, have important but functionally redundant roles in osteoclast development. Proc Natl Acad Sci U S A. 2002;99(7):4477–82.
- Pogenberg V. Restricted leucine zipper dimerization and specificity of DNA recognition of the melanocyte master regulator MITF. Genes Dev, 2012. 26;(23):2647–58.
- Sardiello M. A gene network regulating lysosomal biogenesis and function. Science. 2009;325(5939):473–7.
- Settembre C. TFEB links autophagy to lysosomal biogenesis. Science. 2011;332(6036):1429–33.
- Martina JA. The nutrient-responsive transcription factor TFE3 promotes autophagy, lysosomal biogenesis, and clearance of cellular debris. Sci Signal. 2014;7(309):ra9.
- Hodgkinson CA. Mutations at the mouse microphthalmia locus are associated with defects in a gene encoding a novel basic-helix-loop-helix-zipperprotein. Cell. 1993;74(2):395–404.
- Puertollano R. The complex relationship between TFEB transcription factor phosphorylation and subcellular localization. EMBO J. 2018;37(11).
- Martina JA. MTORC1 functions as a transcriptional regulator of autophagy by preventing nuclear transport of TFEB. Autophagy. 2012;8(6):903–14.
- Settembre C. A lysosome-to-nucleus signalling mechanism senses and regulates the lysosome via mTOR and TFEB. The EMBO journal. 2012;31(5):1095–108.
- Roczniak-Ferguson A. The transcription factor TFEB links mTORC1 signaling to transcriptional control of lysosome homeostasis. Sci Signal. 2012:5(228):ra42.
- Sardiello M. Sulfatases and sulfatase modifying factors: an exclusive and promiscuous relationship. Human molecular genetics. 2005;14(21):3203–17.
- Gambardella G. GADD34 is a modulator of autophagy during starvation. Sci Adv. 2020;6(39).
- Palmieri M. Characterization of the CLEAR network reveals an integrated control of cellular clearance pathways. Human molecular genetics. 2011;20(19):3852–66.
- Ploper D, De Robertis M. The MITF family of transcription factors: Role in endolysosomal biogenesis, Wnt signaling, and oncogenesis. Pharmacol Res. 2015;99:36–43.
- Martina JA. Novel roles for the MiTF/TFE family of transcription factors in organelle biogenesis, nutrient sensing, and energy homeostasis. Cell Mol Life Sci. 2014;71(13):2483–97.
- Di Malta C. Transcriptional activation of RagD GTPase controls mTORC1 and promotes cancer growth. Science. 2017;356(6343):1188–1192.
- Martina JA. TFEB and TFE3 are novel components of the integrated stress response. EMBO J. 2016;35(5):479–95.
- Baird TD, Wek RC. Eukaryotic initiation factor 2 phosphorylation and translational control in metabolism. Adv Nutr. 2012;3(3):307–21.
- Chen L. Fasting-induced hormonal regulation of lysosomal function. Cell Res. 2017.
- Settembre C. TFEB controls cellular lipid metabolism through a starvation-induced autoregulatory loop. Nat Cell Biol. 2013;15(6):647–58.
- Ferron M. A RANKL-PKCbeta-TFEB signaling cascade is necessary for lysosomal biogenesis in osteoclasts. Genes Dev. 2013;27(8):955–69.
- Mansueto G. Transcription Factor EB Controls Metabolic Flexibility during Exercise. Cell Metab. 2017;25(1):182–196.
- Visvikis O. Innate host defense requires TFEB-mediated transcription of cytoprotective and antimicrobial genes. Immunity. 2014;40(6):896–909.
- Brady OA, Martina JA, Puertollano R. Emerging roles for TFEB in the immune response and inflammation. Autophagy. 2018;14(2):181–189.
- Napolitano G. BallabioA. TFEB at a glance. J Cell Sci. 2016;129(13):2475–81.
- Koscielny G. Open Targets: a platform for therapeutic target identification and validation. Nucleic Acids Res. 2017;45(D1):D985–D994.
- Carvalho-Silva D. Open Targets Platform: new developments and updates two years on. Nucleic Acids Res. 2019;47(D1):D1056–D1065.
- Napolitano G. A substrate-specific mTORC1 pathway underlies Birt-Hogg-Dubesyndrome. Nature. 2020;585(7826):597–602.
- Cancer Genome Atlas Research N. Comprehensive molecular characterization of clear cell renal cell carcinoma. Nature. 2013;499(7456):43–9.
- Perera RM. Transcriptional control of autophagy-lysosome function drives pancreatic cancer metabolism. Nature. 2015;524(7565):361–5.
- Garraway LA. Integrative genomic analyses identify MITF as a lineage survival oncogene amplified in malignant melanoma. Nature. 2005;436(7047):117–22.
- Xu J, Zhang XQ, Zhang Z. Transcription factor EB agonists from natural products for treating human diseases with impaired autophagy-lysosome pathway. Chin Med. 2020;15(1):123.
- Zhang J. Curcumin targets the TFEB-lysosome pathway for induction of autophagy. Oncotarget. 2016;7(46):75659–75671.
- Zhou X. Resveratrol attenuates endothelial oxidative injury by inducing autophagy via the activation of transcription factor EB. Nutr Metab (Lond). 2019;16:42.
- Rusmini P. Trehalose induces autophagy via lysosomal-mediated TFEB activation in models of motoneuron degeneration. Autophagy. 2019;15(4):631–651.
- Evans TD. TFEB and trehalose drive the macrophage autophagy-lysosome system to protect against atherosclerosis. Autophagy. 2018;14(4):724–726.
- Nnah IC. TFEB-driven endocytosis coordinates MTORC1 signaling and autophagy. Autophagy. 2019;15(1):151–164.
- Bothe GW. Selective expression of Cre recombinase in skeletal muscle fibers. Genesis. 2000;26(2):165–6.
- Calcagni A. Modelling TFE renal cell carcinoma in mice reveals a critical role of WNT signaling. Elife. 2016;5.
- Kalaitzis AA, Lawrence ND. A simple approach to ranking differentially expressed gene expression time courses through Gaussian process regression. BMC Bioinformatics. 2011;12:180.
- Kanehisa M. KEGG for integration and interpretation of large-scale molecular data sets. Nucleic acids research . 2012;40(Database issue):D109–14.
- Safran M. GeneCards 2002: towards a complete, object-oriented, human gene compendium. Bioinformatics. 2002;18(11):1542–3.
- Edgar R, Domrachev M, LashAE. Gene Expression Omnibus: NCBI gene expression and hybridization array data repository. Nucleic Acids Res. 2002;30(1):207–10.
- Liu, GY, Sabatini DM. mTOR at the nexus of nutrition, growth, ageing and disease. Nat Rev Mol Cell Biol. 2020;21(4):183–203.
- Cinque L. MiT/TFE factors control ER-phagy via transcriptional regulation of FAM134B. EMBO J. 2020;39(17):e105696.
- Lee CM. UCSC Genome Browser enters 20th year. Nucleic Acids Res. 2020;48(D1):D756–D761.
- Kent WJ. The human genome browser at UCSC. Genome Res. 2002;12(6):996–1006.
- Wasserman WW, Sandelin A. Applied bioinformatics for the identification of regulatory elements. Nat Rev Genet. 2004;5(4):276–87.
- Ambrosini G. Insights gained from a comprehensive all-against-all transcription factor binding motif benchmarking study. Genome Biol. 2020;21(1):114.
- Thorvaldsdottir H, Robinson JT, Mesirov JP. Integrative Genomics Viewer (IGV): high-performance genomics data visualization and exploration. Brief Bioinform. 2013;14(2):178–92.
- Robinson JT. Integrative genomics viewer. Nat Biotechnol. 2011;29(1):24–6.
- De Cegli R. A mouse embryonic stem cell bank for inducible overexpression of human chromosome 21 genes. Genome biology. 2010;11(6):R64.
- Gentleman RC. Bioconductor: open software development for computational biology and bioinformatics. Genome biology. 2004;5(10):R80.
- Piccolboni D. The role of echo-laparoscopy in abdominal surgery: five years’ experience in a dedicated center. Surgical endoscopy. 2008;22(1):112–7.
- Klipper-Aurbach Y. Mathematical formulae for the prediction of the residual beta cell function during the first two years of disease in children and adolescents with insulin-dependent diabetes mellitus. Med Hypotheses. 1995;45(5):486–90.