
 ?Mathematical formulae have been encoded as MathML and are displayed in this HTML version using MathJax in order to improve their display. Uncheck the box to turn MathJax off. This feature requires Javascript. Click on a formula to zoom.
Abstract
Objective
Brain-computer interfaces (BCIs) realize the information transmission between the brain and the external world. Visual evoked potential (VEP) based BCIs have gained widespread attention in the field of multi-instruction interaction attributed to their high information transfer rate (ITR). However, improving the IT R and the practicability is challenging for existing VEP based BCIs due to factors such as the encoding efficiency and the calibration time. To address this issue, this study proposed a new encoding method employing narrow-band random sequences and provided a large dataset for VEP based brain-computer interfaces.
Methods
Narrow-band random sequences are random sequences with a specific frequency band. The dataset encompasses three paradigms that employ three kinds of encoding sequences: narrow-band sequences with a frequency band of 15 ∼ 25 Hz (NBRS-15), narrow-band random sequences with a frequency band of 8 ∼ 16 Hz (NBRS-8), and sequences utilizing joint frequency-phase modulation method with a frequency range of 8–15.8 Hz (JFP M-8).
Results
The dataset includes 59-channel electroencephalogram (EEG) data for 100 subjects, and the quality of the dataset is validated through quantitative analyses on EEG characteristics and classification performance.
Conclusion
The proposed large dataset includes various paradigms, and the data quality has been validated, which can contribute to the development of VEP based BCIs. The dataset is available from https://doi.org/10.6084/m9.figshare.24864243.
1. Introduction
Brain computer interfaces (BCIs) establish an information channel between the human brain and external devices by utilizing the brain signals [Citation1]. Since first introduction by Vidal in 1973 [Citation2], BCIs have undergone significant development in recent years [Citation3]. To acquire brain signals, researchers applied invasive or non-invasive methods. Among various types of brain signals, electroencephalogram (EEG) has become the most utilized technique due to its convenience and safety [Citation4,Citation5]. In an EEG based BCI, the EEG signals of subjects are encoded by a specific paradigm, and the encoded EEG data are decoded by algorithms to infer the intention of subjects.
To evaluate the theoretical performance of a BCI system, the information transfer rate (ITR) has been widely employed, which incorporates factors such as the number of instructions, accuracy, and the system speed [Citation1]. Owing to the high encoding efficiency and signal-to-noise ratio (SNR), visual evoked potential (VEP) based BCIs have demonstrated the highest ITR [Citation6]. In a VEP based BCI, the brightness of each target (or instruction) is modulated by a specific sequence, enabling multiple-instruction control by aligning one unique encoding sequence to each target. According to the encoding sequences, VEP based BCIs with multiple targets primarily fall into two categories: steady-state visual evoked potential (SSVEP) based BCIs, and code-modulated visual evoked potential (c-VEP) based BCIs [Citation7,Citation8].
SSVEP based BCIs have been the most widely studied VEP based BCIs in recent years, which employ the joint frequency-phase method (JFPM) for encoding [Citation9]. By associating each target with a specific frequency and phase, SSVEP based BCIs easily achieve systems with multiple targets. Furthermore, since the evoked SSVEP signals are frequency-tagged and phased-locked, SSVEP based BCIs are well-suited for calibration-free systems using unsupervised algorithms such as multivariate synchronization index (MSI) [Citation10], canonical correlation analysis (CCA) [Citation11], and filter-bank canonical correlation analysis (FBCCA) [Citation12], etc. Nevertheless, SSVEP based BCIs encounter the challenge of encoding a large number of targets. To address this issue, SSVEP based BCIs usually adopt two strategies: increase the frequency resolution, or utilize a multiple-step encoding. Increasing the frequency resolution can increase the number of targets without altering the frequency band of the encoding sequences. For instance, if the frequency interval of targets changes from 0.2 Hz to 0.1 Hz, the number of targets will be doubled [Citation13]. However, systems with high frequency resolution typically require a calibration session before use. The decoding algorithms for a calibration-free SSVEP based BCI only detect the frequency features of the evoked SSVEP signals, while the frequency resolution cannot be guaranteed with a short data. Therefore, to decode the SSVEP signals in a short data length, it is essential to utilize the phase features by calibration algorithms such as task-related component analysis (TRCA) [Citation6], task-discriminant component analysis (TDCA) [Citation14], etc. In addition, the upper limit of the number of targets encoded by this method is constrained by the frequency band and the refresh rate of the monitor. By contrast, multiple-step encoding concatenates multiple sequences in a series, and each sequence can be regarded as a code element [Citation15,Citation16]. The encoding sequence of each target comprises multiple code elements, allowing the system to decode SSVEP signals in multiple steps. Since code elements utilized in each step require lower frequency resolution, multiple-step encoding is more suitable for calibration-free methods. This method can achieve theoretically infinite targets by increasing the number of code elements, while the SSVEP based BCI utilizing this method achieved lower ITR comparing to increasing the frequency resolution method since more code elements lead to long time for one detection.
In comparison with SSVEP based BCIs, c-VEP based BCIs demonstrated higher encoding efficiency when encoding more targets. C-VEP based BCIs can be mainly categorized into two types: multiple targets encoded by one sequence, or each target encoded by one unique sequence. In a standard c-VEP based BCI, multiple targets are encoded through the circular shifts of a single pseudorandom sequence [Citation17,Citation18]. Therefore, subjects only need to calibrate with one target, and the c-VEP templates for the other targets can be derived from the c-VEP signals associated with that single target through circular shifts. Since one sequence can encode multiple targets, the calibration time can be significantly reduced, and the number of targets can be further increased by employing multiple sequences [Citation19–21]. Nevertheless, the sequences used in standard c-VEP based BCIs require good auto-correlation and cross-correlation properties, such as m sequences, Gold sequences, etc., which constrains the available sequence options, and the number of targets is limited by the length of the sequence. By contrast, some studies encoded each target by one random sequence, and the number of targets is theoretically more than the standard circular shift method. Since each target is corresponding to one unique sequence, subjects need to traverse all targets for calibration. To reduce the calibration time, some studies proposed generative model to generate EEG from sequences, such as EEG2Code model [Citation22] and reconvolution model [Citation23]. By utilizing a generative model, subjects can achieve the control of a large instruction set with a short calibration session.
Although c-VEP based BCIs have theoretically higher encoding efficiency than SSVEP based BCIs, there are still some limitations in sequence selections and unsupervised algorithms. Most c-VEP based BCIs necessitate a calibration session for template generation [Citation18]. Some studies proposed c-VEP based BCIs with unsupervised calibration, or eliminated the calibration session, but these systems need prior knowledge such as the relative lag of c-VEP signals between different trials [Citation24,Citation25], or an initialization at the beginning of the experiment to warm up the generative model [Citation26]. Predicting results with prior knowledge usually requires a long time for each trial, and the generative model requires suitable sequences for initialization. To the best of our knowledge, there is no calibration-free c-VEP based BCIs without any requirements of prior knowledge or an initialization. To achieve a calibration-free c-VEP BCI, a novel type of encoding sequences, narrow-band random sequence, is proposed in this study. The frequency band of narrow-band random sequences is constrained in a specific narrow-band to simplify the frequency band energy distribution. The narrow-band random sequence aims to combine the advantages of SSVEP and c-VEP based BCIs. By employing narrow-band random sequences, the evoked c-VEP signals are supposed to have more precise frequency features, and the relationship between the c-VEP signal and the corresponding encoding sequence is supposed to be more distinct, which makes narrow-band random sequence suitable for unsupervised algorithms. In addition, narrow-band random sequences can encode more targets than JFPM method since the features of each narrow-band random sequence are distributed in a narrow-band rather than a single frequency.
This study presents a large open dataset with 100 subjects for VEP based BCIs with 40 targets, including three paradigms: c-VEP based BCIs employing narrow-band random sequences with a frequency band of 15 ∼ 25 Hz (NBRS-15), c-VEP based BCIs employing narrow-band random sequences with a frequency band of 8 ∼ 16 Hz (NBRS-8), and SSVEP based BCIs employing JFPM sequences with a frequency band of 8–15.8 Hz (JFPM-8). For all paradigms, 59-channel EEG data were recorded using the same devices, and the temporal precision of the visual stimulation was verified before experiments. To the best of our knowledge, this is one of the largest full-head EEG datasets for VEP based BCIs, comparing with the BETA dataset (70 subjects) [Citation27] and the eldBETA dataset (100 elder subjects) [Citation28]. This dataset can be used for: (1) evaluating the performance of decoding algorithms; (2) comparing the performance of narrow-band random sequences and JFPM sequences; (3) other analysis on features such as individual difference, age, gender, etc.
2. Materials and methods
2.1. Experimental design
2.1.1. Visual stimulus pattern
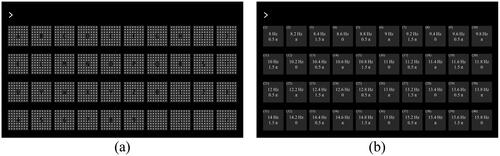
As illustrated in , the VEP based BCI system was a BCI speller with 40 targets, including alphabets (A-Z), numbers (0–9), and symbols (space, comma, and period). In the experiments, on-type grid stimulus was adopted for visual stimulation. In , for each target, the dark gray background area remained unchanged with a brightness of approximately 25 cd/m2 during the stimulation, while the brightness of the light gray grids (stimulation area) was modulated by a unique encoding sequence with a range of 25 ∼ 200 cd/m2. The stimulus was regarded as on-type since the brightness of the stimulation areas was consistently higher than the background areas [Citation29].
Figure 1. (a) The graphical user interface of the system. (b) The placement of sequences. The number marked at the left top of each target is the index of sequences. For JFPM method, the frequency and the initial phase are presented in the Middle of each target.
2.1.2. Encoding sequences
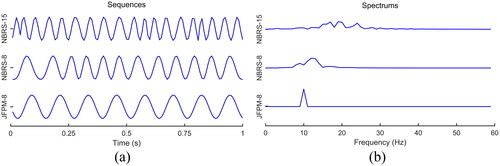
Three kinds of encoding sequences were employed in the experiments: NBRS-15, NBRS-8, and JFPM-8. The brightness of each target was modulated by the value of a single sequence with a range of 0 ∼ 1 (0: black, 1: white). For narrow-band random sequences, the frequency band energy of the sequences was concentrated in the range of 15 ∼ 25 Hz (NBRS-15) or 8 ∼ 16 Hz (NBRS-8). For JFPM-8, the frequencies of the sequences ranged from 8 to 15.8 Hz with a frequency interval of 0.2 Hz, and the phase interval between adjacent frequencies was set at 0.5 π. The placement of the sequences was labelled in .
illustrates the examples of three kinds of sequences. For narrow-band random sequences, the length of the sequences was 120 digits, and the refresh rate of the monitor was 120 Hz. Each narrow-band random sequence was generated from a broad-band random sequence by passing through an elliptic band-pass filter. To deal with the boundary effects caused by the band-pass filter, the broad-band sequence was lengthened to 360-digit long by repeating three times before filtering. After band-pass filtering, the central 120 digits were extracted for the subsequent procedures. To make all the sequences have the same amplitude, the filtered sequences were element-wise divided by its envelopes and normalized to the range of 0 ∼ 1. The sequence generation program was designed with MATLAB (MathWorks, Inc.). Beginning with an initial narrow-band random sequence, the sequences for encoding were selected according to the cross-correlation coefficients. A new sequence was retained if the absolute values of cross-correlation coefficients between the new sequence and the existing sequences were under a predefined threshold, otherwise the sequence was discarded, and one new sequence was generated. If the sequence generation program could not find a new sequence within an hour, then this generation process was regard as time out, all existing sequences were discarded, the predefined threshold was increased by 0.05, and the sequences were generated again. Finally, NBRS-15 and NBRS-8 were generated with cross-correlation coefficients ranging from −0.25 ∼ 0.25, −0.3 ∼ 0.3, respectively.
Figure 2. (a) Sequence examples and (b) the corresponding spectra of three kinds of encoding sequences.
For JFPM-8, the sequences were generated by a sampled sinusoidal stimulation method [Citation30,Citation31] as:
(1)
(1)
where f denotes the frequency,
denotes the phase, and i denotes the index of the sequence. The refresh rate of the monitor was 120 Hz.
2.1.3. Experimental paradigm
The experimental paradigm was designed with python 3.8 and psychopy toolbox. There were nine blocks of experiments for each subject, including three blocks for each kind of sequence. Each block contained 40 trials traversing all 40 targets. Each trial contained three stages: cue, visual stimulation, and feedback. At the beginning of each trial, one target was highlighted with a red triangle at the bottom as a cue, and the subject was asked to focus on the highlighted target. After the cue, all targets flickered for 4 s, and the subject was asked to avoid eye blinks during the visual stimulation. For NBRS-15 and NBRS-8, since the length of sequences was 120 digits, the sequences were repeated four times to achieve the 4-second stimulation. After the visual stimulation, the result computed using FBCCA algorithm was feedback to the subject. If the result matched the cued target, then the target was highlighted with a green frame. Otherwise the target was highlighted with a red frame. The experiments corresponding to different sequences were presented to the subjects in a random order, and there was a break after each kind of sequences.
2.2. Data description
2.2.1. Subjects
Totally one hundred subjects (32 females, average aged 17.5 years, aged from 7 to 52 years) participated in the experiments. All subjects had normal or corrected to normal vision. EEG data were acquired from the participants for the BCI Controlled Robot Contest in 2023 World Robot Conference. All subjects were asked to read and sign an informed consent form before experiments, and those under the age of 16 were signed by their guardians. The study was approved by the Ethics Committee of Tsinghua University (No. 20230058).
2.2.2. EEG acquisition
EEG data were acquired by a 64-channel wireless EEG cap (Neuracle, Ltd. Changzhou, China) with a sampling rate of 1000 Hz. A total of 59 channels were used for EEG acquisition, and the locations of electrodes can be referenced to the extended 10–20 system. The reference electrode was located at the vertex, and the ground electrode was located at the forehead. Electrode impedances of all electrodes were kept under 20 kΩ during recording. The event triggers were sent using a parallel port at the stimulus onset of each trial. During the experiments, subjects were seated stably in a comfortable chair in an environment with lights on. The distance between the subjects and the monitor was approximately 60 cm.
2.2.3. EEG data
The dataset is freely available from https://doi.org/10.6084/m9.figshare.24864243 (approximately 10.36 GB). The dataset is stored within 10 archives, and all archives contains 100 folders corresponding to a total of 100 subjects (S1, S2, …, S100). Each folder contains three subfolders corresponding to different paradigms (NBRS-15, NBRS-8, JFPM-8). In the subfolder, there is one MATLAB MAT file named “data.mat.” EEG data are stored in a 4-D matrix with a dimension of 59 × 1500 × 3 × 40, indicating the number of channels, data points, number of blocks, and number of targets, respectively. All EEG data were down-sampled to 250 Hz raw data without any further processing. Each data epoch contains 6 s of data, including 1 s before the stimulus onset, 4 s of stimulus, and 1 s after the stimulus.
2.2.4. Supplementary files
The supplementary files are saved in an archive named “SupplementaryFiles.zip,” including information of subjects, channels, and experiments. The information of subjects is recorded in a “sub_info.txt” file, including gender, age, handedness of each subject. The information of channels is recorded in a “channels.loc” file, including the channel index, degree, radius, and label of each channel. The data structure, descriptions about the experiments, and sequence generation method are described in “Readme.pdf.” The values of sequences are saved in “NBRS-15.mat,” “NBRS-8.mat,” and “JFPM-8.mat” with a dimension of 40 × 480 (40 sequences × 120 frames/seconds × 4 s). For 1000-target simulation, there are also two sets of expanded narrow-band random sequences with 1000 sequences saved in “NBRS-15-1000.mat” and “NBRS-8-1000.mat,” which are extended from NBRS-15 and NBRS-8.
2.3. Data analysis
2.3.1. Data preprocessing
The EEG data were preprocessed before further data analysis. First, to remove the power-line noise, all data epochs were filtered using a 50 Hz second-order infinite impulse response notch filter. Next, the data epochs were filtered using a Chebyshev type I band-pass filter. For temporal, spectral, and spatial analysis, data epochs were filtered by band-pass filters with a pass-band of 10 ∼ 90 Hz, 6 ∼ 90 Hz, and 6 ∼ 90 Hz for NBRS-15, NBRS-8, and JFPM-8, respectively. For SNR analysis, the pass-bands for NBRS-15, NBRS-8, and JFPM-8 varied when analysing different components. For fundamental components, the pass-bands were 15 ∼ 25 Hz, 8 ∼ 16 Hz, and 8 ∼ 16 Hz, respectively. For harmonic components, the pass-bands were 25 ∼ 90 Hz, 16 ∼ 90 Hz, and 16 ∼ 90 Hz, respectively. After band-pass filtering, the data before and after the stimulus were discarded. Considering the latency of the visual pathway (defined as τ), data from 1 + τ to 5 + τ seconds of each data epoch were retained, where τ was set as 0.14 s [Citation12] under most situations except evaluating calibration-free performance for narrow-band random sequences. For NBRS-15 and NBRS-8, τ was set to 0.12 s when applying unsupervised algorithms since the templates of narrow-band random sequences already included latencies.
2.3.2. Classification algorithms
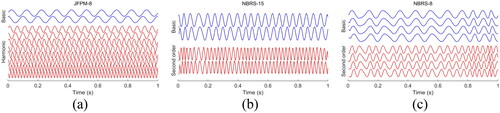
Accuracy and ITR performances were evaluated by supervised and unsupervised algorithms: multi-stimulus task-related component analysis (msTRCA) [Citation32] and filter-bank canonical correlation analysis (FBCCA) [Citation12]. For FBCCA, the reference templates of JFPM-8 were composed of sinusoidal signals at corresponding frequencies along with their harmonic signals. Since NBRS-15 and NBRS-8 could not build reference templates by sinusoidal signals, the reference templates were generated from the encoding sequences. The basic templates were composed of encoding sequences with different latencies, and the basic templates performed element-wise multiplication (also called Hadamard product) with themselves to compose second-order templates to simulate non-linear features. The value and number of the latencies were optimized offline. For NBRS-15, two latencies with an interval of two points were used. For NBRS-8, four latencies with an interval of one point were used. For JFPM-8, five harmonics were used to compose the sinusoidal reference templates. The examples of reference templates are presented in .
Figure 3. The reference templates examples of (a) JFPM-8, (b) NBRS-15, and (c) NBRS-8 when employing FBCCA.
Both msTRCA and FBCCA employed the filter bank method to improve the classification accuracy. A filter bank includes multiple sub-filters with different frequency ranges to extract VEP features in different frequency bands [Citation12]. All sub-filters had the same upper-cut-off frequency, which was 80 Hz, 50 Hz, and 90 Hz for NBRS-15, NBRS-8, and JFPM-8, respectively. Three sub-filters were applied for narrow-band random sequences, and the lower-cut-off frequencies of the sub-filters were [10 Hz, 25 Hz, 40 Hz] and [6 Hz, 14 Hz, 22 Hz] for NBRS-15 and NBRS-8, respectively. Six sub-filters were applied for JFPM-8, and the lower-cut-off frequencies of the sub-filters were [6 Hz, 14 Hz, 22 Hz, 30 Hz, 38 Hz, 46 Hz]. Data epochs were filtered using a filter bank, and the correlation coefficient scores calculated from all sub-filters were weighted and summed to derive a score :
(2)
(2)
where
is the CCA correlation coefficient score of the
sub-band and the
type,
is the weight of the
sub-band.
is defined as:
(3)
(3)
where
and
are the hyperparameter of
and
is the number of sub-bands. For NBRS-15, NBRS-8 and JFPM-8,
and
were [3, 0.5, 3], [2.5, 0.25, 3] and [1.25, 0.25, 6], respectively.
2.3.3. Metrics
Three metrics were analysed for data quality evaluation: signal-to-noise ratio (SNR), classification accuracy, and information transfer rate (ITR).
Similarity index (SMI) was employed in this study to compare the SNR results of VEP signals [Citation33–35]. SMI is defined as:
(4)
(4)
where S is the orthogonal projection of single-trial EEG data onto average EEG templates across all trials corresponding to one sequence, and N is the residual part of the projection.
ITR is one of the most commonly used metrics for evaluating the performance of a BCI with multiple targets, which considers classification accuracy, speed, and the number of targets [Citation1]. ITR is defined as:
(5)
(5)
where M is the number of targets, P is the classification accuracy, and T (in seconds) is the average target selection time. T should include the stimulus time and the gaze shift time from one target to another. The gaze shift time in this paper was estimated as 0.5 s, which is enough for a 40-target BCI online system [Citation6].
3. Data evaluation
3.1. Temporal, spectral, and spatial analysis
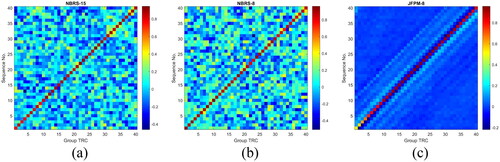
The waveform, spectrum, and spatial features of average EEG task-related components (TRCs) corresponding to the first targets across all trials and subjects are shown in . All results were calculated using a data length of 4 s. To evaluate the EEG features across all subjects, the EEG data were spatially filtered using group task-related component analysis (gTRCA), which maximized the reproducibility of all trials and subjects [Citation36]. present the first 1 s of group TRCs, which demonstrate high correlations between the group TRCs and encoding sequences. As shown in , the spectra also demonstrate the high correlation. present the spatial patterns of group TRCs. Group TRCs of all paradigms were concentrated at the occipital regions. shows the average spectra of group TRCs corresponding to all encoding sequences. The energy of NBRS-15, NBRS-8, and JFPM-8 were concentrated at the range of 15–25 Hz, 8–16 Hz, and 8–15.8 Hz, respectively. In addition, JFPM-8 could also evoke significant harmonic components with clear responses of harmonics. shows the correlation coefficient matrix between group TRCs and the encoding sequences. As shown in the diagonal lines of , group TRCs had high correlation coefficients with the corresponding encoding sequences (0.74 ∼ 0.94, 0.74 ∼ 0.96, 0.51 ∼ 0.96 for NBRS-15, NBRS-8, and JFPM-8, respectively), while the cross-correlation coefficients between group TRCs and other encoding sequences were obviously lower.
Figure 4. EEG group TRCs waveforms, corresponding spectra, and spatial patterns of (a) (d) (g) NBRS-15, (b) (e) (h) NBRS-8, and (c) (f) (i) JFPM-8.
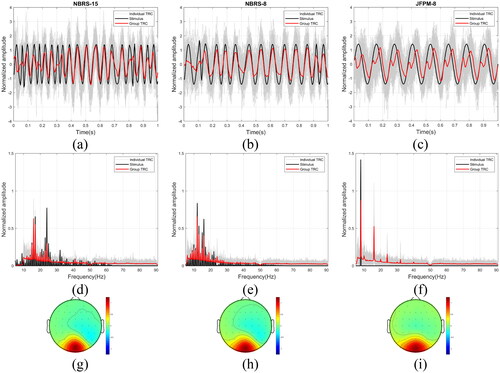
Figure 5. Average spectra of group TRCs corresponding to (a) NBRS-15, (b) NBRS-8, and (c) JFPM-8.
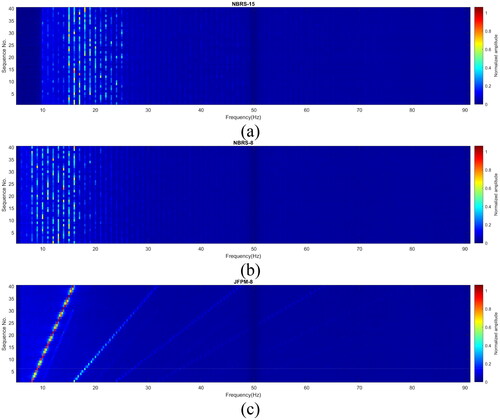
Figure 6. The correlation coefficient matrices between group TRCs and the encoding sequences corresponding to (a) NBRS-15, (b) NBRS-8, and (c) JFPM-8.
3.2. SNR analysis
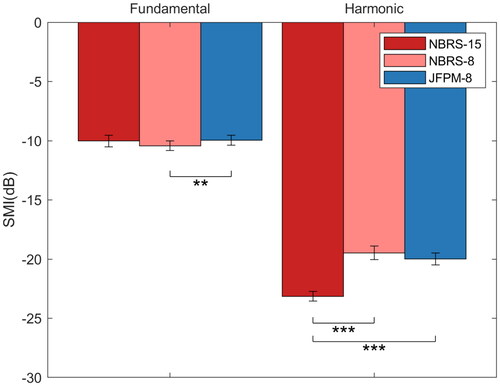
depicts the SMI at Oz of three paradigms, including the results of fundamental and harmonic components. The SMIs of three paradigms were at the same level at the fundamentals (NBRS-15: −10.02 ± 4.91 dB, NBRS-8: −10.43 ± 4.08 dB, JFPM-8: −9.95 ± 4.20 dB), and the pairwise comparison showed a significant difference between SMIs of NBRS-8 and JFPM-8 (t-test, p < 0.01). For the harmonics (NBRS-15: −23.15 ± 4.06 dB, NBRS-8: −19.48 ± 5.72 dB, JFPM-8: −19.99 ± 5.15 dB), the SMIs of NBRS-8 and JFPM-8 were significantly higher than that of NBRS-15 (t-test, p < 0.001), while there was no significant difference between the SMIs of NBRS-8 and JFPM-8 (t-test, p > 0.05).
Figure 7. The SMI of different paradigms, including the results of the fundamental and the harmonic. Error bars indicate the standard errors. Asterisks denote the significance between paradigms (t-test, **: p < 0.01, ***: p < 0.001).
3.3. Accuracy and ITR performance
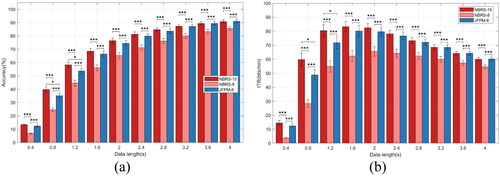
presents the accuracies and ITRs of msTRCA. All the accuracies and ITRs were calculated using the leave-one-out validation method. Compared with JFPM-8, NBRS-8 achieved the higher accuracies and ITRs, while NBRS-15 achieved worse performance. When the data length was 4 s, the accuracies were 83.85 ± 19.80%, 90.27 ± 12.15%, 87.65 ± 16.24% for NBRS-15, NBRS-8, and JFPM-8, respectively. The highest ITR of NBRS-15, NBRS-8, and JFPM-8 were 87.71 ± 54.17 bits/min (data length: 1.2 s), 105.09 ± 64.85 bits/min (data length: 0.8 s), and 95.12 ± 55.86 bits/min (data length: 1.2 s), respectively.
Figure 8. The average (a) classification accuracy and (b) ITR of different paradigms calculated using msTRCA. Error bars indicate the standard errors. Asterisks denote the significance between paradigms (t-test, *: p < 0.05, **: p < 0.01, ***: p < 0.001).
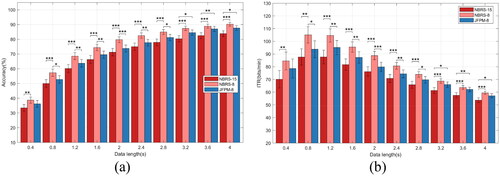
presents the accuracies and ITRs of FBCCA. There was no significant difference between the performance of NBRS-15 and JFPM-8 (t-test, p > 0.05 for both accuracies and ITRs) under most data lengths, and the performances of NBRS-15 were significantly better than those of JFPM-8 when the data length was 0.8 or 1.2 s (t-test, p < 0.05 for both accuracies and ITRs). Nevertheless, the accuracies and ITRs of NBRS-8 were significantly lower than that of the other paradigms under all data lengths. When the data length was 4 s, the accuracies were 90.08 ± 12.55%, 85.66 ± 14.54%, 91.05 ± 11.90% for NBRS-15, NBRS-8, and JFPM-8, respectively. The highest ITR of NBRS-15, NBRS-8, and JFPM-8 were 83.23 ± 36.69 bits/min (data length: 1.6 s), 65.61 ± 33.81 bits/min (data length: 2.0 s), and 80.18 ± 39.70 bits/min (data length: 1.6 s), respectively.
Figure 9. The average (a) classification accuracy and (b) ITR of different paradigms calculated using FBCCA. Error bars indicate the standard errors. Asterisks denote the significance between paradigms (t-test, *: p < 0.05, ***: p < 0.001).
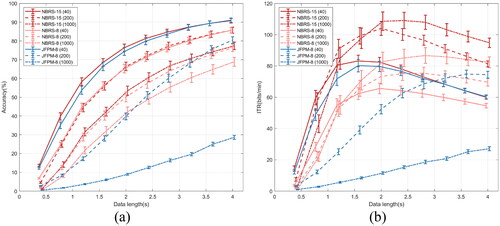
3.4. 1000 target simulation
By utilizing FBCCA, the performance of a system with more targets was simulated. During the simulation, all data epochs were classified using a classifier with up to 1000 classes. Besides the 40 sequences employed for the experiments, more sequences needed to be generated for the simulation as pseudo classes. The generation method was the same as that for the 40-target stimulation. For narrow-band random sequences, 1000 sequences were extended from NBRS-15 and NBRS-8, and the cross-correlation coefficients ranged from −0.5 ∼ 0.5, −0.55 ∼ 0.55, respectively. For JFPM sequences, the frequency band remained consistent with JFPM-8 (8 ∼ 16 Hz), while the frequency intervals were decreased to 0.04 Hz and 0.008 Hz to generate 200 and 1000 targets, respectively.
illustrates the simulated results. For NBRS-15 and NBRS-8, accuracies decreased, and ITRs gradually increased as the number of targets increased. NBRS-15 achieved the highest average ITR of 104.01 ± 44.86 bits/min with a data length of 2 s when the number of targets was 1000. However, for JFPM-8, both accuracies and ITRs decreased as the number of targets increased.
Figure 10. The simulated average (a) classification accuracy and (b) ITR of different paradigms calculated using FBCCA in 200-target and 1000-target simulations. Error bars indicate the standard errors.
4. Conclusion and discussion
This study presents a large dataset for VEP based BCIs, including three paradigms employing different encoding sequences: NBRS-15, NBRS-8, and JFPM-8. The dataset contains high-quality EEG data of 100 subjects. The data evaluation results illustrate that all three paradigms could evoke VEP responses at the occipital region with a high SNR, and the temporal and spectral features of the VEP responses are consistent with the corresponding encoding sequences.
This study introduces narrow-band random sequences as novel encoding sequences for VEP based BCIs. The experiment results present the comparison between the proposed sequences (NBRS-15, NBRS-8) and the most widely applied JFPM sequences (JFPM-8). For the VEP signals, all three paradigms achieved similar SNR performances at the fundamental, while NBRS-15 performed worse at the harmonics since the harmonics of NBRS-15 had a higher and wider frequency band (e.g. second harmonic of NBRS-8 and JFPM-8 is 16 ∼ 32 Hz, while that of NBRS-15 is 30 ∼ 50 Hz), and the amplitude and SNR performed better at lower frequency band [Citation37,Citation38].
The SNR performance could reflect the accuracies and ITRs of the supervised algorithms. NBRS-8 and JFPM-8 performed higher accuracies than those of NBRS-15 due to the lower frequency band. In addition, NBRS-8 had better performance than JFPM-8, which might be attributed to the more complex frequency-phase information of each sequence. For the unsupervised algorithm, as shown in , NBRS-15 performed the best among the three paradigms, followed by JFPM-8, and NBRS-8 performed the worst. This phenomenon could be explained by the interference from the spontaneous brain activities, especially brain activities at the alpha band (8 ∼ 13 Hz). Since unsupervised algorithms such as CCA and FBCCA are not sensitive to phase information, the frequency features are more important for better performance. The frequency band energy distribution of NBRS-8 and JFPM-8 overlapped with the alpha band (8 ∼ 13 Hz). Therefore, the performance might be influenced by spontaneous brain activities, and NBRS-8 performed worse due to the more complex spectral information.
For multi-target simulation, narrow-band random sequences performed superior encoding efficiency. As shown in , JFPM-8 could not encode more targets under the same frequency band, while NBRS-15 and NBRS-8 could achieve more targets and higher ITR simultaneously.
The results of experiments and simulations implicate the practicability of the BCIs employing narrow-band random sequences. Since the c-VEPs modulated by narrow-band random sequences have more complex spectral features than SSVEPs modulated by JFPM, narrow-band random sequences are probably more suitable for asynchronous BCIs. Existing studies have presented that the c-VEP based asynchronous BCIs can achieve fast speed and low false positive rate [Citation39,Citation40], while the performances of the SSVEP based asynchronous BCIs might be influenced by spontaneous brain activities [Citation41]. For a multi-target system, benefited from the high encoding efficiency and the calibration-free algorithm, narrow-band random sequences can be employed in a practical BCI such as a full-size keyboard with 108 keys, a cruise system for wheelchairs or vehicles with multiple destinations, a writing tablet with hundreds of pixels, etc. However, there are also some limitations towards the practical applications of this encoding method. First, although on-type stimulus could enhance the comfort level, VEP based BCI systems can cause visual fatigue after a long-time use. Second, the size of targets is supposed to be smaller when employing more targets, which might decrease the amplitude of c-VEPs, and the decoding performance will be influenced by peripheral targets. Third, as the number of targets increases, the computational efficiency will decrease. When the data length is 4 s, for the 40-target system, the calculation time for each trial can be ignored (NBRS-15: 4.7 ± 0.3 milliseconds, NBRS-8: 6.4 ± 0.6 milliseconds, JFPM-8: 14.6 ± 1.0 milliseconds, processor: Intel Core i7-9700, calculated using MATLAB 2022a). However, when the number of targets increases to 1000, the calculation time for each trial sharply rose (NBRS-15: 73.5 ± 0.3 milliseconds, NBRS-8: 135.2 ± 0.7 milliseconds, JFPM-8: 307.3 ± 5.1 milliseconds), which will significantly influence the system efficiency. To address these limitations, more user-friendly paradigms, decoding models incorporating peripheral information, and optimizations of the decoding algorithms should be developed.
In the future, the dataset can be used in the following areas. First, the dataset is suitable for evaluating the performance of decoding algorithms for VEP based BCIs. The dataset contains 100 subjects, which can help researchers to better evaluate the performance of different algorithms, including different supervised or unsupervised VEP classification algorithms, cross-subject or cross-sequence (cross-frequency) transfer learning algorithms, etc. Second, the dataset can be used to compare the performance between narrow-band random code modulation and JFPM modulation. Researchers can compare the system performances or the simulated multi-target system performances under the same unsupervised algorithms. In addition, the subjects can be divided into different groups according to the criteria such as age, gender etc. Researchers can compare the EEG features between different groups or explore the individual differences.
Supplementary Files.docx
Download MS Word (15.3 KB)Disclosure statement
No potential competing interest was reported by the authors.
Data availability statement
The data and supplementary files that support the findings of this study are openly available in figshare at https://doi.org/10.6084/m9.figshare.24864243, reference number [Citation42].
Additional information
Funding
Notes on contributors
Li Zheng
Li Zheng received the B.E. degree in electronic science and technology from Beijing University of Technology and the Ph.D. degree in circuits and systems from the Institute of Semiconductors, Chinese Academy of Sciences, in 2017 and 2022, respectively. He is currently a Post-Doctoral Fellow at the Institute of Semiconductors, Chinese Academy of Sciences. His research interests include brain-computer interface, biomedical signal processing, and machine learning.
Sen Tian
Sen Tian received the B.E. and M.E. degree in biomedical engineering from Hebei University of Technology, Tianjin, China, in 2016 and 2019, respectively. He is currently employed at Suzhou Nianji Intelligent Technology Co., Ltd. His research interests include brain-computer interface, biomedical signal processing, and machine learning.
Yida Dong
Yida Dong is pursuing a PhD degree in circuits and systems at the Institute of Semiconductors, University of Chinese Academy of Sciences. He received the B.E. degree in electronic science and technology from Beijing Jiaotong University in 2021. His research interests include braincomputer interfaces, EEG signal processing, and deep learning.
Weihua Pei
Weihua Pei received the B.S. degree in electronic information technology and the M.S. degreein optical engineering from Shanxi University, in 1997 and 2002, respectively, and the Ph.D. degree in microelectronics and solid-state electronics from the Institute of Semiconductors, Chinese Academy of Sciences, in 2005. He is currently a Professor with the Institute of Semiconductors and the University of Chinese Academy of Sciences. He is also a member of CEBSIT. His main research interests include bio-electrode and its application on braincomputer interface.
Xiaorong Gao
Xiaorong Gao received his B.S. degree from Zhejiang University in 1986, M.S. degree from Peking Union Medical College in 1989, and Ph.D. degree from Tsinghua University in 1992, after which he taught at Tsinghua University, where he served as Lecturer, Associate Professor, Professor, and Distinguished Professor. His research interests include brain-computer interface and biomedical signal processing.
Yijun Wang
Yijun Wang received the B.E. and Ph.D. degrees in biomedical engineering from Tsinghua University, Beijing, China, in 2001 and 2007, respectively. From 2008 to 2015, he was a Post-Doctoral Fellow and an Assistant Project Scientist with the Swartz Center for Computational Neuroscience, University of California at San Diego, San Diego, CA, USA. He is currently a Research Fellow with the Institute of Semiconductors, Chinese Academy of Sciences, Beijing. His research interests include brain-computer interface, biomedical signal processing, and machine learning.
References
- Wolpaw JR, Birbaumer N, McFarland DJ, et al. Brain-computer interfaces for communication and control. Clin Neurophysiol. 2002;113(6):767–791. doi: 10.1016/s1388-2457(02)00057-3.
- Vidal JJ. Toward direct brain-computer communication. Annu Rev Biophys Bioeng. 1973;2(1):157–180. doi: 10.1146/annurev.bb.02.060173.001105.
- Gao X, Wang Y, Chen X, et al. Interface, interaction, and intelligence in generalized brain-computer interfaces. Trends Cogn Sci. 2021;25(8):671–684. doi: 10.1016/j.tics.2021.04.003.
- McFarland DJ, Wolpaw JR. EEG-based brain–computer interfaces. Curr Opin Biomed Eng. 2017;4:194–200. doi: 10.1016/j.cobme.2017.11.004.
- Ramadan RA, Vasilakos AV. Brain computer interface: control signals review. Neurocomputing. 2017;223:26–44. doi: 10.1016/j.neucom.2016.10.024.
- Nakanishi M, Wang Y, Chen X, et al. Enhancing detection of SSVEPs for a high-speed brain speller using task-related component analysis. IEEE Trans Biomed Eng. 2018;65(1):104–112. doi: 10.1109/TBME.2017.2694818.
- Bin G, Gao X, Wang Y, et al. VEP-based brain-computer interfaces: time, frequency, and code modulations [Research Frontier]. IEEE Comput Intell Mag. 2009;4(4):22–26. doi: 10.1109/MCI.2009.934562.
- Gao S, Wang Y, Gao X, et al. Visual and auditory brain-computer interfaces. IEEE Trans Biomed Eng. 2014;61(5):1436–1447. doi: 10.1109/TBME.2014.2300164.
- Chen X, Wang Y, Nakanishi M, et al. Hybrid frequency and phase coding for a high-speed SSVEP-based BCI speller. Annu Int Conf IEEE Eng Med Biol Soc. 2014;2014:3993–3996. doi: 10.1109/EMBC.2014.6944499.
- Zhang Y, Xu P, Cheng K, et al. Multivariate synchronization index for frequency recognition of SSVEP-based brain-computer interface. J Neurosci Methods. 2014;221:32–40. doi: 10.1016/j.jneumeth.2013.07.018.
- Lin Z, Zhang C, Wu W, et al. Frequency recognition based on canonical correlation analysis for SSVEP-based BCIs. IEEE Trans Biomed Eng. 2006;53(12 Pt 2):2610–2614. doi: 10.1109/tbme.2006.886577.
- Chen X, Wang Y, Gao S, et al. Filter bank canonical correlation analysis for implementing a high-speed SSVEP-based brain-computer interface. J Neural Eng. 2015;12(4):046008. doi: 10.1088/1741-2560/12/4/046008.
- Chen X, Liu B, Wang Y, et al. A spectrally-dense encoding method for designing a high-speed SSVEP-BCI with 120 stimuli. IEEE Trans Neural Syst Rehabil Eng. 2022;30:2764–2772. doi: 10.1109/TNSRE.2022.3208717.
- Liu B, Chen X, Shi N, et al. Improving the performance of individually calibrated SSVEP-BCI by task-discriminant component analysis. IEEE Trans Neural Syst Rehabil Eng. 2021;29:1998–2007. doi: 10.1109/TNSRE.2021.3114340.
- Zhang Y, Xu P, Liu T, et al. Multiple frequencies sequential coding for SSVEP-based brain-computer interface. PLoS One. 2012;7(3):e29519. doi: 10.1371/journal.pone.0029519.
- Chen Y, Yang C, Ye X, et al. Implementing a calibration-free SSVEP-based BCI system with 160 targets. J Neural Eng. 2021;18(4):046094. doi: 10.1088/1741-2552/ac0bfa.
- Bin G, Gao X, Wang Y, et al. A high-speed BCI based on code modulation VEP. J Neural Eng. 2011;8(2):025015. doi: 10.1088/1741-2560/8/2/025015.
- Martínez-Cagigal V, Thielen J, Santamaría-Vázquez E, et al. Brain-computer interfaces based on code-modulated visual evoked potentials (c-VEP): a literature review. J Neural Eng. 2021;18(6):061002. doi: 10.1088/1741-2552/ac38cf.
- Liu Y, Wei Q, Lu Z. A multi-target brain-computer interface based on code modulated visual evoked potentials. PLoS One. 2018;13(8):e0202478. doi: 10.1371/journal.pone.0202478.
- Wei Q, Liu Y, Gao X, et al. A novel c-VEP BCI paradigm for increasing the number of stimulus targets based on grouping modulation with different codes. IEEE Trans Neural Syst Rehabil Eng. 2018;26(6):1178–1187. doi: 10.1109/TNSRE.2018.2837501.
- Sun Q, Zheng L, Pei W, et al. A 120-target brain-computer interface based on code-modulated visual evoked potentials. J Neurosci Methods. 2022;375:109597. doi: 10.1016/j.jneumeth.2022.109597.
- Nagel S, Spüler M. World’s fastest brain-computer interface: combining EEG2Code with deep learning. PLoS One. 2019;14(9):e0221909. doi: 10.1371/journal.pone.0221909.
- Thielen J, van den Broek P, Farquhar J, et al. Broad-band visually evoked potentials: re(con)volution in brain-computer interfacing. PLoS One. 2015;10(7):e0133797. doi: 10.1371/journal.pone.0133797.
- Spüler Rosenstiel Bogdan MWM. Unsupervised online calibration of a c-VEP brain-computer interface (BCI). Artificial Neural Networks and Machine Learning – ICANN 2013. Berlin, Heidelberg: Springer Berlin Heidelberg; 2013.
- Turi F, Gayraud NTH, Clerc M. 2020. Auto-calibration of c-VEP BCI by word prediction.
- Thielen J, Marsman P, Farquhar J, et al. From full calibration to zero training for a code-modulated visual evoked potentials for brain-computer interface. J Neural Eng. 2021;18(5):056007. doi: 10.1088/1741-2552/abecef.
- Liu B, Huang X, Wang Y, et al. BETA: a large benchmark database toward SSVEP-BCI application. Front Neurosci. 2020;14:627. doi: 10.3389/fnins.2020.00627.
- Liu B, Wang Y, Gao X, et al. eldBETA: A large eldercare-oriented benchmark database of SSVEP-BCI for the aging population. Sci Data. 2022;9(1):252. doi: 10.1038/s41597-022-01372-9.
- Ming G, Zhong H, Pei W, et al. A new grid stimulus with subtle flicker perception for user-friendly SSVEP-based BCIs. J Neural Eng. 2023;20(2):026010. doi: 10.1088/1741-2552/acbee0.
- Manyakov NV, Chumerin N, Robben A, et al. Sampled sinusoidal stimulation profile and multichannel fuzzy logic classification for monitor-based phase-coded SSVEP brain-computer interfacing. J Neural Eng. 2013;10(3):036011. doi: 10.1088/1741-2560/10/3/036011.
- Chen X, Chen Z, Gao S, et al. A high-ITR SSVEP-based BCI speller. Brain-Computer Interfaces. 2014;1(3-4):181–191. doi: 10.1080/2326263X.2014.944469.
- Wong CM, Wan F, Wang B, et al. Learning across multi-stimulus enhances target recognition methods in SSVEP-based BCIs. J Neural Eng. 2020;17(1):016026. doi: 10.1088/1741-2552/ab2373.
- Huang G, Xiao P, Hung YS, et al. A novel approach to predict subjective pain perception from single-trial laser-evoked potentials. Neuroimage. 2013;81:283–293. doi: 10.1016/j.neuroimage.2013.05.017.
- Tu Y, Hung YS, Hu L, et al. An automated and fast approach to detect single-trial visual evoked potentials with application to brain-computer interface. Clin Neurophysiol. 2014;125(12):2372–2383. doi: 10.1016/j.clinph.2014.03.028.
- Behboodi M, Mahnam A, Marateb H, et al. Optimization of visual stimulus sequence in a brain-computer interface based on code modulated visual evoked potentials. IEEE Trans Neural Syst Rehabil Eng. 2020;28(12):2762–2772. doi: 10.1109/TNSRE.2020.3044947.
- Tanaka H. Group task-related component analysis (gTRCA): a multivariate method for inter-trial reproducibility and inter-subject similarity maximization for EEG data analysis. Sci Rep. 2020;10(1):84. doi: 10.1038/s41598-019-56962-2.
- Regan D. Some early uses of evoked brain responses in investigations of human visual function. Vision Res. 2009;49(9):882–897. doi: 10.1016/j.visres.2008.01.017.
- Wang Y, Wang R, Gao X, et al. A practical VEP-based brain-computer interface. IEEE Trans Neural Syst Rehabil Eng. 2006;14(2):234–239.
- Nagel S, Spüler M. Asynchronous non-invasive high-speed BCI speller with robust non-control state detection. Sci Rep. 2019;9(1):8269. doi: 10.1038/s41598-019-44645-x.
- Zheng L, Pei W, Gao X, et al. A high-performance brain switch based on code-modulated visual evoked potentials. J Neural Eng. 2022;19(1):016002. doi: 10.1088/1741-2552/ac494f.
- Yang C, Yan X, Wang Y, et al. Spatio-temporal equalization multi-window algorithm for asynchronous SSVEP-based BCI. J Neural Eng. 2021;18(4):0460b7. doi: 10.1088/1741-2552/ac127f.
- Zheng L, Tian S, Dong Y, et al. A large dataset for VEP based brain-computer interfaces employing narrow-band code modulation and frequency-phase modulation. Figshare. Dataset; 2024. doi: 10.6084/m9.figshare.24864243.