
ABSTRACT
Regional comparisons (cortical surface area and thickness) were performed on a well described sample of adults with reading disability alone (RD), nonverbal giftedness alone (G), and reading disability and nonverbal giftedness combined (GRD). These anatomical results are considered in relation to behavioral and functional work previously reported on this sample. GRD-RD regional differences were found in both hemispheres and were more common than GRD-G differences. Regional differences were found in the temporal, parietal, occipital and frontal lobes. While these data are preliminary given the small sample sizes, they suggest future avenues of research on the neurodevelopment of atypical samples.
Introduction
While estimates may vary, the rate of developmental reading disability (RD) or dyslexia in the school age population is thought to be between 7–10%, with approximately 1.5 boys to every girl (Shaywitz & Shaywitz, Citation2005). RD is a specific learning disability characterized by difficulties with accurate and/or fluent word recognition and by poor spelling and decoding abilities. These difficulties typically result from a deficit in the phonological component of language that is often unexpected in relation to other cognitive abilities and impairs effective classroom instruction (Lyon, Shaywitz, & Shaywitz, Citation2003).
There is now a wealth of genetic, neurological, and behavioral research on RD, which has presented a fairly consistent picture of the deficits and biological origins of the condition. Even though there is still much to understand, the research is clear on several points. First, RD is neurodevelopmental, in that the functional and structural brain anomalies associated with RD can often be traced to early, sometimes prenatal embryologic/fetal or infant growth periods (Eckert, Citation2004; Galaburda, LoTurco, & Ramus et al., Citation2006). Second, genetic research has identified at least several key familial risk genes that play a part in neurodevelopmental events like neuronal migration and axonal guidance (Galaburda et al., Citation2006; Ramos & Fisher, Citation2009; Schumacher, Hoffmann, Schmäl, Schulte-Korne, & Nothen, Citation2007; Smith, Gilger, & Pennington, Citation2002). Third, people with RD typically present with some form of dysfunction of the left hemisphere occipital-temporal, temporal-parietal, and inferior frontal reading pathway (Démonet, Taylor, & Chaix, Citation2004; Hoeft et al., 2007 Linkersdörfer et al., Citation2012; Maisog, Einbinder, Flowers, Turkeltaub, & Eden, Citation2008; Richlan, Kronbichler, & Wimmer, Citation2009, Citation2011). Fourth, deficits in word decoding or phonological awareness are hallmark symptoms, which may manifest themselves early on in oral language, and later as the child is learning to read (Shaywitz & Shaywitz, Citation2005). Finally, intense (preferably early) remediation is thought to improve reading in RD individuals. In fact, several studies have shown that remediation programs can “normalize” the RD brain, improving the function of the left hemisphere “reading pathways” (Frye et al., Citation2010; Keller & Just, Citation2009; Simos et al., Citation2002).
The majority of RD research has, understandably, focused on the cause and expression of the disability, particularly the left hemisphere language-oriented problem. However, some have proposed that RD is a condition with other qualities as well. In support of this, research has demonstrated that the RD brain is diffusely atypical in structure and function, probably due to early developmental perturbations, with anatomical and functional differences not limited to the left hemisphere language regions (Diehl et al 2014; Eckert, Citation2004; Galaburda et al., Citation2006; Gilger & Kaplan, Citation2001; Hynd, Semrud-Clikeman, Lorys, Novey, & Eliopulos, Citation1990; Linkersdörfer et al., Citation2012; Maisog et al., Citation2008; Olulade, Gilger, Talavage, Hynd, & McAteer, Citation2012; Richlan et al., Citation2009, Citation2011) In addition to the reading pathway of the left hemisphere, RD brains may show structural and/or functional differences in the right hemisphere and other subcortical regions, as well as frontal, parietal, and temporal areas not normally considered part of the traditional reading pathway (Eckert, Citation2004; Keller & Just, Citation2009). Studies have also reported prenatal neuronal migration “errors” in cortical and subcortical locations, and variations in regional connectivity (Galaburda, Citation1992; Galaburda et al., Citation2006).
While there is initial understanding of how these neurological differences may manifest in the functional aspects of reading (Démonet et al., Citation2004; Galaburda et al., Citation2006; Shaywitz & Shaywitz, Citation2005), how these structural deviations might be expressed in other behaviors or cognitive capacities is comparatively unknown. For example, how might neurological differences outside the classic reading/language areas contribute to nonlanguage skills like visuospatial processing? Are there certain structural patterns that may give rise to RD, but also contribute to variations in nonlinguistic skills, as proposed by some (e.g. Galaburda, Citation1992; Geschwind & Behan, Citation1982; Geschwind & Galaburda, Citation1987)? For example, there are data indicating that individuals with RD show nonlinguistic behavioral deficits that may or may not contribute to their reading difficulties, such as those related to visual-orthographic processing, cognitive-temporal sequencing, and variations in skills linked to the parvo-magnocellular system (Howard, Howard, Japikse, & Eden, Citation2006; Nicolson & Fawcett, Citation1994; Schneps, Brockmole, Sonnert, & Pomplun, Citation2012; Skottun, Citation2005; Stein, Citation2001). Two recent studies have also shown unique neurophysiology in RD samples compared to controls during the processing of complex 2D and 3D spatial stimuli (Diehl et al 2014; Olulade et al., Citation2012) again suggesting that neurological differences in the RD brain may lead to unique working networks in domains not commonly included under the umbrella of reading.
The condition of twice exceptionality (2e) is related to the issue of diffuse RD neurological differences and how these differences may manifest themselves in reading as well as other skills. Twice exceptional individuals are those with a disability alongside a higher-order, and significantly above average, cognitive skill. In the context of this study, 2e pertains to someone with RD as well as superior skills in a nonlinguistic domain (e.g., visuospatial processing), although 2e may present in linguistic domains as well (e.g., Berninger & Abbott, Citation2013). Twice exceptionality rates vary greatly across studies, and some of the best estimates have placed the prevalence of 2e in K-12th grade in heterogeneous special education or gifted populations at around 3%-5% (with some as low as 1% and as high as 36%; Foley Nicpon, Allmon, Sieck, & Stinson, Citation2011; Ruban & Reis 2005). Given that language-related disabilities are the most common learning disorder representing some 80% of the learning disordered population (Lerner, Citation1989), it is not surprising that a majority of these 2e children have RD as part of their profile.
In an earlier fMRI study of 2e dyslexics, Gilger and colleagues (Gilger & Olulade, Citation2013; Gilger, Talavage, & Olulade, Citation2013; Olulade et al., Citation2012) compared the functional neurology of text reading and 3-D spatial visualization/reasoning abilities in four groups of subjects: RD only, nonverbally gifted (G), nonverbally gifted and RD (twice exceptional, or GRD), and control samples. In brief, they found functional activation differences between the four groups during the processing of spatial and reading stimuli. For example, during the spatial task, RDs had reduced activation in middle and inferior frontal, prefrontal, and bilateral parietal regions relative to controls (BA 6, 7, 9), and greater activation in several right hemisphere areas (e.g., mid temporal regions, BA 37, 39); Gifted subjects had greater activation bilaterally than the other groups in a number of areas (e.g., mid occipital region, BA 19); and, importantly, the RD and GRD samples were very similar to each other in terms of localization and levels of activation whether they were processing text or spatial information.
This report is aimed at supplementing the aforementioned fMRI findings on 2e dyslexics by providing an analysis of underlying brain structure (rather than function characteristics per se). Specifically, the goal was to ascertain if there are anatomical differences in the brains of those who are GRD, making them unique from their counterparts who exhibit dyslexia (RD) or giftedness (G) alone. While there have been other anatomical studies of savantism, a rarer and more extreme condition than the 2e classification used in this paper (Treffert, Citation2009), there is to the best of our knowledge, only one published structural study of 2e learning or reading-disabled individuals (see Craggs, Sanchez, Kibby, Gilger, & Hynd, Citation2006). Specifically, Craggs et al. presented evidence of a unique gyral morphology found in the parietal operculum (e.g., containing or bordering the planum temporale, supramarginal gyrus, and angular gyrus) that may be linked to nonverbal giftedness along with RD.
Materials and methods
Participants
The current study utilizes the same college-aged sample that has been reported on in other papers examining functional neurology (see: Gilger & Olulade, Citation2013; Gilger et al., Citation2013; Olulade et al., Citation2012). All participants’ primary and first language was English and they reported no previous diagnosis of neurological or psychiatric disorders. Subjects were placed into one of three groups based on the following criteria (note that the 4th group included in the prior studies, the controls, are not included in the present analyses):
Reading disabled or RD (N = 6/3 F) with Full-Scale IQ (FSIQ) standard scores above 85, with Verbal IQ (VIQ) and Performance IQs (PIQ) in the normal range (i.e. mean = 100, with a standard deviation of 15), and a previous diagnosis of RD and/or significant underachievement in reading and/or spelling that began during the elementary or middle school grades. These subjects also had a confirmed diagnosis of a disability through the University testing requirement to qualify for learning disability services, and the psychometric tests conducted as part of this study confirmed their RD profile.
Nonverbally gifted or G (N = 5/1 F)Footnote1 with FSIQ and VIQ in the normal range and PIQ in the Superior or better range (above 120). Subjects in this group had no history of learning problems and demonstrated at least normal abilities in our psychometric testing.
Nonverbally gifted and reading disabled or GRD (N = 9/4 F) who met the IQ criteria for the G group and also had a history and/or university documentation indicating a reading disorder that was supported by psychometric testing.
At the time of the study, subjects were college students at a large Midwestern Research institution. Experimental procedures were approved by the University Institutional Review Board, written informed consent was obtained from each participant, and subjects were monetarily compensated. It is important to note that the G, RD, and GRD samples were carefully matched on VIQ and FSIQ, and that the RD and GRD groups presented a reading test profile consistent with a diagnosis of a reading-specific disorder in college-aged students (Wolfe, Schreiber, & Wasserstein, Citation2008). The recruitment procedure involved interviewing each potential subject in-person. If the interview indicated that the individual fit the criteria of one of the four groups, he or she was then given an IQ test. If the results of the IQ test were within the required ranges previously outlined, the person advanced to the psychometric portion of the study that included the reading tests and other measures. Finally, those who met all of the above requirements to be classified as RD, G, or GRD were admitted into the MRI portion of the study. Overall, 35% of the subjects interviewed were ultimately given an MRI. While our final sample sizes for each group is relatively small, they are comparable in size to other studies investigating morphological differences in highly select groups of subjects, and was expected given the rarity of the sample and the strictness of the matching criteria.
Behavioral battery
Participants underwent a battery of behavioral/psychometric tests to confirm diagnoses and group placement: the Wechsler Abbreviated Scale of Intelligence (WASI; Wechsler, Citation1999), comprised of the Vocabulary, Similarities, Block Design and Matrices subtests. The WASI yields highly reliable VIQ, PIQ and FSIQs; the Reading Fluency (WJRF: reading of sentences), Passage Comprehension (WJPC: contextual understanding of a written passage), and Spatial Relations (WJSR: detection of object features, mental manipulation of objects and visual matching) subtests of the Woodcock-Johnson Test of Achievement (Woodcock, McGrew, & Mather, Citation2001); the Rapid Automatized Naming tests that assess fluency for reading letters and numbers (RAN; Wolf & Denckla, Citation2005); and the Word Recognition (WRATREC: single word reading), Spelling (WRATSPELL: written spelling of orally presented words), Mathematics Computation (WRATMATH: written math calculations), and Sentence Completion (WRATSC: written sentence comprehension) subtests of the Wide Range Achievement Test (Wilkinson & Robertson, Citation2006). Other self-report questionnaire and interview data, not relevant to this report, were collected as well. The RD and GRD samples were required to have qualified for special services for RD at the university. A licensed psychologist performed testing at the University within 2 years of the start of this study, and resulting data was made available to our research team. See for descriptive statistics on these measures.
Image acquisition
Anatomical images were acquired at the University MRI Facility using a General Electric Medical Systems 3-tesla Signa HDx scanner. Images acquired included a sagittal 3D fast spoiled gradient recall (SPGR) sequence [inversion time (TI) = 450 ms; repetition time (TR) = 6.02 ms; echo time (TE) = 2.192 ms; flip angle = 12 ; slice thickness = 1 mm; 186 slices; number of signals averaged = 1; field-of-view (FOV) = 240 mm; matrix size = 256 × 256 (voxel size = 0.9375 × 0.9375 × 1 mm)].
Functional studies, though not part of this report, required an additional 60 minutes of imaging time, thus each imaging session lasted approximately a 90 minutes (see Gilger et al., Citation2013). The functional portion included two tasks: a spatial visualization task based on the mental rotation task of Shepard and Metzler (Shepard & Metzler, Citation1971); and a reading assessment consisting of a word rhyme judgment task (Pugh et al., Citation2000). The word rhyme task has been shown to discriminate reading disabled from normal readers. We have presented descriptive data on these in-scanner measures for the reader in .
Table 1. Descriptive and mean comparison data for reading disabled (RD), Gifted (G), and Gifted-Reading Disabled (GRD) subjects a and b.
Image processing and cortical thickness and surface area extraction
Cortical reconstruction and volumetric segmentation were performed using the FreeSurfer image analysis suite version 5.0.0, which is documented and freely available for download online (http://surfer.nmr.mgh.harvard.edu/). The technical details of these procedures are described in prior publications (Dale, Fischl, & Sereno, Citation1999; Fischl, Liu, & Dale, Citation2001; Fischl et al., Citation2002, Fischl, Salat, et al., Citation2004; Fischl, Van der Kouwe, & Destrieux, Citation2004; Ségonne et al., Citation2004). Briefly, post processing included motion correction, removal of nonbrain tissue using a hybrid watershed/surface deformation procedure (Ségonne et al., Citation2004), automated Talairach transformation, segmentation of the subcortical white matter and deep gray matter volumetric structures (including hippocampus, amygdala, caudate, putamen, ventricles—(Fischl et al., Citation2002; Fischl, Salat, et al., Citation2004)), intensity normalization (Sled, Zijdenbos, & Evans, Citation1998), tessellation of the gray matter white matter boundary, automated topology correction (Fischl et al., Citation2001; Ségonne, Pacheco, & Fischl, Citation2007), and surface deformation following intensity gradients to optimally place the gray/white and gray/cerebrospinal fluid (CSF) borders at the location where the greatest shift in intensity defines the transition to the other tissue class (Fischl & Dale, Citation2000). The main and pial surfaces were visually inspected and data with poor image quality were excluded: one from the RD group and one from the GRD group.
Once the cortical models were complete, a number of deformable procedures were performed for further analysis including surface inflation, registration to a spherical atlas which utilized cortical folding patterns to match cortical geometry across participants, parcellation of the cerebral cortex into units based on gyral and sulcal structure (Desikan et al., Citation2006; Fischl, Van der Kouwe, et al., Citation2004), and creation of a variety of surface-based data, including maps of curvature and sulcal depth. This procedure uses both intensity and continuity information from the entire three-dimensional MR volume to produce representations of cortical thickness, calculated as the closest distance from the gray/white boundary to the gray/CSF boundary at each vertex on the tessellated surface (Fischl & Dale, Citation2000). These maps are created using spatial intensity gradients across tissue classes and are therefore are not simply reliant on absolute signal intensity. The maps produced are not restricted to the voxel resolution of the original data and thus are capable of detecting sub-millimeter differences between groups. Procedures for the measurement of cortical thickness have been validated against histological analysis (Rosas et al., Citation2002) and manual measurements (Kuperberg et al., Citation2003; Salat, Buckner, & Snyder, Citation2004). FreeSurfer morphometric procedures show good test–retest reliability across scanner manufacturers and across field strengths (Han et al., Citation2006).
Primary statistical analysis
Selection of regions of interest
While there were many possible anatomical regions of interest (ROIs) to focus on in the present study, we opted to restrict our analyses to those areas driven by the significant functional areas coming out of prior research (Gilger et al., Citation2013). Limiting our ROIs in this way allows for an a priori focused approach, which is less exploratory and more powerful. The essential goal here was to determine the extent to which GRDs differ from RDs and Gs in terms of their basic underlying brain anatomy. Many of these regions are included in the left hemisphere cortical reading pathway, as well as several areas that have been identified as active during spatial visualization tasks, including prefrontal, anterior cingulate and superior/inferior parietal regions (see O’Boyle et al., Citation2005).
displays the 10 cortical ROIs examined in the current study. These parallel the significant functional differences for these groups previously reported (Gilger et al., Citation2013; Olulade et al., Citation2012). ROIs were assessed for both cortical thickness and surface area. Both area and thickness were included as the cytoarchitectural characteristics defining cortical thickness and surface area as the can vary across regions and are thought to be genetically independent (Frye et al., Citation2010; Panizzon et al., Citation2009). It is important, therefore, to look at both indices, as each may represent a different developmental phenomenon.
The focus of this study was on the RD, G and GRD samples. As our question focused on G-RD-GRD differences, we did not include an analysis of the control sample. This also helped simplify our results and limit the number of statistical tests conducted. Specifically, one contrast of interest was RD vs. GRD, to provide insight into how the 2e brain may structurally differ from those who are RD but not gifted. A second contrast of interest was GRD versus G, to assess how a 2e brain may differ from a brain matched for giftedness but without disability.
Contrasts
Before conducting contrasts, all ROIs were corrected for brain size by adjusting thickness indices for overall cortical thickness and area indices for overall cortical area. To address the two contrast questions, we applied multivariate linear regressions in the form of (Cohen, Cohen, West, & Aiken, Citation2003):
where ROIr represents a residual ROI after correction for brain size, β0 is sex (male-female), β1 is age, β2 is a dummy variable coded to reflect group membership (RD, GRD, or RD), and y is the intercept. The group membership variable included just the RD and GRD groups/subjects for the RD vs. GRD contrasts, while the variable included just the GRD and G groups/subjects for the GRD vs. G contrasts. We opted to use regression as a means to control for the effects of covariates (age and sex), as well as provide an easily interpretable measure of independent effect sizes for each equation variable (i.e., partial correlations). A partial correlation of a binary variable such as group membership as GRD or G, would be equivalent to the t-test of two group means that have been adjusted for age and sex (Cohen et al., Citation2003).
Sex and age (β0 and β1) are control variables only, and the variable of real interest is β2. In particular, we looked at tests of the significance of β2 in the full model along with the other predictors to assess the unique explanatory variance in an ROI that is due to group differences. Regressions were run for all 10 ROIs, for both the area and thickness indices for each of the two contrasts, resulting in 40 regressions (10 * 2 * 2).
Results
Behavioral battery
Descriptive statistics are presented in . includes psychometric and fMRI task data that are not part of the key inferential analyses of this report. We included all the data within this table to provide the reader with a complete picture of how the G, GRD and RD groups compare to one another on these measures. The fMRI spatial reasoning tasks tap into cognitive processes similar to those of the Performance IQ (PIQ) subtests used to categorize our subjects as nonverbally gifted (Kaufman & Lichtenberger, Citation2002), and our previous research has shown that PIQ is positively correlated with performance on the Shepard-Metzler 3-D Mental Rotations Task (Shepard & Metzler, Citation1971) in our study (r = .48, p < .001).
shows that the grouping manipulation was successful: mean VIQ and FSIQs were in the normal range for all three groups, while the G and GRD groups equally excelled on mean PIQ. The significant though small elevation in FSIQ for the G and GRD groups is probably due to how their FSIQ was calculated (i.e., it takes into account both VIQ and PIQ). Notably, the groups were well-matched on VIQ, and compared to the G group, the RD and GRD groups performed significantly poorer on the reading-spelling accuracy and fluency tests as expected (WRATREC, WRATSPELL, RANL, WJRF, WJPC, MRI Reading % correct, and response time).
Regions of interest
ROIs having significant effects, their corresponding partial correlations (with sex and age in the equation), and p-values are presented in . Regions of significance are also shown graphically in . Age and sex were not significant in any equations. As shows, at least one significant (p < .05) β2 coefficient was found for 9 out of the 10 brain areas we examined, and 7 (17.5%) of the 40 specific ROIs tested yielded significant results. As this is a preliminary report based on a rare, but small sample, we display probabilities uncorrected for potential Type 1 errors but we note in which findings remain significant after Bonferroni Type 1 correction (Hays, Citation1981).
Table 2. Regions of interest.
Table 3. Significant (p ≤ 0.05) ROIs Contrasting G to GRD or RD to GRDa.
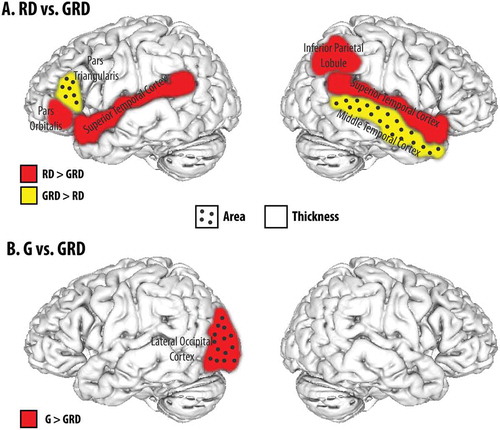
Figure 1. Regions-of-Interest exhibiting significant anatomical between-group differences.
For these analyses and the β2 variable, RD subjects were coded 1 and GRD were coded 2 (RD vs. GRD), or G was coded 1 and GRD was coded 2 (G vs. GRD) (see also note in ). Thus, for the RD versus GRD comparisons, positive partial correlations indicate a larger ROI area or thickness for GRDs, while negative partial correlations indicate a larger ROI area or thickness for RDs. Similarly, for the G vs. GRD analyses, positive partial correlations indicate a larger ROI area or thickness for GRDs, while negative partial correlations indicate a larger ROI area or thickness for Gs. The square of the partial correlation can be used as an estimate of effect size (Cohen et al., Citation2003).
RD vs. GRD comparisons
In the left hemisphere, significant RD vs. GRD effects were found for regions in and around the inferior frontal gyrus and Broca’s area (pars orbitalis, pars triangularis), and Wernicke’s area/auditory cortex (superior temporal gyrus). The RD group displayed thicker superior temporal and pars orbitalis regions, and a smaller surface area for the pars triangularis. Effect sizes range from .87 to .67, and are moderate to substantial.
In the right hemisphere significant group effects were found for the superior temporal gyrus (Wernicke’s/auditory cortex) and the inferior parietal lobule with the RD group displaying greater thickness in both areas. The only significant difference between the RD and GRD groups for surface area was in the right mid-temporal gyrus, with RDs having a smaller mean value. Effect sizes were between .75 and .49.
G versus GRD comparisons
These analyses yielded only one significant comparison: a larger mean surface area for G relative to GRD in the lateral occipital region of the left hemisphere. The effect size was .54 and moderate.
Discussion
This is a preliminary study of the neuroanatomy of individuals with a reading disability who also exhibit nonverbal giftedness (i.e., GRD). One hypothesis is that GRD essentially reflects the contributions of both gifted (G) and reading disabled (RD) brain function, and so we chose to ascertain what is unique to the GRD anatomy relative to G or to RD neurology separately. Thus, a “subtractive logic” approach was applied where one contrast with GRD removed the similarities due to G alone, and the other removed the similarities due to RD alone. We recognize, of course, that GRD neurology is likely more than a simple addition of G and RD neurology. However, our approach represents one way to compare cases with one or both conditions to each other, and examine how being GRD may differ from being RD or G alone. As previously mentioned, other than the functional work done on this sample, to our knowledge, no other imaging study has been reported on the gifted yet learning disabled, except for some neuroanatomical work by Craggs and colleagues (Citation2006).
Both surface area and regional thickness contribute to overall cortical volume, and this index is generally and reliably associated with higher cognitive functioning (i.e., bigger tends to be better; Frye et al., Citation2010; Haier, Jung, Yeo, Head, & Alkire, Citation2004). It is worth noting that although both surface area and thickness contribute to overall brain size, these measures tend to be uncorrelated (as they were in the present sample; p > .05). Moreover, each measure may reflect the effects of different neurodevelopmental events and timing effects, and while each index is highly heritable (h2 ~ .80–.90) they share little genetic variance (Panizzon et al., Citation2009).
In contrast to general brain size, the interpretation of specific regional size differences is not straightforward (Burgaleta, Johnson, Waber, Colom, & Karama, Citation2014; Goh et al., Citation2011; Karama et al., Citation2009; Margolis et al., Citation2013; Menary et al., Citation2013; Schnack, Van Haren, & Brouwer et al., Citation2014; Shaw et al., Citation2006; Sowell, Thompson, & Leonard, Citation2004). In some cases, dependent on age, thicker regional cortices are associated with higher abilities, although the opposite can be true as well, with thinner cortices reflecting more efficient processing (Brouwer et al., Citation2014; Goh et al., Citation2011; Margolis et al., Citation2013; Menary et al., Citation2013; Schnack et al., Citation2014; Shaw et al., Citation2006; Sowell et al., Citation2004). The picture is even more complex given research showing that shrinkage or reduced region size can be associated with deficits in cognitive abilities, while other studies show that larger size is predictive of more enhanced abilities (Schnack et al., Citation2014), and at other times, there appears to be no relationship (Burgaleta et al., Citation2014; Tramo et al., Citation1998). For example, Frye et al. (Citation2010) demonstrate a complex pattern of regional area and thickness measurements related to reading and reading disability, which included negative correlations between inferior frontal volume and phonological test performance in RDs, even though the volume of this region was larger overall in the non-RD sample (see also Linkersdörfer et al., Citation2012). Other research suggests that highly educated and older RDs may show different morphological patterns than younger RDs (Frye et al., Citation2010; Maisog et al., Citation2008). Although the younger group may show grey matter reductions in bilateral posterior temporal, temporo-parietal, and occipito-temporal regions, older subjects may show a different pattern, particularly in the right hemisphere.
Interpreting the complex relationship between ROI size and cognitive function is further complicated when attempting to link it to fMRI results and subsequent behavioral expression (Haller & Bartsch, Citation2009). In other words, whether the GRD group displays smaller (or larger) mean areas or thicknesses may or may not be clearly related to the underlying pattern of activation found in the fMRI study of this sample. And while most of the significant structural contrasts involved RD-GRD comparisons, it is noteworthy that the GRD and RD groups often appeared quite similar in terms of their fMRI activation patterns and that the RD and GRD subjects performed quite similarly on the non-IQ-related behavioral measures (see and Gilger et al., Citation2013). This stands in contrast to the current anatomical study where we found that the significant differences most often occurred for the GRD-RD and not the GRD-G comparisons. So while functionally similar, RDs and GRDs were structurally quite different. This discrepancy awaits resolution and the results of the present anatomical study must be viewed in the context of a small sample size and its concomitant effect on statistical power. Bearing in mind that making clear statements about the meaning or function of each significant ROI is risky given the limitations of this study, it remains noteworthy that the regional differences in favor of G or GRD (Left Pars Triangularis, Left Medial Temporal, and Right Lateral Occipital) were for area and not volume. As cortical volume and area measures may reflect different neurodevelopmental events, with area being laid down more prenatally and volume more responsive to postnatal experience, it is possible that our observations of larger ROI areas for G and GRD represent an early predisposition towards nonverbal giftedness (Frye et al., Citation2010; Panizzon et al., Citation2009).
Many of the regions showing structural differences in our contrasts have also been reported in studies comparing RD and normally reading control groups (Eckert, Citation2004; Frye et al., Citation2010; Linkersdörfer et al., Citation2012). These include regions that are thought to comprise oral and/or written language systems (e.g., primary auditory cortex, Wernicke’s). As would be expected for a language- related disorder, research has shown that many of the RD differences reside in the left hemisphere, often revealing smaller areas or thicknesses that are linked to reading deficits (Eckert, Citation2004; Frye et al., Citation2010; Maisog et al., Citation2008). It is noteworthy that the significant ROIs reported in the current study are also among those often cited as parts of the Parieto-Frontal network model of human intelligence (see Parieto-Frontal Integration Theory [P-FIT]; Jung & Haier, Citation2007).
Closing comments
The results of this study suggest that further research is needed. Our data, for instance, do not include an analysis of white matter or connectivity. Indeed, connectivity is likely important and has been implicated as a possible factor contributing to both RD and giftedness independently (Prescott, Gavrilescu, Cunnington, & O’Boyle, Citation2010; van der Mark et al., Citation2011). The differences reported here for cortical volume, in particular, touch upon what may be a reflection of pre- and postnatal experience that determine networks dependent upon how regions co-develop and connect. Future work looking at 2e and the neurological presentation of RD and giftedness together should include white matter and connectivity studies.
In addition to connectivity, other questions remain pertaining to how or why we observed these significant cortical differences. For example, were there unique gyral patterns in or around the ROIs that may have been linked to surface area measures like those reported in Craggs et al. (Citation2006)? These types of analyses require standardized visual inspection of scans and cannot be conducted with the digitized data made available through FreeSurfer. However, future projects can make use of our scans to ascertain if unique or gross morphological characteristics are present in our samples.
In conclusion, we recognize several caveats and cautions that limit interpretation of our data. The most obvious is sample size with the possibility of null results due to power deficiencies or significant results due to chance or noise. Still, perhaps like other (and often first) neurological studies on unique populations (e.g., as reviewed in Harrison, Citation1999), we hope that these data will initiate new fields of research interest. While significant and large effects were found in our current preliminary work, they clearly require replication. We also hope that future research on this topic will be extended to the investigation of younger age groups, which may provide insight into the postnatal neurodevelopmental progressions of 2e/GRD individuals.
Acknowledgments
We would like to thank Carole McAteer, Mike Wilkins, George Hynd, Dawn Graham, and Lisa Neuenschwander for their help with the study. We would also like to thank our subjects for their participation.
Funding
This work was funded by the APA Foundation and the Esther Katz Rosen Foundation for Research and Programs on Giftedness in Children (J. Gilger, PI), with supplementary funds from UC Merced and the Carlston Cunningham Endowment.
Additional information
Funding
Notes
1. While we refer to our G and GRD groups as “gifted,” we recognize that in practice these individuals may not reach the threshold for a gifted classification based on a standardized test. Our average nonverbal IQ in our samples is technically in the high/superior range (>120) and this may not meet the cut-off criteria for some gifted programs or reach the standard range for giftedness on common IQ tests (>130). However, all GRD and G adults have high/superior IQs in the nonverbal domain that stand out from their normal performance in the verbal domain or their deficits in reading. Clearly these subjects had strengths in the nonverbal area and many subjects reported talents or hobbies in the arts, engineering and other spatially-oriented applications. Furthermore, many of the GRD subjects reported common issues seen in 2e students with nonverbal strengths, such as complicated diagnoses in elementary school, splinter skills and a preference for nonreading/nonverbal activities. The PIQ > VIQ split in the GRD group is also a frequently observed profile in the 2e. For these reasons we feel comfortable using our G and GRD comparison groups as adequate representatives of gifted and 2e samples, albeit they are not in the extreme gifted category and future research on such groups would further advance the field.
References
- Berninger, V. W., & Abbott, R. D. (2013). Differences between children with dyslexia who are and are not gifted in verbal reasoning. Gifted Child Quarterly, 57(4), 223–233. doi:10.1177/0016986213500342
- Brouwer, R. M., Van Soelen, I. L. C., Swagerman, S. C., Schnack, H. G., Ehli, E. A., Kahn, R. S.,… Boomsma, D. I. (2014). Genetic associations between intelligence and cortical thickness emerge at the start of puberty. Human Brain Mapping, 35, 3760–3773. doi:10.1002/hbm.22435
- Burgaleta, M., Johnson, W., Waber, D. P., Colom, R., & Karama, S. (2014). Cognitive ability changes and dynamics of cortical thickness development in healthy children and adolescents. NeuroImage, 84, 810–819. doi:10.1016/j.neuroimage.2013.09.038
- Cohen, J., Cohen, P., West, S., & Aiken, L. (2003). Applied multiple regression/correlation analysis for the behavioral sciences. (2nd ed.). Hillsdale, NJ: Lawrence Erlbaum.
- Craggs, J. G., Sanchez, J., Kibby, M. Y., Gilger, J., & Hynd, G. (2006). Brain morphology and neuropsychological profiles in a family displaying dyslexia and superior nonverbal intelligence. Cortex Journal Devoted Study Nerv Systems Behavioral, 42, 1107–1118. doi:10.1016/S0010-9452(08)70222-3
- Dale, A. M., Fischl, B., & Sereno, M. I. (1999). Cortical surface-based analysis. I. Segmentation and surface reconstruction. NeuroImage, 9, 179–194. doi:10.1006/nimg.1998.0395
- Démonet, J.-F., Taylor, M. J., & Chaix, Y. (2004). Developmental dyslexia. Lancet, 363, 1451–1460. doi:10.1016/S0140-6736(04)16106-0
- Desikan, R. S., Ségonne, F., Fischl, B., Quinn, B. T., Dickerson, B. C., Blacker, D. … Killiany, R. J. (2006). An automated labeling system for subdividing the human cerebral cortex on MRI scans into gyral based regions of interest. NeuroImage, 31, 968–980. doi:10.1016/j.neuroimage.2006.01.021
- Diehl, J. J., Frost, S. J., Sherman, G., Mencl, W. E., Kurian, A., Molfese, P., Landi, N., Preston, J., Soldan, A., Fulbright, R. K., Rueckl, J., Seidenberg, M.S., & Pugh, K. R. (2014). Neural correlates of language and non-language visuospatial processing in adolescents with reading disability. NeuroImage, 101, 653–666.
- Eckert, M. (2004). Neuroanatomical markers for dyslexia: A review of dyslexia structural imaging studies. Neuroscience Reviews Journal Bringing Neurobiology Neurologic Psychiatry, 10, 362–371. doi:10.1177/1073858404263596
- Fischl, B., & Dale, A. M. (2000). Measuring the thickness of the human cerebral cortex from magnetic resonance images. Proceedings of the National Academy of Sciences, 97, 11050–11055. doi:10.1073/pnas.200033797
- Fischl, B., Liu, A., & Dale, A. M. (2001). Automated manifold surgery: Constructing geometrically accurate and topologically correct models of the human cerebral cortex. IEEE Transactions on Medical Imaging, 20, 70–80. doi:10.1109/42.906426
- Fischl, B., Salat, D. H., Busa, E., Albert, M., Dieterich, M., Haselgrove, C. … Dale, A. M. (2002). Whole brain segmentation: Automated labeling of neuroanatomical structures in the human brain. Neuron, 33, 341–355. doi:10.1016/S0896-6273(02)00569-X
- Fischl, B., Salat, D. H., Van Der Kouwe, A. J. W., Makris, N., Ségonne, F., Quinn, B. T., & Dale, A. M. (2004). Sequence-independent segmentation of magnetic resonance images. NeuroImage, 23(Suppl 1), S69–84. doi:10.1016/j.neuroimage.2004.07.016
- Fischl, B., Van der Kouwe, A., & Destrieux, C. (2004). Automatically parcellating the human cerebral cortex. Cerebral Cortex, 14(1), 11–22. doi:10.1093/cercor/bhg087
- Foley Nicpon, M., Allmon, A., Sieck, B., & Stinson, R. D. (2011). Empirical investigation of twice- exceptionality: Where have we been and where are we going? Gifted Child Quarterly, 55, 3–17. doi:10.1177/0016986210382575
- Frye, R. E., Liederman, J., Malmberg, B., McLean, J., Strickland, D., & Beauchamp, M. S. (2010). Surface area accounts for the relation of gray matter volume to reading-related skills and history of dyslexia. Cerebral Cortex, 20(11), 2625–2635. doi:10.1093/cercor/bhq010
- Galaburda, A. M. (1992). Neurology of developmental dyslexia. Current Opinion in Neurology and Neurosurgery, 5, 71–76.
- Galaburda, A. M., LoTurco, J., Ramus, F., Fitch, R. H., & Rosen, G. D. (2006). From genes to behavior in developmental dyslexia. Nature Neuroscience, 9, 1213–1217. doi:10.1038/nn1772
- Geschwind, N., & Behan, P. (1982). Left-handedness: Association with immune disease, migraine, and developmental learning disorder. Proceedings of the National Academy of Sciences, 79, 5097–5100. doi:10.1073/pnas.79.16.5097
- Geschwind, N., & Galaburda, A. M. (1987). Biological mechanisms, associations and pathology. Cambridge, MA: MIT Press.
- Gilger, J. W., & Kaplan, B. J. (2001). Atypical brain development: A conceptual framework for understanding developmental learning disabilities. Developmental Neuropsychology, 20, 465–481. doi:10.1207/S15326942DN2002_2
- Gilger, J. W., & Olulade, O. A. (2013). What happened to the “Superior Abilities” in adults with Dyslexia and high IQs? A behavioral and neurological illustration. Roeper Review, 35, 241–253. doi:10.1080/02783193.2013.825365
- Gilger, J. W., Talavage, T. M., & Olulade, O. A. (2013). An fMRI study of nonverbally gifted reading disabled adults: Has deficit compensation effected gifted potential? Frontiers in Human Neuroscience, 7. doi:10.3389/fnhum.2013.00507
- Goh, S., Bansal, R., Xu, D., Hao, X., Liu, J., & Peterson, B. S. (2011). Neuroanatomical correlates of intellectual ability across the life span. Developmental Cognitive Neuroscience, 1, 305–312. doi:10.1016/j.dcn.2011.03.001
- Haier, R. J., Jung, R. E., Yeo, R. A., Head, K., & Alkire, M. T. (2004). Structural brain variation and general intelligence. NeuroImage, 23, 425–433. doi:10.1016/j.neuroimage.2004.04.025
- Haller, S., & Bartsch, A. J. (2009). Pitfalls in FMRI. European Radiology, 19, 2689–2706. doi:10.1007/s00330-009-1456-9
- Han, X., Jovicich, J., Salat, D., Van der Kouwe, A., Quinn, B., Czanner, S. … Fischl, B. (2006). Reliability of MRI-derived measurements of human cerebral cortical thickness: The effects of field strength, scanner upgrade and manufacturer. NeuroImage, 32, 180–194. doi:10.1016/j.neuroimage.2006.02.051
- Harrison, P. J. (1999). The neuropathology of schizophrenia: A critical review of the data and their interpretation. Brain, 122, 593–624. doi:10.1093/brain/122.4.593
- Hays, W. L. (1981). Statistics (3rd ed.). New York, NY: CBS College.
- Howard, J. H., Howard, D. V., Japikse, K. C., & Eden, G. F. (2006). Dyslexics are impaired on implicit higher-order sequence learning, but not on implicit spatial context learning. Neuropsychologia, 44, 1131–1144. doi:10.1016/j.neuropsychologia.2005.10.015
- Hynd, G. W., Semrud-Clikeman, M., Lorys, A. R., Novey, E. S., & Eliopulos, D. (1990). Brain morphology in developmental dyslexia and attention deficit disorder/hyperactivity. Archives of Neurology, 47, 919–926. doi:10.1001/archneur.1990.00530080107018
- Jung, R. E., & Haier, R. J. (2007). The Parieto-Frontal Integration Theory (P-FIT) of intelligence: Converging neuroimaging evidence. The Behavioral and Brain Sciences, 30, 135–187. doi:10.1017/S0140525X07001185
- Karama, S., Ad-Dab’bagh, Y., Haier, R. J., Deary, I. J., Lyttelton, O. C., Lepage, C., & Evans, A. C. (2009). Positive association between cognitive ability and cortical thickness in a representative US sample of healthy 6 to 18 year-olds. Intelligence, 37, 145–155. doi:10.1016/j.intell.2008.09.006
- Kaufman, A. S., & Lichtenberger, E. O. (2002). Assessing adolescent and adult intelligence (2nd ed.). Boston, MA: Allyn and Bacon.
- Keller, T. A., & Just, M. A. (2009). Altering cortical connectivity: Remediation-induced changes in the white matter of poor readers. Neuron, 64, 624–631. doi:10.1016/j.neuron.2009.10.018
- Kuperberg, G. R., Broome, M. R., McGuire, P. K., David, A. S., Eddy, M., Ozawa, F., … Fischl, B. (2003). Regionally localized thinning of the cerebral cortex in schizophrenia. Arch Gen Psychiatry, 60, 878–888. doi:10.1001/archpsyc.60.9.878
- Lerner, J. W. (1989). Educational interventions in learning disabilities. Journal of the American Academy of Child & Adolescent Psychiatry, 28, 326–331. doi:10.1097/00004583-198905000-00004
- Linkersdörfer, J., Lonnemann, J., Lindberg, S., Hasselhorn, M., Fiebach, C. J., & Draganski, B. (2012). Grey matter alterations co-localize with functional abnormalities in developmental dyslexia: An ALE meta-analysis. PloS One, 7, e43122. doi:10.1371/journal.pone.0043122
- Lyon, G. R., Shaywitz, S. E., & Shaywitz, B. A. (2003). A definition of dyslexia. Annals of Dyslexia, 53, 1–14. doi:10.1007/s11881-003-0001-9
- Maisog, J. M., Einbinder, E. R., Flowers, D. L., Turkeltaub, P. E., & Eden, G. F. (2008). A meta-analysis of functional neuroimaging studies of dyslexia. Annals of the New York Academy of Sciences, 1145, 237–259. doi:10.1196/annals.1416.024
- Margolis, A., Bansal, R., Hao, X., Algermissen, M., Erickson, C., Klahr, K. W., … Peterson, B. S. (2013). Using IQ discrepancy scores to examine the neural correlates of specific cognitive abilities. Journal of Neuroscience, 33, 14135–14145. doi:10.1523/JNEUROSCI.0775-13.2013
- Menary, K., Collins, P. F., Porter, J. N., Muetzel, R., Olson, E. A., Kumar, V., … Luciana, M. (2013). Associations between cortical thickness and general intelligence in children, adolescents and young adults. Intelligence, 41, 597–606. doi:10.1016/j.intell.2013.07.010
- Nicolson, R. I., & Fawcett, A. J. (1994). Comparison of deficits in cognitive and motor skills among children with dyslexia. Annals of Dyslexia, 44, 147–164. doi:10.1007/BF02648159
- O’Boyle, M. W., Cunnington, R., Silk, T., Vaughan, D., Jackson, G., Syngeniotis, A., & Egan, G. (2005). Mathematically gifted male adolescents activate a unique brain network during mental rotation. Cognitive Brain Research, 25, 583–587. doi:10.1016/j.cogbrainres.2005.08.004
- Olulade, O. A., Gilger, J. W., Talavage, T. M., Hynd, G. W., & McAteer, C. I. (2012). Beyond phonological processing deficits in adult dyslexics: A typical fMRI activation patterns for spatial problem solving. Developmental Neuropsychology, 37, 617–635. doi:10.1080/87565641.2012.702826
- Panizzon, M. S., Fennema-Notestine, C., Eyler, L. T., Jernigan, T. L., Prom-Wormley, E., Neale, M., … Kremen, W. S. (2009). Distinct genetic influences on cortical surface area and cortical thickness. Cerebral Cortex, 19(11), 2728–2735. doi:10.1093/cercor/bhp026
- Prescott, J., Gavrilescu, M., Cunnington, R., & O’Boyle, M. W. (2010). Enhanced brain connectivity in math-gifted adolescents: An fMRI study using mental rotation. Cognitive Neuroscience, 1, 277–288. doi:10.1080/17588928.2010.506951
- Pugh, K. R., Mencl, W. E., Shaywitz, B. A., Shaywitz, S. E., Fulbright, R. K., Constable, R. T. … Gore, J. C. (2000). The angular gyrus in developmental dyslexia: Task-Specific differences in functional connectivity within posterior cortex. Psychological Science, 11, 51–56. doi:10.1111/1467-9280.00214
- Ramos, F., & Fisher, S. (2009). Genetics of language. In M. S. Gazzaniga (Ed.), The cognitive neurosciences (Vol. IV, pp. 855–871). Cambridge, MA: MIT Press.
- Richlan, F., Kronbichler, M., & Wimmer, H. (2009). Functional abnormalities in the dyslexic brain: A quantitative meta-analysis of neuroimaging studies. Human Brain Mapping, 30, 3299–3308. doi:10.1002/hbm.20752
- Richlan, F., Kronbichler, M., & Wimmer, H. (2011). Meta-analyzing brain dysfunctions in dyslexic children and adults. NeuroImage, 56, 1735–1742. doi:10.1016/j.neuroimage.2011.02.040
- Rosas, H. D., Liu, A. K., Hersch, S., Glessner, M., Ferrante, R. J., Salat, D. H. … Fischl, B. (2002). Regional and progressive thinning of the cortical ribbon in Huntington’s disease. Neurology, 58, 695–701. doi:10.1212/WNL.58.5.695
- Ruban, L. M., & Reis, S. M. (2005). Identification and assessment of gifted students with learning disabilities. Theory Into Practice, 44, 115–124. doi:10.1207/s15430421tip4402_6
- Salat, D. H., Buckner, R. L., & Snyder, A. Z. (2004). Thinning of the cerebral cortex in aging. Cerebral Cortex, 14(7), 721–730. doi:10.1093/cercor/bhh032
- Schnack, H. G., Van Haren, N. E. M., Brouwer, R. M., Evans, A., Durston, S., Boomsma, D. I., Kahn, R. S., & Pol, H. E. H. (2014). Changes in thickness and surface area of the human cortex and their relationship with intelligence. Cerebral Cortex (New York, N.Y.: 1991). doi:10.1093/cercor/bht357
- Schneps, M. H., Brockmole, J. R., Sonnert, G., & Pomplun, M. (2012). History of reading struggles linked to enhanced learning in low spatial frequency scenes. PloS One, 7, e35724. doi:10.1371/journal.pone.0035724
- Schumacher, J., Hoffmann, P., Schmäl, C., Schulte-Korne, G., & Nothen, M. M. (2007). Genetics of dyslexia: The evolving landscape. Journal of Medical Genetics, 44, 289–297. doi:10.1136/jmg.2006.046516
- Ségonne, F., Dale, A. M., Busa, E., Glessner, M., Salat, D., Hahn, H. K., & Fischl, B. (2004). A hybrid approach to the skull stripping problem in MRI. NeuroImage, 22, 1060–1075. doi:10.1016/j.neuroimage.2004.03.032
- Ségonne, F., Pacheco, J., & Fischl, B. (2007). Geometrically accurate topology-correction of cortical surfaces using nonseparating loops. IEEE Transactions on Medical Imaging, 26, 518–529. doi:10.1109/TMI.2006.887364
- Shaw, P., Greenstein, D., Lerch, J., Clasen, L., Lenroot, R., Gogtay, N., … Giedd, J. (2006). Intellectual ability and cortical development in children and adolescents. Nature, 440, 676–679. doi:10.1038/nature04513
- Shaywitz, S. E., & Shaywitz, B. A. (2005). Dyslexia (specific reading disability). Biological Psychiatry, 57, 1301–1309. doi:10.1016/j.biopsych.2005.01.043
- Shepard, R. N., & Metzler, J. (1971). Mental rotation of three-dimensional objects. Science, 171, 701–703. doi:10.1126/science.171.3972.701
- Simos, P. G., Fletcher, J. M., Bergman, E., Breier, J. I., Foorman, B. R., Castillo, E. M., … Papanicolaou, A. C. (2002). Dyslexia-specific brain activation profile becomes normal following successful remedial training. Neurology, 58, 1203–1213. doi:10.1212/WNL.58.8.1203
- Skottun, B. C. (2005). Magnocellular reading and dyslexia. Vision Research, 45, 133–134; author reply 135–136. doi:10.1016/j.visres.2003.09.039
- Sled, J. G., Zijdenbos, A. P., & Evans, A. C. (1998). A nonparametric method for automatic correction of intensity nonuniformity in MRI data. IEEE Transactions on Medical Imaging, 17, 87–97. doi:10.1109/42.668698
- Smith, S., Gilger, J. W., & Pennington, B. F. (2002). Dyslexia and other language/learning disorders. In D. L. Rimoin, J. M. Connor, R. E. Pyeritz, & B. R. Korf (Eds.), Emery and Rimoin’s principles and practice of medical genetics (pp. 2827–2865). New York, NY: Livingstone Churchill.
- Sowell, E. R., Thompson, P. M., & Leonard, C. M. (2004). Longitudinal mapping of cortical thickness and brain growth in normal children. Journal of Neuroscience, 24, 8223–8231. doi:10.1523/JNEUROSCI.1798-04.2004
- Stein, J. (2001). The magnocellular theory of developmental dyslexia. Dyslexia, 7, 12–36. doi:10.1002/dys.186
- Tramo, M. J., Loftus, W. C., Stukel, T. A., Green, R. L., Weaver, J. B., & Gazzaniga, M. S. (1998). Brain size, head size, and intelligence quotient in monozygotic twins. Neurology, 50, 1246–1252. doi:10.1212/WNL.50.5.1246
- Treffert, D. A. (2009). The savant syndrome: An extraordinary condition. A synopsis: Past, present, future. Philosophical Transactions of the Royal Society B: Biological Sciences, 364, 1351–1357. doi:10.1098/rstb.2008.0326
- van der Mark, S., Klaver, P., Bucher, K., Maurer, U., Schulz, E., Brem, S.,… Brandeis, D. (2011). The left occipitotemporal system in reading: Disruption of focal fMRI connectivity to left inferior frontal and inferior parietal language areas in children with dyslexia. Neuroimage, 54(3), 2426–2436. doi:10.1016/j.neuroimage.2010.10.002
- Wechsler, D. (1999). Wechsler abbreviated scale of intelligence (WASI). San Antonio, TX: The Psychological Corporation.
- Wilkinson, G. S., & Robertson, G. J. (2006). Wide range achievement test (4th ed.). Lutz, FL: Psychological Assessment.
- Wolf, M., & Denckla, M. B. (2005). Rapid automatized naming and rapid automatized stimulus tests. Austin, TX: Pro-Ed Incorporated.
- Wolfe, L. E., Schreiber, H. E., & Wasserstein, J. (2008). Adult learning disorders: Contemporary issues. New York, NY: Taylor & Francis.
- Woodcock, R. W., McGrew, K. S., & Mather, N. (2001). Woodcock-Johnson III tests of achievement. Itasca, IL: Riverside.