
ABSTRACT
Changes in word production occur across the lifespan, with adolescence representing a knot point between children’s and adults’ performance and underlying brain processes. Previous studies on referential word production using picture naming tasks have shown a completely adult-like pattern in 17-year-old adolescents and an intermediate pattern between children and adults in adolescents aged 14–16 years old, suggesting a possible involvement of visuo-conceptual processes in the transition from childhood to adulthood. Given the visual nature of the picture naming task, it is unclear whether changes in visuo-conceptual processes are specifically related to the referential word production or if overall changes in conceptual to lexical processes drive maturation. To answer this question, we turned to an inferential word production task, i.e., naming from auditory definitions, involving different conceptual to lexical processes relative to referential naming. Behavior and electroencephalographic Event-Related Potentials (ERP) in a (visual) referential word production task and an (auditory) inferential word production task were recorded and compared in three groups of adolescents (respectively, aged 10 to 13, 14 to 16, and 17 to 18). Only the youngest group displayed longer production latencies and lower accuracy than the two older groups of adolescents who performed similarly on both tasks. Crucially, ERP waveform analysis and topographic pattern analysis revealed significant intergroup differences on both tasks. Changes across ages are not merely linked to the visual-conceptual processes of a picture naming task but are rather related to lexical-semantic processes involved in word production.
Introduction
In the process of human development, acquiring, producing, and retrieving words is crucial. Learning, referring, and expressing ourselves through vocabulary in potentially infinite ways makes us the most advanced species. These linguistic skills begin to develop during the first months of life, but their full achievement requires time, cerebral resources, and maturity. Thus, these different kinds of knowledge gather sufficiently only with puberty, although not linearly nor thoroughly (Jansen et al., Citation2013). The present study intends to dig into the maturation of referential and inferential word production in adolescence by investigating the behavioral, functional, and temporal dynamics of changes from late childhood to late adolescence. Specifically, we aim at understanding whether maturation is merely linked to visuo-conceptual processes, as reported in previous studies using referential (i.e., picture naming) word production tasks (Atanasova, Fargier, Zesiger, & Laganaro, Citation2021; Laganaro, Tzieropoulos, Fraunfelder, & Zesiger, Citation2015) or if overall changes occur in conceptual to lexical processes involved in word production.
Adolescence, the broad developmental period subsuming the interval between childhood and adulthood, represents the emblem of major cognitive changes. During this period, along with the dominant role of reproductive maturation, global essential cerebral changes occur, resulting in improved cognitive performance. Such important changes in cognitive performance observed in adolescents are bound to be linked to neurofunctional maturation.
Neurofunctional maturation across the lifespan seems to be confirmed by structural MRI studies; age-related linear and non-linear changes are observed in the cortical gray matter (volume, density, and thickness; Frangou, Modabbernia, & Williams et al., Citation2021; Ostby et al., Citation2009; Paus, Citation2005; Shaw et al., Citation2008; Tamnes et al., Citation2010) and white matter tracts (Giedd et al., Citation1999; Lebel & Beaulieu, Citation2011; Ostby et al., Citation2009; Paus et al., Citation1999). The first developmental differences are observed in the density of gray and white matter between children (average age 9 years) and adolescents (average age 14 years; Sowell, Thompson, Holmes, Jernigan, & Toga, Citation1999), with a lower volume of gray matter and a higher volume of white matter in the frontal cortex and parietal cortex in adolescents relative to pre-adolescents and children (Barnea-Goraly et al., Citation2005; Giedd et al., Citation1999, Citation1996; Paus et al., Citation1999; Pfefferbaum et al., Citation1994; Reiss, Abrams, Singer, Ross, & Denckla, Citation1996; Sowell et al., Citation1999). In contrast to the decline in gray matter reflecting synaptic pruning (Riley et al., Citation2018), the rise in white matter has been interpreted as reflecting myelination (or axonal caliber; Paus, Keshavan, & Giedd, Citation2008).
The cognitive changes expected to be supported by the above-mentioned brain development are enhancements in basic information processing. Specifically, there is substantial evidence that processing speed, capacity, and inhibition improve from early childhood to mid-adolescence, regardless of the cognitive task performed (Harnishfeger, Citation1995; Harnishfeger & Bjorklund, Citation1993; Kail, Citation1991, Citation1993; Kuhn et al., Citation2006; Luna, Garver, Urban, Lazar, & Sweeney, Citation2004). Hence, research on adolescent cognitive development usually reported enhanced executive control as a key component of overall cognitive growth, which corresponds to brain changes throughout this developmental period (Best & Miller, Citation2010; Fair et al., Citation2007).
Language, and particularly vocabulary, also follows a developing growing pattern alongside these changes, with adolescents being more efficient and rapid in word production. In fact, it is generally recognized that a significant amount of language growth occurs not only throughout the school-age years, but also during adolescence and well into adulthood (Nippold, Hegel, Uhden, & Bustamante, Citation1998). Summarily, the lexicon expands from approximately 300 entries after one year of life (Dale & Fenson, Citation1996) to 18,000 by the age of six (Nippold, Citation2006); however, it continues to expand during the pre-adolescent and adolescent years, so that by early adulthood, the average person will use at least 60,000 different words (Miller, Citation1996). Hence, even if the vocabulary size does not grow regularly throughout the lifespan, novel words are still acquired during adolescence and well into adulthood (Miller, Citation1996). Children not only have smaller vocabulary size, but they are also less accurate and have slower processing speed in terms of word production as compared to adults (Bragard, Schelstraete, Collette, & Grégoire, Citation2010; D’Amico, Devescovi, & Bates, Citation2001; Laganaro et al., Citation2015). Despite this, children and adults seem to rely on the same cognitive mechanisms to produce words. This is supported by the fact that, at least in picture-naming tasks, the same psycholinguistic variables predict accuracy and production latencies in youngsters (Cycowicz, Friedman, Rothstein, & Snodgrass, Citation1997) and adults (D’Amico et al., Citation2001). Thus, despite of behavioral and cognitive differences between children and adults, the same encoding mechanisms appear to underpin single-word production in both groups. Functional neuroimaging studies, however, contradicted this logic, demonstrating that differences between children and adults are not limited to processing speed and naming accuracy; in fact, some – but not all – mental processes underlying word production in picture-naming tasks appear to differ between children (7–8-year-old) and pre-adolescents (10–12 year-old) as compared to adults around the P1 and N1 components and likely related to pre-linguistic processes (Laganaro et al., Citation2015). Furthermore, Cosper, Männel, and Mueller (Citation2020) showed that on referential object modality, differences between infants and adults are observed in later time windows, likely related to lexico-semantic processing, during associative word learning. Atanasova et al. (Citation2021) introduced two groups of adolescents to fill the gap between children and adults, also using a picture-naming paradigm. The authors found that adolescents display adult-like production latencies, which were longer only for the group of children. Young adolescents (aged 14 to 16) showed intermediate results on accuracy and ERP amplitudes in early time-windows, between 90 and 200 ms following the presentation of the reference picture, while being closer to adults than children in terms of processing speed. Between the ages of 12 and 14, an important shift in brain signals and in referential word production processing speed seems thus to occur, with 17-year-old adolescents being completely adult-like and 14-to-16-year-old adolescents remaining intermediate. Based on adult behavior, the time-window of qualitative ERP changes in this early time-window (in the P1 time-range) has been associated with visual, and conceptual processes in referential naming (Indefrey & Levelt, Citation2004; see also Indefrey, Citation2011). The observed change in visual to conceptual processes is also in line with brain maturation and structural changes of the occipital regions, where no evidence of significant gray matter decline or leveling is observed in adolescence, continuing to increase through age 20, and of the gray matter in temporal regions, reaching their peak during adolescence (Giedd et al., Citation1999). Given that referential word production in picture-naming tasks specifically involves visuo-conceptual processes, the observed changes between childhood and adolescence may be specific to visual-conceptual processes rather than to changes in general/amodal (lexical-)semantic processes.
To distinguish the involvement of visuo-conceptual processes from amodal lexical-semantic processes in the development of conceptual to lexical processes, a word elicitation task distinct from picture naming is required. A different modality and process by which lexical selection is led, such as an auditory inferential word production task, should be used. Picture naming and naming from definition differ in how the word is selected: from a visual input in referential naming (thus involving visuo-conceptual processes) and through semantic associations in inferential naming (Calzavarini, Citation2017; Marconi et al., Citation2013). The depth of lexical-semantic processes has also been claimed to differ between referential and inferential naming. In an inferential naming paradigm, participants select and encode a word in response to a given definition; consequently, the semantic information supplied must be integrated to retrieve the target term. While in picture naming, minimal semantic involvement has been proposed (Kremin, Citation1988, see also e.g., naming without comprehension, Brennen, David, Fluchaire, & Pellat, Citation1996; Silveri & Colosimo, Citation1995). By contrast, word form (phonological and phonetic/motor) encoding is believed to be achieved through similar processes in both tasks (Fargier & Laganaro, Citation2017). To summarize, the two tasks entail distinct semantic processes and pathways to lexical selection, but post-lexical processes are likely to be similar, as depicted in . Supposing that the neurophysiological changes described in studies employing referential word production are specifically related to the development of visuo-conceptual processes, then changes should not be detected in an auditory inferential word production task. In the present exploratory study, we will thus examine behavioral and ERP changes associated with picture naming and naming from auditory definition in three groups of adolescents.
Figure 1. Processes involved in word production in picture naming and in naming from definition tasks (see text for details).
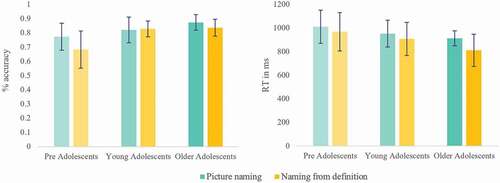
Figure 2. Naming accuracy (in %) and reaction times (RT; in ms) for groups and tasks. Error bars represent the SD.
Method
Participants
Sixty-six participants divided into three groups (pre-adolescents, young adolescents, and older adolescents) participated in the study. Pre-adolescents (n = 20, 8 females) were aged from 10;0 – ten years and zero months – to 13;9 years old (average: 11.58; SD = 1.2). Young adolescents (n = 23, 8 females) were aged from 14;0 to 16;7 years old (average: 15.4; SD = 0.72). Older adolescents (n = 23, 15 females) were aged from 17;0 to 18;2 years old (average: 17.64; SD = 0.45). They were all right-handed and French native speakers without language impairment, delay, or neurological disease. They were recruited through the personal contacts of the authors. The ethical committee of the Faculty of Psychology and Educational Science of the University approved this study. Written informed consent from adolescents, and additional parents’ approval for minors, were collected following the Declaration of Helsinki.
Tasks and material
Picture naming
One hundred and twenty black and white drawings and their corresponding modal names were selected from two French databases (Alario & Ferrand, Citation1999; Bonin, Peerman, Malardier, Méot, & Chalard, Citation2003). The stimuli corresponded to words with an age of acquisition range of 1.19–3.5 on a 5-point scale (1: learned between 0 and 3 years; 4: learned between 9 and 12 years; 5: learned after the age of 12 – not included) to ensure that all the words were known even by the youngest group of participants (see Laganaro et al., Citation2015) and with high name agreement (mean = 92.5%). The stimuli were monosyllabic (N = 40), bisyllabic (N = 60), and trisyllabic (N = 20) words, of lexical frequency ranging from 0.13 to 227 occurrences per million words (mean = 17.3) according to the French database Lexique (New, Pallier, Brysbaert, & Ferrand, Citation2004).
Naming from definition
One hundred and eight words different from those used in the picture naming task were selected from the same two French databases (Alario & Ferrand, Citation1999; Bonin et al., Citation2003). The stimuli corresponded to words with an age of acquisition range of 1.76–3.55 on a 5-point scale (1: learned between 0 and 3 years; 4: learned between 9 and 12 years; 5: learned after the age of 12 – not included) to ensure that all the words were known even by the youngest group of participants (see Laganaro et al., Citation2015). The definitions were simple sentences with the same structure and with only the last word disambiguating the defined concept (e.g., for the word to be named angel, the definition was “creature avec des ailes qui vit au paradis” – a creature with wings that lives in heaven, another example: for the word to be named cactus, the definition was “végétal piquant du désert” – spiky vegetal from the desert.). A larger set of definitions (N = 144) was pre-tested on 35 undergraduates aged 19–44 years old (average: 23, SD = 5;8 years), items that did not reach the 65% of agreement were not included in this study; thus, from the initial 144 definitions, 31 were withdrawn and five were used as warm-up fillers. The stimuli were monosyllabic (N = 25), bisyllabic (N = 65), trisyllabic (N = 15), and quadrisyllabic (N = 3) words, of lexical frequency ranging from 0.06 to 605.75 occurrences per million words (mean = 35.36) according to the French database Lexique (New et al., Citation2004).
All the material is available on the following online repository:
Procedure
The participants from the three groups underwent the picture naming and the naming from definition task in a counterbalanced order and without familiarization to the stimuli, under EEG recording in a dimly lit sound-attenuated room.
Picture naming
For the picture-naming task, stimuli were presented on a 17-inches screen (refreshment rate: 50 Hz) at a viewing distance of 60 cm. The black line drawings appeared on a white foreground, in the size of 9.5 × 9.5 cm, the background being gray. The task sequence was controlled by a PC running the E-Prime software (E-Studio). Each trial started with a fixation cross presented for 500 ms in the center of the screen, followed by the appearance of the picture for 3000 ms, during which the subjects had to overtly produce the word corresponding to the picture as fast and accurately as possible. The inter-stimulus interval was set at 2000 ms. Participants were alternatingly presented the items in two different controlled orders (regular or reversed), with a self-managed break in the middle of the task (after 60 stimuli). The controlled order was preferred to a complete randomization to avoid a succession of stimuli from the same semantic category or with high phonological overlap. Four warm-up filler trials were set at the beginning of the experiment and after the break. Overt word productions were recorded by a dynamic microphone, digitally amplified and the signal was redirected to a computer. Production latencies (reaction times in milliseconds, i.e., the time separating the picture’s onset and the speech wave’s onset) were systematically checked with a speech analysis software (Check-Vocal 2.2.6, Protopapas, Citation2007).
Naming from definition
For the naming from definition task, the auditory presentation of the definition had a duration equal to the duration of the definition +5 ms (average range of duration: 2375 ± 536 ms). Triggers were associated with the phonological unicity point of the last word of the definition (i.e., the disambiguating word). The task sequence was controlled by a PC running the E-Prime software (E-Studio). Each trial started with a blank screen presented for 250 ms, followed by a definition given auditorily. The participants had to overtly produce the word corresponding to the definition as fast and accurately as possible after the last word of the definition was pronounced. The time for response was set to 3000 ms and was followed by an inter-trial interval of 1500 ms. Participants were alternatingly presented the items in two different controlled orders (regular or reversed), with a self-managed break in the middle of the task (after 54 stimuli). The controlled order was preferred to a complete randomization to avoid a succession of stimuli from the same semantic category or with high phonological overlap. Five warm-up filler trials were set at the beginning of the experiment and after the break. Overt word productions were recorded by a dynamic microphone, digitally amplified and the signal was redirected to a computer. Production latencies (reaction times in milliseconds, i.e., the time separating the onset of the unicity point of the last word of the definition or onset of the picture from the onset of the speech wave) were systematically checked with a speech analysis software (Check-Vocal 2.2.6, Protopapas, Citation2007).
Behavioral data analyses
In both tasks, outliers (reaction times shorter than 200 ms or longer than 2000 ms) and response errors were removed from the dataset. Instances were considered errors when the answer did not match the expected response precisely or when determiners or hesitation marks preceded the answer. Reaction times data were fitted with a linear regression mixed model (Baayen, Citation2008), and accuracy data were fitted with a generalized linear mixed-effects model for binomially distributed outcomes (Jaeger, Citation2008) with the R-software (R-project, R-development core team Citation2005), including subjects and items as random effect variables and groups as fixed variable.
EEG acquisition and pre-processing
EEG was recorded using the Active-Two Biosemi EEG system (Biosemi V.O.F. Amsterdam, Netherlands) with a 128-electrode cap. The sampling frequency was set at 512 Hz (filters: DC to 104 Hz, 3 dB/octave slope). The custom online reference of the system is the common mode sense (CMS active electrode) – driven right leg (DRL passive electrode) which drives the average potentials as close as possible to the amplifier zero (for details on this setup, see: http://www.biosemi.com, for the electrode position coordinates of the 128-electrode BioSemi headcap see https://www.biosemi.com/headcap.htm). The pre-processing was conducted with the Cartool software 3.60 (Brunet, Murray, & Michel, Citation2011). Data were high-pass filtered at 0.2 Hz and low-pass filtered at 30 Hz (2nd order acausal Butterworth filter with −12 dB/octave roll-off). Epochs of 600 ms time-locked to picture onset (stimulus-locked) including 100 ms pre-stimulus and 500 ms post-stimulus and epochs of 500 ms time-locked to 100 ms before the vocal onset (response-locked) were extracted and averaged for each subject across groups. Aligning ERPs to 50 time-frames (TFs; approximately 100 ms) before the vocal onset of every single trial is done to remove pre-articulatory motor artifacts (see Fargier, Buerki, Pinet, Alario, & Laganaro, Citation2018). All epochs related to correct productions were recalculated against the average reference, visually inspected, and accepted only in the absence of artifact, i.e., eyeblinks, motor artifacts, or large amplitude variations. Only trials with artifact-free stimulus- and response-locked epochs were retained. Contaminated electrodes (max 25% of the 128 electrodes) were interpolated with a 3D splines interpolation (Perrin, Pernier, Bertrand, Giard, & Echallier, Citation1987). A minimum of 55 trials was averaged per participant. The respective rejected trial rates for pre-adolescents, young adolescents and older adolescents were 31%, 24%, and 19% for the picture naming task and 29%, 23%, and 22% for the naming from definition task.
EEG data analyses
The ERPs were first subjected to a sampling point-wise ERP waveform analysis to determine the time-periods presenting local differences in ERP amplitudes between age groups, separately for each task. Given the multiple testing problem, for which correction methods do not capture the temporal correlation structure of the statistical tests, we used the cluster mass method, proposed by Maris and Oostenveld (Citation2007), based on the permutation theory. The cluster mass method is grounded on repeated measures ANOVAs, and it relies on a continuity argument that implies that an effect will appear into clusters of adjacent timeframes; the clusters are formed using a threshold τ. All the adjacent time points for which the statistics are above this threshold define one cluster. Here, we used the permuco and permuco4brain packages in R, developed by Frossard and Renaud (Citation2021). First, an analysis was run including the three groups (see, respectively, for picture naming and naming from definition) using the cluster mass method on stimulus-aligned and response-aligned ERPs, then two by two group comparisons were run on adjacent groups separately (see Appendix B). By default, permuco uses the sum for an F-statistic and the sum of squares for a t-statistic. An effect was considered significant if it lasted for at least 20 consecutive ms and was present on five adjacent electrodes, alpha being set to 0.05, the number of randomizations preformed was set to 5000.
Figure 3. Picture naming task. (a) Exemplar condition-averaged Event-Related Potential waveform (Oz) for the three groups plotted in microvolts in function of time. (b) Periods of significant differences (in red p < .01, in yellow p < .05, in white p ≥ .05) in amplitudes between the three groups on each electrode and time-frame for the stimulus-locked and response-locked Event-Related Potentials. (c) Periods of significant differences in the topographic ANOVA analysis (p < .01) in turquoise.
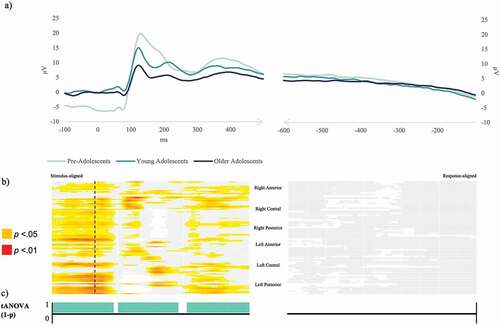
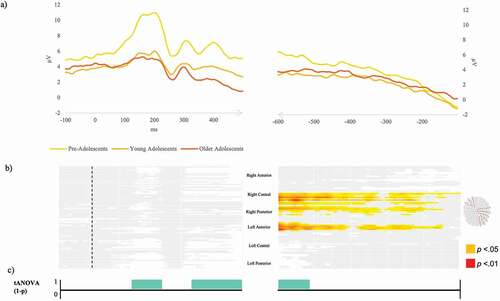
Figure 4. Naming from definition task. (a) Exemplar condition-averaged Event-Related Potential waveform (Oz) for the three groups plotted in microvolts in function of time. (b) Periods of significant differences (in red p < .01, in yellow p < .05, in white p ≥ .05) in amplitudes between the three groups on each electrode and time-frame for the stimulus-locked and response-locked Event-Related Potentials. Visualization of electrode sites yielding significant difference are highlighted on the scalp exemplar. (c) Periods of significant differences in the topographic ANOVA analysis (p < .01) in turquoise.
Because waveform differences do not inform on the qualitative versus quantitative nature of the observed changes, the principal analysis consisted of the spatio-temporal segmentation (topographic or microstate analysis). Considering that periods of stable global electric fields likely correspond to particular periods in mental information processing (Changeux & Michel, Citation2004; Koukou & Lehmann, Citation1987; Lehmann & Skrandies, Citation1984; Lehmann, Strik, Henggeler, Koenig, & Koukkou, Citation1998), topographic differences across groups would indicate different underlying brain processes, or different dynamics of the same mental processes. Thus, this analysis allows summarizing ERP data into a limited number of stable topographic map configurations, while independent from the used reference electrodes and not sensitive to pure amplitude modulations across conditions.
Before running the topographic analysis, we performed topographic consistency tests (TCT, Koenig & Melie-García, Citation2010) on stimulus-locked and response-locked ERPs to ensure that different topographies were not driven by random noise in the within-group data. This analysis allowed us to determine whether topographic patterns were consistent across subjects in each dataset (see Appendix A).
The first topographic analysis identified periods of significant topographic modulation between groups on each sampling point on stimulus- and response-locked ERPs, separately for each task. This procedure is called tANOVA; it consists of a non-parametric randomization test based on global dissimilarities between electric fields, which, in contrast to channel comparisons, computes global dissimilarity of the whole electric field topographies and tests for the significance of the said topographic differences at each time-point (Murray, Brunet, & Michel, Citation2008). The permutation of the data is accomplished by randomly re-assigning the topographic maps of single subjects to the different conditions. The global dissimilarity of these random group-averaged ERPs is compared time-point by time-point with the values of topographic dissimilarity of the actual conditions. The criterion we applied was of 12 time-frames (about 24 ms) of consecutive significant differences. Neurophysiologically, differences in topography directly indicate changes in the configuration of the active neuronal sources in the brain. The tANOVA analysis is used to test for differences in topography. Comparing the tANOVA results with the microstate segmentation is essential for disentangling the topographic differences, which are yielded by temporal shifts of the same patterns of the global distribution of the signal at scalp from topographic differences, which are the consequences of different underlying sources. Topographic analyses were performed on both stimulus-aligned and response-aligned ERP signals across groups using the Ragu software (Koenig & Melie-García, Citation2010).
Scalp electric field topography remains in a stable configuration for a limited period of time: differences in topography indicate changes in the configuration of the active neuronal sources in the brain (Murray et al., Citation2008). This analysis involves a spatio-temporal segmentation of the ERPs over periods of electrophysiological stability by compressing the variability of ERPs in a series of topographical maps that summarize data and indicate which template explains ERPs in each group. Built on the spatio-temporal segmentation of the signal, the global topographic analyses enable the summary of neural activity in terms of stable electrophysiological activities at the scalp (Lehmann & Skrandies, Citation1984). Combining local waveform and global topographic analyses thus constitutes a great tool to evaluate quantitative (i.e., same topographic patterns, varying in duration) and/or qualitative (i.e., different topographic patterns) differences in neural events across groups of individuals. The spatio-temporal segmentation was computed with the software Ragu (König et al., Citation2011). The optimal number of topographic map templates that best explained datasets was determined using a cross-validation procedure, applied 50 times. The subjects were split into training and test datasets, and 1 to 20 microstates classes were tested. Every microstate identification run used the traditional k-means cluster algorithm (50 random initializations each). Statistical smoothing was used to eliminate temporally isolated maps with low strength (10 points smoothing with a penalty factor of 3). The number of topographic maps with the higher correlation value is retained as the optimal number of maps for the current dataset. The spatio-temporal segmentation was applied to the data corresponding to the three groups (“pre-adolescents,” “young adolescents,” and “older adolescents”).
The main advantage of this approach is that the identification of the topographic patterns and the fitting procedure are performed on the same data. Hence, the similarity between the topographic maps obtained from the segmentation and the topographic maps these segmentations are assigned to during the fitting procedure is maximized, leading to increased statistical power.
The back-fitting procedure is obtained by labeling each time point according to the map with which it best correlates spatially. This is achieved through randomization procedures; for details of this procedure, see Koenig, Stein, Grieder, and Kottlow (Citation2014). This “fitting” procedure provides the information required to understand how much a topographic map observed in a given group explains an individual participant’s ERP data. Measures of the map (microstate) presence and duration in each individual ERP were obtained and used to test statistical differences among groups and conditions. The presence of the fitted microstates across individual ERPs from the three groups was analyzed with generalized linear models, and their duration (number of time-frames) was analyzed with linear models.
Results
Behavioral results
Accuracy and reaction time (RT) per task are presented in . In the picture-naming task, production accuracy was 3% lower in pre-adolescents relative to young adolescents (z = 2.62, p = .009, β = 0.58, SE = 0.22) and 6% lower relative to older adolescents (z = 4.47, p < .001, β = 0.99, SE = 0.22), without significant difference between the two groups of adolescents (z = 1.91, p = .055, β = 0.41, SE = 0.22).
Production latencies in picture naming differed across groups (F(2, 62.97) = 5.42, p = .007). Between-group differences were significant for pre-adolescents who were on average around 100 ms slower than older adolescents (t(62.95) = −3.28 p = .002, β = −0.11, SE = 0.03), and marginally slower relative to young adolescents (t(63.17) = −1.99, p = .051, β = −0.07, SE = 0.03). Young and older adolescents did not differ significantly on RTs (t(62.80) = −1.34, p = .184, β = −0.04, SE = 0.03).
In the naming from definition task, production accuracy was 14% lower in pre-adolescents relative to both young adolescents (z = 5.46, p < .001, β = 0.91, SE = 0.17) and older adolescents (z = 5.77, p < .001, β = 0.99, SE = 0.17). The two older group displayed similar accuracy (z = −0.45, p = .65, β = −0.07, SE = 0.17).
Production latencies for naming from definition differed across groups (F(2, 63.3) = 6.96, p = .02). Between-group differences were significant for pre-adolescents as compared to the older adolescent group (t(63.46) = −3.67, p < .001, β = −0.21, SE = 0.06), the youngest being almost 200 ms slower. Young adolescents were also slower as compared to the older adolescent group, the latter being 60 ms faster (t(62.87) = 2.4, p = .02, β = 0.13, SE = 0.06). No significant difference was observed between the youngest two groups, i.e., pre-adolescents compared to young adolescents (t(63.59) = −1.41, p = .164, β = −0.08, SE = 0.06).
For detailed tables, see Appendix E.
ERP results
Waveforms
The results of the waveform analyses computed on the three age-groups together are displayed in (picture naming) and in (naming from definition). For the picture-naming task, the statistical analyses on ERP amplitudes across the three groups yielded significant differences on most electrodes all along the stimulus-locked ERPs (), with a major difference in the very first time-window (−100 to 100 ms) as well as around 150 ms, 250 ms, and 350–400 ms. Virtually, no significant differences were found in the response-locked ERPs (). The waveform analyses computed on two consecutive age-groups (see Appendix B) show that the differences in amplitudes in the very first time-window (−100 to 100 ms) were carried by the difference between the two youngest groups, whereas differences in amplitudes starting from around 110 ms after the display of the stimulus appeared in all comparisons.
In the naming from definition task, the analyses on ERP waveforms across the three groups yielded virtually no significant differences on amplitudes in the stimulus-locked ERP. In the response-locked ERPs, differences were observed along the whole signal, mostly on the right central, right posterior and left anterior electrodes. The waveform analyses computed on two consecutive age-groups (see Appendix B) show no significant differences.
tANOVA analysis
The results of the tANOVA, displayed in for the picture naming task, show significant differences on the totality of the stimulus-aligned ERP signal, with exception of 10 ms around 80 ms after stimulus and 15 ms around 270 ms after stimulus appearance where no differences were detected. No significant periods were identified on the response-aligned signal.
In , the results of the tANOVA are displayed for the naming from definition task. Significant differences across groups appeared in the time-windows from 130 to 210 ms after stimulus appearance, as well as from 320 to the end of the stimulus-aligned ERP signal. On the response-aligned signal, a significant time-window of difference in the tANOVA was disclosed from 600 ms to 530 ms before the response.
Microstate analysis
For the picture-naming task, the microstate segmentation revealed a best model explaining 98% of variance with 13 different topographic maps from 100 ms before picture onset to 100 ms before vocal onset (). On the grand averages, different periods of topographic stability appeared for pre-adolescents, as compared to older groups, in early time-windows (Maps 1, 2, 4, 5 in ), and later time-windows (7, 8 in ). On response-locked ERPs, the sequence of topographic maps was similar across age-groups.
Figure 5. Group-averaged event-related potentials for the picture-naming task (Event-Related Potentials; 128 electrodes, each displayed as a black plotted line) for each group (pre-adolescents, young adolescents, and older adolescents) from 100 ms before stimulus onset to 500 ms and from −600 to 100 ms before vocal onset. The temporal distribution of the topographic maps in each data set revealed by the spatio-temporal segmentation analysis is superposed with code colors. The 13 corresponding template maps are displayed with positive values in red and negative values in blue.
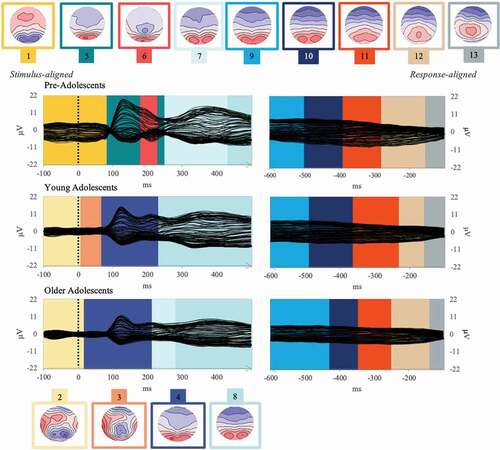
The analyses showed that the first three Maps preceding the P100 were equally present across the three groups, although Maps 1 and 2 were differently distributed across groups (Map 1 was significantly longer in pre-adolescent (152 ms) compared to the two older groups, 82 and 89 ms, while Map 2 lasted, respectively, 25 and 28 ms less in the two youngest groups as compared to the oldest group (see details of statistical results in Appendix C).
Maps 4 and 5, underlying the P1 component (peaking around 120 ms) were highly correlated (97%), but were nevertheless differently distributed in pre-adolescents relative to the two oldest groups: Map 4 was less present among the youngest group (in 9 participants out of 20, compared to 78% and 83% among the older groups), and Map 5 was more present (in 18 out of 20 pre-adolescents, compared to 35% and 43% among the older groups). Although Map 6 seems to be present only in the group-averaged ERP of pre-adolescents around 200 ms (see ), there were virtually no significant differences across groups in the fitting in the individuals, with 70% of pre-adolescents presenting it, 40% of young adolescents and 61% of older adolescents and similar duration (see Appendix C).
Map 7 was significantly more present among pre-adolescents (19 out of 20) as compared to young adolescents (13 out of 23). While Map 8 only showed differences in duration, with, respectively, 105 and 77 ms shorter duration in the youngest group as compared to the two oldest groups. Maps 7 and 8 correlated at 98%.
Finally, the absence of statistical differences was confirmed on the response-locked ERPs.
For detailed statistics, see Appendix C, Tables 1 and 2.
For the naming from definition task, the microstate segmentation revealed a best model explaining 97% of variance with 13 different topographic maps from 100 ms before stimulus onset to 100 ms before vocal onset (). On the grand averages, different periods of topographic stability appeared for pre-adolescents, as compared to older groups, after 300 ms in the stimulus-locked ERPs. These differences seem to continue into and until the end of the response-locked ERP, while young adolescents and older adolescents seem to present much less differences on their respective grand-average ERPs.
Figure 6. Group-averaged event-related potentials for the naming from definition task (Event-Related Potentials; 128 electrodes, each displayed as a black plotted line) for each group (pre-adolescents, young adolescents, and older adolescents) from 100 ms before the stimulus onset to 100 ms before vocal onset. The temporal distribution of the topographic maps in each data set revealed by the spatio-temporal segmentation analysis is superposed with code colors. The 13 corresponding template maps are displayed with positive values in red and negative values in blue.
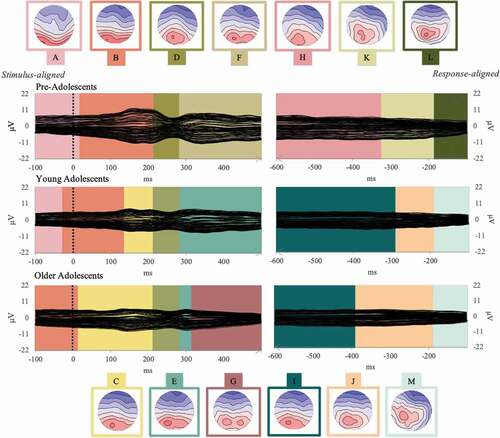
The fitting procedure yielded no significant differences on presence for the first five topographic maps (A to E), which yielded different time-distribution across groups for maps A, C, and E. Map A was significantly longer in the youngest groups as compared to the oldest group (respectively, 99 and 71 ms longer). Map C followed an opposite direction, but only the oldest group differed from the youngest (which presented a map 52 ms shorter as compared to the oldest group). Map E was significantly longer in young adolescents (112 ms) as compared to pre-adolescents (35 ms).
After this first period, all maps differed significantly in terms of presence among the groups. Map F (from about 280 to about 500 ms) was significantly more present in pre-adolescents (13 out of 20) as compared to young adolescents (6 out of 23), but not when compared to older adolescents (8 out of 23).
Map G, appearing in similar time-windows as Map F, was significantly more present in older adolescents (21 out of 23 presented this map), compared to pre-adolescents (5 out of 20) and to young adolescents (10 out of 23). Maps F and G correlated at 95%.
On the response-locked ERPs, Maps H, K, and M were significantly more present in pre-adolescents as compared to the older groups, while Maps I, J, and L were globally more present for the two oldest groups. Map H was present in 15 pre-adolescents out of 20, but only in 9 out of 23 young adolescents and 7 out of 23 older adolescents. Thirteen out of 20 pre-adolescents presented Map K, but only 6 young adolescents and 8 out of 20 older adolescents. Although map M seems to be more present on the grand averages of the oldest groups, it was significantly more presented in the pre-adolescents (15 out of 20), than in the other two groups (9 in young adolescents and 8 in older adolescent). Map I was present in almost the totality of the older groups (20/23 young adolescents and 19/23 older adolescents) but only in 11 pre-adolescents. Likewise, map J was mostly present among young adolescents (14 out of 23) and older adolescents (16 out of 23), but only one-fifth of the pre-adolescents presented this map. Finally, counterintuitively to what is displayed in , map L was also less present among pre-adolescents (3 out of 20), but the majority of the young adolescents (14 out of 23) displayed it, as well as 11 older adolescents (out of 23).
For detailed statistics, see Appendix C, Tables 3 and 4.
Discussion
The aim of this study was to investigate behavioral and ERP differences across three age-groups of adolescents in two different single-word production tasks. In particular, given the ambiguity on the role of visual processes in changes across age-groups in previous studies that only investigated visually elicited word production (referential naming), we compared a picture-naming task to an auditory naming from definition task, which differs in the perceptual modality and semantic process by which the single word to be produced is selected.
Only pre-adolescents (aged 10 to 13) produced less correct responses than the two other groups (14–16 years old young adolescents and 17–18 years old older adolescents) in both tasks. Reaction times were significantly longer only in pre-adolescents as compared to the oldest adolescent group but not when compared to the young adolescent group in both tasks. The younger group of adolescents was significantly slower compared to the older group of adolescents in the naming from definition task, but not in the picture-naming task.
At the neurophysiological level, the patterns of waveform amplitude differences across groups were not identical on the two tasks. In the referential naming task, young adolescents displayed intermediate amplitudes between pre-adolescents and the oldest group in the stimulus-locked ERPs only, while in the inferential naming task amplitudes did not differ across groups in the stimulus-locked ERPs and no difference was observed across continuous groups in the response-locked ERPs, suggesting that the differences observed in the response-locked are across the two extreme groups.
The periods of stable topographic patterns also differed across tasks; in picture naming the differences were observed mostly from the P100 component and until 400–500 ms between the pre-adolescents and the older groups, while in the naming from definition task the functional differences started around 300 ms and were presented all along the signal until 100 ms before vocal onset.
Before digging into the main question of the role of lexical-semantic processes in the differences observed across groups in adolescence, we will discuss the differences observed on amplitudes across groups by relating them to the literature on skull maturation.
Changes in amplitudes and skull thickness
In the literature, the developmental decrease of amplitudes has been largely linked to the progressive thickening of children’s skulls (Chauveau et al., Citation2004; Picton & Taylor, Citation2007). If this was the source of the differences, we would anticipate uniformly distributed amplitude differences across tasks and time-periods. This was not the case in the current study. In fact, while larger amplitudes on the stimulus-locked signal were quasi systematic across groups in the referential task, we did not observe the same pattern for the inferential task, where virtually no amplitudes differences across groups were present on the stimulus-aligned ERPs but only along the whole response-aligned signal. These distinct results across tasks are unlikely due to the same maturation phenomena.
An alternative explanation of amplitude differences across ages may thus be related to increased age-related automaticity in task performance (Durston & Casey, Citation2006). Durston & Casey affirm that lower amplitudes could be interpreted as the result of higher automaticity during a task, with automatization being the consequence of the combination of myelination (Picton & Taylor, Citation2007), and synaptic pruning (Itier & Taylor, Citation2004; Taylor, Edmonds, McCarthy, & Allison, Citation2001), two phenomena that are largely distinct through brain regions. The brain processes required to perform the two tasks (i.e., referential and inferential) are thought to be common only after lexical selection, with some task-specific areas: involvement of the left middle temporal gyrus for the inferential task and the right frontal lobes in the referential task, and with an important functional connectivity between the ventromedial prefrontal cortex and the lateral occipital cortex, for the referential tasks (Marconi et al., Citation2013; Pantazatos, Yanagihara, Zhang, Meitzler, & Hirsch, Citation2012). Moreover, the decrease in gray matter occurs much earlier in the temporal cortex as compared to the occipital cortex, meaning that the temporal cortex, which is largely involved in the inferential task, is already much similar to an adult cortex in adolescence, while their occipital cortex, which is involved in picture naming, is still in development during adolescence (Giedd et al., Citation1999). Although new evidence suggests and confirms that the left temporal cortex is also consistently involved in the lexical-semantic processes for the picture naming task (Ala-Salomäki, Kujala, Liljeström, & Salmelin, Citation2021). In sum, the different developmental patterns of ERP amplitudes may be due to the different brain regions involved in the two different tasks, which do not develop homogeneously.
Age-related changes in visual-semantic versus lexical-semantic processes in word production
For the picture-naming task, developmental changes, especially in the time-range of the visual evoked potentials (VEP) have been well documented in the literature. P1 and N1 are two major VEP components, respectively, a positive ERP component on posterior electrodes, occurring approximately 100 ms after stimulus presentation and a central negative peak around 170 milliseconds after stimulus presentation (Creel, Citation2019). The presence of a different P1 microstate in children (10–12 years old), as compared to older groups, has been previously reported (Atanasova et al., Citation2021; Holcomb, Coffey, & Neville, Citation1992; Laganaro et al., Citation2015). Here, our youngest group is aged 10 to 13;6 years old, but the differences seem to be replicated. The topographies in the following time-window, on the P2 component, also showed differences between pre-adolescents and young adolescents, in terms of presence and underlying topographies (Map 7, ). The P2 component, likely associated with lexical selection in picture naming (Aristei, Melinger, & Abdel Rahman, Citation2011; Laganaro et al., Citation2015; Laganaro, Valente, & Perret, Citation2012; Maess, Friederici, Damian, Meyer, & Levelt, Citation2002; Strijkers, Costa, & Thierry, Citation2010), also seems to be similar in our youngest group as compared to children aged 10–12 years old described in previous papers (Atanasova et al., Citation2021; Laganaro et al., Citation2015). Also, the middle group presented intermediate amplitudes in the early time-windows in the picture naming task. In sum, the ongoing amplitude shrinking in a referential task is coherent with the literature on VEP and would suggest that the main developmental differences would be linked to the maturation of occipital areas as discussed in the previous section. The question then is whether the pattern of behavioral and ERP differences observed in picture naming is merely due to visual-conceptual processes or if they extend to language processes. In the group comparison in the inferential task, although a first sensory component is clearly present, peaking around 120–170 ms, the amplitude pattern across groups does not replicate the one observed in the referential task, as minor differences seem to appear only between the youngest group and the older ones, while the middle group does not present significant differences in this time-window. These findings seem to be coherent with the literature of the maturation of the auditory system, where a plateau in AEP peak from 9 to 11 years of age is described (Cassvan, Citation1994; Ponton, Eggermont, Kwong, & Don, Citation2000). Crucially, however, in the referential task ERP differences across groups appeared in later time-windows and behavioral differences were also observed.
Thus, a first conclusion is that the differences observed across age-groups in the picture-naming task may not exclusively be linked to the visual-to-conceptual processes, since inter-group differences are also present in the naming from definition task – not involving the visual processes. The tANOVA and the microstate analyses showed a time-window of changes in naming from definition, starting 300 ms after the last word of the definition, which has been associated to lexical-semantic (lexical selection) processes in a previous study using this task (Fargier & Laganaro, Citation2017) based on the fact that lexical frequency effects appeared in this time-window, i.e. the same effects reported in picture naming on the P2 component (Strijkers et al., Citation2010).
Thus, semantic-to-lexical selection processes in picture naming and in naming from definition are both undergoing changes. The underlying brain processes do not seem to develop at the same pace: auditory processes are already wired among adolescents, while visual changes and the brain regions involved in lexical-semantic processes are still undergoing maturation (Giedd et al., Citation1999). Whereas in picture naming the ongoing maturation of occipital areas in adolescence (Giedd et al., Citation1999; Lenroot & Giedd, Citation2006) may have limited the observed changes to visual-semantic processes, the differences observed in later time-windows of the inferential tasks allow the assumption that the ongoing maturation is not linked to perceptive difference but conversely to lexical-semantic processes. In fact, when looking back at the question of when adolescents become adult-like, there is no strong assumption that all processes should mature at once, but they should be gradual because different processes involve different brain regions with some processes becoming adult-like before others.
In sum, this study allowed us to disentangle the results observed in referential naming tasks and reject the hypothesis that the developmental changes observed in a referential task can be merely linked to the visual processes involved in the pre-linguistic processes in such task. The maturation occurring during adolescence seems to be then driven by overall changes in conceptual to lexical processes. Furthermore, lexical-semantic processes involve selecting the correct word among the semantically activated competitors. This process also involves executive control mechanisms, with inhibition argued to play a key role (de Zubicaray, McMahon, Eastburn, & Pringle, Citation2006; de Zubicaray, Wilson, McMahon, & Muthiah, Citation2001; Shao, Roelofs, & Meyer, Citation2012). This aligns with the existing studies in the field of cognitive development (e.g., Kail, Citation1991, Citation1993; Luna et al., Citation2004), where substantial evidence suggests that performance improves regardless of the cognitive task performed, implying increased executive control and inhibition.
Conclusions
Linguistic proficiency is considered sufficient but not exhaustive in adolescence, a period where the brain undergoes massive changes in terms of architecture and functional patterns. Previous studies of referential word production pointed to changes from childhood to adolescence or adulthood linked to the maturation of the visuo-conceptual processes in such task, leaving open the question of whether changes in word production are also underpinned by amodal lexical-semantic processes. In order to understand the role of lexical-semantic encoding in the development of word production, the present study tracked simultaneously the behavioral, functional, and temporal changes in word planning processes in a referential and in an inferential task in three groups of adolescents. The results allowed us to conclude that lexical-semantic encoding is still changing among adolescents; thus, the development of word production is driven by overall changes in conceptual to lexical selection.
Supplemental Material
Download MS Word (456.6 KB)Disclosure statement
No potential conflict of interest was reported by the authors.
Supplementary material
Supplemental data for this article can be accessed online at https://doi.org/10.1080/87565641.2022.2112195
Additional information
Funding
References
- Ala-Salomäki, H., Kujala, J., Liljeström, M., & Salmelin, R. (2021). Picture naming yields highly consistent cortical activation patterns: Test–retest reliability of magnetoencephalography recordings. NeuroImage, 227, 117651. doi:10.1016/j.neuroimage.2020.117651
- Alario, F. X., & Ferrand, L. (1999). A set of 400 pictures standardized for French: Norms for name agreement, image agreement, familiarity, visual complexity, image variability, and age of acquisition. Behavior Research Methods, Instruments, & Computers, 31(3), 531–552. doi:10.3758/BF03200732
- Aristei, S., Melinger, A., & Abdel Rahman, R. (2011). Electrophysiological chronometry of semantic context effects in language production. Journal of Cognitive Neuroscience, 23(7), 1567–1586. doi:10.1162/jocn.2010.21474
- Atanasova, T., Fargier, R., Zesiger, P., & Laganaro, M. (2021). Dynamics of word production in the transition from adolescence to adulthood. Neurobiology of Language, 2(1), 1–21. doi:10.1162/nol_a_00024
- Baayen, R. H. (2008). Analyzing linguistic data: A practical introduction to statistics using R. Cambridge, UK: Cambridge University Press.
- Barnea-Goraly, N., Menon, V., Eckert, M., Tamm, L., Bammer, R., Karchemskiy, A., Reiss, A. L. (2005). White matter development during childhood and adolescence: A cross-sectional diffusion tensor imaging study. Cerebral Cortex, 15(12), 1848–1854. doi:10.1093/cercor/bhi062
- Best, J. R., & Miller, P. H. (2010). A developmental perspective on executive function. Child Development, 81(6), 1641–1660. doi:10.1111/j.1467-8624.2010.01499.x
- Bonin, P., Peerman, R., Malardier, N., Méot, A., & Chalard, M. (2003). A new set of 299 pictures for psycholinguistic studies: French norms for name agreement, image agreement, conceptual familiarity, visual complexity, image variability, age of acquisition, and naming latencies. Behavior Research Methods, Instruments, & Computers, 35(1), 158–167. doi:10.3758/BF03195507
- Bragard, A., Schelstraete, M.-A., Collette, E., & Grégoire, J. (2010). Évaluation du manque du mot chez l’enfant: Données développementales récoltées auprès d’enfants francophones de sept à 12 ans. European Review of Applied Psychology, 60(2), 113–127. doi:10.1016/j.erap.2009.11.003
- Brennen, T., David, D., Fluchaire, I., & Pellat, J. (1996). Naming faces and objects without comprehension - A case study. Cognitive Neuropsychology, 13(1), 93–110. doi:10.1080/026432996382079
- Brunet, D., Murray, M. M., & Michel, C. M. (2011). Spatiotemporal analysis of multichannel EEG: CARTOOL. Computational Intelligence and Neuroscience, (2011, 813870. doi:10.1155/2011/813870
- Calzavarini, F. (2017). Inferential and referential lexical semantic competence: A critical review of the supporting evidence. Journal of Neurolinguistics, 44, 163–189. doi:10.1016/j.jneuroling.2017.04.002
- Cassvan, A. (1994). Auditory Evoked Potentials. In J. A. Downey, S. J. Myers, E. G. Gonzalez, & J. S. Lieberman (Eds.), The physiological basis of rehabilitation medicine (2nd ed.). Oxford: Butterworth-Heinemann. 295–323.
- Changeux, J. P., & Michel, C. M. (2004). Mechanisms of neural integration at the brain scale level: The neuronal workspace and microstate models. In S. Grillner & A. M. Grabyel (Eds.), Microcircuits: The interface between neurons and global brain function. Cambridge, MA: MIT Press. 347–370.
- Chauveau, N., Franceries, X., Doyon, B., Rigaud, B., Morucci, J. P., & Celsis, P. (2004). Effects of skull thickness, anisotropy, and inhomogeneity on forward EEG/ERP computations using a spherical three-dimensional resistor mesh model. Human Brain Mapping, 212(2), 86–97. doi:10.1002/hbm.10152
- Cosper, S. H., Männel, C., & Mueller, J. L. (2020). In the absence of visual input: Electrophysiological evidence of infants’ mapping of labels onto auditory objects. Developmental Cognitive Neuroscience, 45, 100821. doi:10.1016/j.dcn.2020.100821
- Creel, D. J. (2019). Visually evoked potentials. Handbook of Clinical Neurology, 160, 501–522.
- Cycowicz, Y. M., Friedman, D., Rothstein, M., & Snodgrass, J. G. (1997). Picture naming by young children: Norms for name agreement, familiarity, and visual complexity. Journal of Experimental Child Psychology, 65(2), 171–237. doi:10.1006/jecp.1996.2356
- D’Amico, S., Devescovi, A., & Bates, E. (2001). Picture naming and lexical access in Italian children and adults. Journal of Cognition & Development, 2(1), 71–105. doi:10.1207/S15327647JCD0201_4
- Dale, P. S., & Fenson, L. (1996). Lexical development norms for young children. Behavior Research Methods, Instruments, & Computers, 28(1), 125–127. doi:10.3758/BF03203646
- de Zubicaray, G. I., McMahon, K., Eastburn, M., & Pringle, A. (2006). Top-down influences on lexical selection during spoken word production: A 4T fMRI investigation of refractory effects in picture naming. Human Brain Mapping, 27(11), 864–873. doi:10.1002/hbm.20227
- de Zubicaray, G. I., Wilson, S. J., McMahon, K. L., & Muthiah, S. (2001). The semantic interference effect in the picture-word paradigm: An event-related fMRI study employing overt responses. Human Brain Mapping, 14(4), 218–227. doi:10.1002/hbm.1054
- Durston, S., & Casey, B. J. (2006). What have we learned about cognitive development from neuroimaging? Neuropsychologia, 44(11), 2149–2157. doi:10.1016/j.neuropsychologia.2005.10.010
- Fair, D. A., Dosenbach, N. U. F., Church, J. A., Cohen, A. L., Brahmbhatt, S., Miezin, F. M., Schlaggar, B. L. (2007). Development of distinct control networks through segregation and integration. Proceedings of the National Academy of Sciences, 104(33), 13507–13512.
- Fargier, R., Buerki, A., Pinet, S., Alario, F.-X., & Laganaro, M. (2018). Word onset phonetic properties and motor artifacts in speech production EEG recordings. Psychophysiology, 55(2), e12982. doi:10.1111/psyp.12982
- Fargier, R., & Laganaro, M. (2017). Spatio-temporal dynamics of referential and inferential naming: Different brain and cognitive operations to lexical selection. Brain Topography, 30(2), 182–197. doi:10.1007/s10548-016-0504-4
- Frangou, S., Modabbernia, A., Williams, S. C. R. et al. (2021). Cortical thickness across the lifespan: Data from 17,075 healthy individuals aged 3-90 years. Human Brain Mapping 43, 431–451.
- Frossard, J., & Renaud, O. (2021). Permutation tests for regression, ANOVA, and comparison of signals: The permuco package. Journal of Statistical Software, 99(15), 1–32. doi:10.18637/jss.v099.i15
- Giedd, J. N., Blumenthal, J., Jeffries, N. O., Castellanos, F. X., Liu, H., Zijdenbos, A., Rapoport, J. L. (1999). Brain development during childhood and adolescence: A longitudinal MRI study. Nature Neuroscience, 2(10), 861–863. doi:10.1038/13158
- Giedd, J. N., Snell, J. W., Lange, N., Rajapakse, J. C., Casey, B. J., Kozuch, P. L., Rapoport, J. L. (1996). Quantitative magnetic resonance imaging of human brain development: Ages 4-18. Cereb Cortex, 6(4), 551–560.
- Harnishfeger, K. K. (1995). The development of cognitive inhibition: Theories, definitions, and research evidence. In F. N. Dempster & C. J. Brainerd (Eds.), Interference and inhibition in cognition (pp. 175–204). Cambridge, MA: Academic Press.
- Harnishfeger, K. K., & Bjorklund, D. F. (1993). The ontogeny of inhibition mechanisms: A renewed approach to cognitive development. In M. L. Howe & R. Pasnak (Eds.), Emerging themes in cognitive development. New York, NY: Springer 28–49 .
- Holcomb, P. J., Coffey, S. A., & Neville, H. J. (1992). Visual and auditory sentence processing: A developmental analysis using event-related brain potentials. Developmental Neuropsychology, 8(2–3), 203–241. doi:10.1080/87565649209540525
- Indefrey, P. (2011). The spatial and temporal signatures of word production components: A critical update. Frontiers in Psychology, 2, 255. doi:10.3389/fpsyg.2011.00255
- Indefrey, P., & Levelt, W. J. M. (2004). The spatial and temporal signatures of word production components. Cognition, 92(1–2), 101–144. doi:10.1016/j.cognition.2002.06.001
- Itier, R. J., & Taylor, M. J. (2004). Source analysis of the N170 to faces and objects. NeuroReport, 15(8), 1261–1265. doi:10.1097/01.wnr.0000127827.73576.d8
- Jaeger, T. F. (2008). Categorical data analysis: Away from ANOVAs (transformation or not) and towards logit mixed models. Journal of Memory and Language, 59(4), 434–446. doi:10.1016/j.jml.2007.11.007
- Jansen, R., Ceulemans, E., Grauwels, J., Maljaars, J., Zink, I., Steyaert, J., & Noens, I. (2013). Young children with language difficulties: A dimensional approach to subgrouping. Research in Developmental Disabilities, 34(11), 4115–4124. doi:10.1016/j.ridd.2013.08.028
- Kail, R. (1991). Developmental change in speed of processing during childhood and adolescence. Psychological Bulletin, 109(3), 490–501. doi:10.1037/0033-2909.109.3.490
- Kail, R. (1993). Processing time decreases globally at an exponential rate during childhood and adolescence. Journal of Experimental Child Psychology, 56(2), 254–265. doi:10.1006/jecp.1993.1034
- Koenig, T., Kottlow, M., Stein, M., & Melie-García, L. (2011). Ragu: A free tool for the analysis of EEG and MEG event-related scalp field data using global randomization statistics. Computational Intelligence and Neuroscience, 2011, 938925. doi:10.1155/2011/938925
- Koenig, T., & Melie-García, L. (2010). A method to determine the presence of averaged event-related fields using randomization tests. Brain Topography, 23(3), 233–242. doi:10.1007/s10548-010-0142-1
- Koenig, T., Stein, M., Grieder, M., & Kottlow, M. (2014). A tutorial on data-driven methods for statistically assessing ERP topographies. Brain Topography, 27(1), 72–83. doi:10.1007/s10548-013-0310-1
- Koukou, M., & Lehmann, D. (1987). An Information processing perspective of psychophysiological measurements. Journal of Psychophysiology, 1, 109–112.
- Kremin, H. (1988). Independence of access to meaning and phonology: Arguments for direct non-semantic pathways for the naming of written words and pictures. In G. Denes, C. Semenza, & P. Bisiacchi (Eds.), Perspectives on cognitive neuropsychology. London, UK: Routledge 231–252.
- Kuhn, M. R., Schwanenflugel, P. J., Morris, R. D., Morrow, L. M., Woo, D. G., Meisinger, E. B., Stahl, S. A. (2006). Teaching children to become fluent and automatic readers. Journal of Literacy Research, 38(4), 357–387. doi:10.1207/s15548430jlr3804_1
- Laganaro, M., Tzieropoulos, H., Fraunfelder, U. H., & Zesiger, P. (2015). Functional and time-course changes in single word production from childhood to adulthood. NeuroImage, 111, 204–214. doi:10.1016/j.neuroimage.2015.02.027
- Laganaro, M., Valente, A., & Perret, C. (2012). Time course of word production in fast and slow speakers: A high density ERP topographic study. NeuroImage, 59(4), 3388–3881. doi:10.1016/j.neuroimage.2011.10.082
- Lebel, C., & Beaulieu, C. (2011). Longitudinal development of human brain wiring continues from childhood into adulthood. Journal of Neuroscience, 31(30), 10937–10947. doi:10.1523/JNEUROSCI.5302-10.2011
- Lehmann, D., & Skrandies, W. (1984). Spatial analysis of evoked potentials in man: A review. Progress in Neurobiology, 23(3), 227–250. doi:10.1016/0301-0082(84)90003-0
- Lehmann, D., Strik, W. K., Henggeler, B., Koenig, T., & Koukkou, M. (1998). Brain electric microstates and momentary conscious mind states as building blocks of spontaneous thinking: I. Visual imagery and abstract thoughts. International Journey Psychophysiology, 29(1), 1–11. doi:10.1016/S0167-8760(97)00098-6
- Lenroot, R. K., & Giedd, J. N. (2006). Brain development in children and adolescents: Insights from anatomical magnetic resonance imaging. Neuroscience & Biobehavioral Reviews, 30(6), 718–729. doi:10.1016/j.neubiorev.2006.06.001
- Luna, B., Garver, K. E., Urban, T. A., Lazar, N. A., & Sweeney, J. A. (2004). Maturation of cognitive processes from late childhood to adulthood. Child Development, 75(5), 1357–1372. doi:10.1111/j.1467-8624.2004.00745.x
- Maess, B., Friederici, A. D., Damian, M. F., Meyer, A. S., & Levelt, W. J. M. (2002). Semantic category interference in overt picture naming. Journal of Cognitive Neuroscience, 14(3), 455–462. doi:10.1162/089892902317361967
- Marconi, D., Manenti, R., Catricalà, E., Della Rosa, P. A., Siri, S., & Cappa, S. F. (2013). The neural substrates of inferential and referential semantic processing. Cortex, 49(8), 2055–2066. doi:10.1016/j.cortex.2012.08.001
- Maris, E., & Oostenveld, R. (2007). Nonparametric statistical testing of EEG- and MEG-data. Journal of Neuroscience Methods, 164(1), 177–190. doi:10.1016/j.jneumeth.2007.03.024
- Miller, G. A. (1996). The science of words. New York: Scientific American Library.
- Murray, M. M., Brunet, D., & Michel, C. (2008). Topographic ERP analyses: A step-by-step tutorial review. Brain Topography, 20(4), 249–269. doi:10.1007/s10548-008-0054-5
- New, B., Pallier, C., Brysbaert, M., & Ferrand, L. (2004). Lexique 2: A new French lexical database. Behavior Research Methods, Instruments, & Computers, 36(3), 516–524. doi:10.3758/BF03195598
- Nippold, M. A. (2006). Language development in school-age children, adolescents, and adults. In K. Brown (Ed.), Encyclopedia of language & linguistics (2nd ed.). Oxford: Elsevier, 368–373.
- Nippold, M. A., Hegel, S. L., Uhden, L. D., & Bustamante, S. (1998). Development of proverb comprehension in adolescents: implications for instruction. Journal of Children’s Communication Development, 19(2), 49–55. doi:10.1177/152574019801900206
- Ostby, Y., Tamnes, C. K., Fjell, A. M., Westlye, L. T., Due-Tønnessen, P., & Walhovd, K. B. (2009). Heterogeneity in subcortical brain development: A structural magnetic resonance imaging study of brain maturation from 8 to 30 years. Journal of Neuroscience, 38(38), 11772–11782. doi:10.1523/JNEUROSCI.1242-09.2009
- Pantazatos, S. P., Yanagihara, T. K., Zhang, X., Meitzler, T., & Hirsch, J. (2012). Frontal-occipital connectivity during visual search. Brain Connectivity, 2(3), 164–175. doi:10.1089/brain.2012.0072
- Paus, T. (2005). Mapping brain maturation and cognitive development during adolescence. Trends in Cognitive Sciences, 9(2), 60–68. doi:10.1016/j.tics.2004.12.008
- Paus, T., Keshavan, M., & Giedd, J. N. (2008). Why do many psychiatric disorders emerge during adolescence? Nat Rev Neurosci, 9(12), 947–957.
- Paus, T., Zijdenbos, A., Worsley, K., Collins, D. L., Blumenthal, J., Giedd, J. N., Evans, A. C. (1999). Structural maturation of neural pathways in children and adolescents: In vivo study. Science, 283(5409), 1908–1911. doi:10.1126/science.283.5409.1908
- Perrin, F., Pernier, J., Bertrand, O., Giard, M. H., & Echallier, J. F. (1987). Mapping of scalp potentials by surface spline interpolation. Electroencephalography and Clinical Neurophysiology, 66(1), 75–81. doi:10.1016/0013-4694(87)90141-6
- Pfefferbaum, A., Mathalon, D. H., Sullivan, E. V., Rawles, J. M., Zipursky, R. B., & Lim, K. O. (1994). A quantitative magnetic resonance imaging study of changes in brain morphology from infancy to late adulthood. Archives of Neurology, 51(9), 874–887. doi:10.1001/archneur.1994.00540210046012
- Picton, T. W., & Taylor, M. J. (2007). Electrophysiological evaluation of human brain development. Developmental. Neuropsychology, 31, 249–278.
- Ponton, C. W., Eggermont, J. J., Kwong, B., & Don, M. (2000). Maturation of human central auditory system activity: Evidence from multi-channel evoked potentials. Clinical Neurophysiology, 111(2), 220–236. doi:10.1016/S1388-2457(99)00236-9
- Protopapas, A. (2007). CheckVocal: A program to facilitate checking the accuracy and response time of vocal responses from DMDX. Behavior Research Methods, 39(4), 859–862. doi:10.3758/BF03192979
- R Development Core Team. (2005). A language and environment for statistical computing. Vienna, Austria: R Foundation for Statistical Computing.
- Reiss, A. L., Abrams, M. T., Singer, H. S., Ross, J. L., & Denckla, M. B. (1996). Brain development, gender and IQ in children. A volumetric imaging study. Brain, 119(5), 1763–1774. doi:10.1093/brain/119.5.1763
- Riley, J. D., Chen, E. E., Winsell, J., Poggi Davis, E., Glynn, L. M., Baram, T. Z., Solodkin, A. (2018). Network specialization during adolescence: Hippocampal effective connectivity in boys and girls. NeuroImage, 175, 402–412. doi:10.1016/j.neuroimage.2018.04.013
- Shao, Z., Roelofs, A., & Meyer, A. S. (2012). Sources of individual differences in the speed of naming objects and actions: The contribution of executive control. Quarterly Journal of Experimental Psychology, 65(10), 1927–1944. doi:10.1080/17470218.2012.670252
- Shaw, P., Kabani, N. J., Lerch, J. P., Eckstrand, K., Lenroot, R., Gogtay, N., Wise, S. P. (2008). Neurodevelopmental Trajectories of the Human Cerebral Cortex. Journal of Neuroscience, 28(14), 3586–3594. doi:10.1523/JNEUROSCI.5309-07.2008
- Silveri, M. C., & Colosimo, C. (1995). Hypothesis on the nature of comprehension deficit in a patient with transcortical mixed aphasia with preserved naming. Brain and Language, 49(1), 1–26. doi:10.1006/brln.1995.1019
- Sowell, E. R., Thompson, P. M., Holmes, C. J., Jernigan, T. L., & Toga, A. W. (1999). In vivo evidence for post-adolescent brain maturation in frontal and striatal regions. Nature Neuroscience, 2(10), 859–861. doi:10.1038/13154
- Strijkers, K., Costa, A., & Thierry, G. (2010). Tracking lexical access in speech production: Electrophysiological correlates of word frequency and cognate effects. Cerebral Cortex, 20(4), 912–928. doi:10.1093/cercor/bhp153
- Tamnes, C. K., Ostby, Y., Fjell, A. M., Westlye, L. T., Due-Tønnessen, P., & Walhovd, K. B. (2010). Brain maturation in adolescence and young adulthood: Regional age-related changes in cortical thickness and white matter volume and microstructure. Cereb Cortex, 20(3), 534–548. doi:10.1093/cercor/bhp118
- Taylor, M. J., Edmonds, G. E., McCarthy, G., & Allison, T. (2001). Eyes first! Eye processing develops before face processing in children. NeuroReport, 12(8), 1671–1676. doi:10.1097/00001756-200106130-00031