Abstract
Two dimensional image analysis was carried out on basmati rice to determine the hot water hydration kinetics. A miniature water bath (105 × 55 × 15 mm) was fabricated to process the rice grains under the CCD camera and on-line images were obtained at regular intervals of the hot water hydration process at four temperatures from 60 to 75°C. Two-dimensional projected area of rice grains was converted into swelling ratios for suitability of comparison of the swelling at different temperatures. The reaction rate constant and the activation energy for the hot water hydration were obtained from the swelling data. The activation energy was 38.213 kJ/mole and was comparable with other processes reported in the literature. The hydration data was further analysed to obtain a polynomial equation to correlate swelling ratios in terms of heating time and temperature. This study helps in obtaining the swelling parameter of rice during cooking to be used in the design of continuous cookers.
INTRODUCTION
Rice is predominantly a starchy cereal. About 90% of dry mass of milled rice is starch. Cooking and processing behavior of rice is largely dependent on the behavior of starch. When rice is heated in excess water the starch present in rice absorbs moisture and swells. The starch granules undergo an order-disorder transition known as gelatinization. This phenomenon is accompanied by several changes like loss of bifringence and crystallanity, granule swelling, leaching of soluble starch components, increase in viscosity of the suspension Citation1-2. The above factors in turn are influenced by parameters during gelatinization (cooking) such as moisture content, heating rate and heating temperature. Of the several changes that occurs, the swelling of the starch is very important from the engineering point of view in developing rice cooking equipment and its related mathematical modeling. Data on the instantaneous volume of the rice indicating the rate of swelling during the hot water hydration is required to provide enough expansion space in the closed cooking chamber to allow complete swelling of rice without mashing. In the development of mathematical models for adsorption (soaking, cooking) and desorption (drying) process, the instantaneous dimensions of the product at various times is an important parameter Citation[3]. The accuracy with which these data are obtained determines the accuracy of the prediction by these mathematical models. Both analytical solution of Fick's law Citation4-9 and numerical solutions Citation10-13 have been used to model moisture movement in rice. Most of the investigations concern the moisture movement of water during drying. In most cases the material considered is short grain rice, which has been modeled as a sphere. Rice grains have also been considered to be of a cylindrical geometry Citation[7], Citation[14]. These facts indicate that instantaneous measurement of the shape and size of the rice during processing is very important.
The course of change of geometry due to gelatinization (cooking) can be followed by the kinetic study using different methods. Many studies have been reported on the gelatinization kinetics of starch-water systems in excess water content (>70%) Citation[3], Citation[9], Citation15-18. The kinetic study also reveals the degree of gelatinization as well. Hence, the kinetic study is very important in determining the degree of gelatinization and the degree of swelling. Though degree of gelatinization can be determined qualitatively and/or quantitatively by physical, chemical and biochemical methods Citation[19] there is no method to evaluate the degree of swelling on-line, during processing. In one such attempt a polarised light microscope and image analysis system for the continuous measurement of swelling of rice starch during heating has been used Citation[20]. But, they used starch granules isolated from pulverized rice. This study Citation[20], though reveals the swelling behavior of starch, will not provide the details required for the design of continuous cooking equipment or the data required for modeling purposes. For the purpose of engineering design of starch cooking systems or cereal grain, cooking experiments must be performed to evaluate the starch gelatinization process, under conditions simulating the situations approximating those anticipated in the actual scaled-up process Citation[19].
The application of image processing techniques in food processing industries has been reported Citation[21]. The application of software based image analysis system has also been described Citation[22]. A number of studies have been carried out on various applications of image processing. Image processing algorithms for detecting stress cracks and other physical damage in corn kernels and soybeans have been developed Citation23-24. Image processing has been applied to distinguish different wheat varieties and broken corn kernels using algorithms that compared kernel dimensions and shape characteristics Citation25-31. Imager analysis and pattern recognition studies Citation32-33 were able to distinguish among six grain varieties. Size and shape features such as kernel length, width, projected area, aspect ratio have been used to classify several cereal grains Citation[34]. This technique of image analysis has been applied Citation[35] to identify the grain samples according to wheat variety and for the shape inspection of potatoes Citation[36].
There are also some reports on the application of image analysis for the determination of shape of rice. Image processing has been used to detect cracks in dehusked rice grains Citation[37], for determining the physical dimensions of milled rice Citation[38] and for the shape of the polished rice for sake brewing Citation39-40. Three dimensional image analysis has been applied for soybean Citation[41].
However, no study has been conducted on the kinetics of on-line gelatinization using image analysis. Hence, the objective of the present study was to study the swelling characteristics of whole rice grains under various temperatures using digital image analysis system, on the real time basis and to study the cooking kinetics of whole rice grains.
MATERIALS
A scented variety of rice (Oryza sativa) known as basmati, was used for the study as it is a superfine variety. Commercially available milled and graded basmati rice, sealed in HDPE bottles of 2 kg unit was procured from the market and stored at 10°C until the day of the experiment.
A miniature water bath (105 × 55 × 15 mm) to process the rice grains was fabricated in mild steel, with a closed loop temperature controller to facilitate controlled heating at various temperatures. Water bath was insulated with heat resistant paint to reduce the external heat loss and maintain the set temperature with an accuracy of ±1°C at an operating temperature range of 50 to 80°C. Temperatures below this will not have any effect on cooking of the rice grains and the temperatures above this will evaporate the water used for cooking affecting the rice water ratio and the CCD camera. The water evaporated will condense on the camera lens and blur the images. Water bath was operated at various temperatures with controlled heating, before obtaining images, to ensure its performance during cooking.
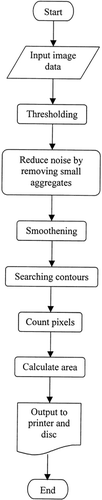
The image analysis system is shown in Figure . The system consisted of a customized PC image analysis system. A three-chip CCD (coupled charge device) camera (model DXC – 3000A, Sony) was used to acquire the images. The camera was mounted on a stand, which provided easy vertical movement and a stable support for the camera. The camera was connected to a camera control unit (model CCU – M3, Sony). Digitization and preprocessing of CCD camera output used an image frame grabber (with a resolution of 512 × 512 pixels) with a 256 K bytes frame buffer. Software for the size measurement system was developed using C (Microsoft Corporation, USA) and a brief flowchart is given in Figure . This measuring system was calibrated using a standard rectangle of known dimensions. The details of image processing and analysis have been reported elsewhere Citation[42].
Figure 1. Configuration of equipment used in image analysis.
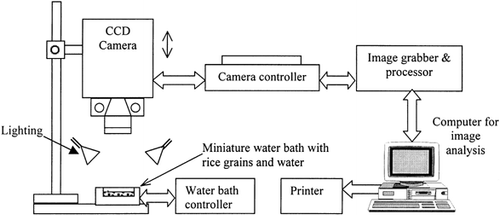
Figure 2. Flowchart of the algorithm for area measurement.
METHODS
Rice grains (10 numbers) were selected randomly from the bulk. The water bath was placed directly below the CCD camera (Figure ). Water was not used for raw and soaked imaging. For soaked rice, the grains were soaked in water for 30 minutes. For hot water hydration experiments in the range of 60 to 75°C, the selected rice grains were placed in the water bath after attaining the set temperature as indicated by the LED indicator. In all the cases the rice grains were separated physically to avoid any overlapping images. The images from the CCD camera were recorded at regular intervals of time during heating. The images were then analysed to determine the size of cooked rice at various stages. The projected area of each rice grain was measured by counting the number of pixels occupied by each grain using the software developed. The dimensions of soaked rice and raw rice were also determined using a micrometer.
Kinetic Data Analysis
The rate of swelling was described in terms of time and temperature effects using the reaction rate and the dependence of reaction rate on the temperature. Parameters, most frequently used by the physical chemists are the reaction rate constant (k) and the Arrhenius activation energy (Ea ).
The temperature dependence of a reaction is usually described by the Arrhenius equation:
Taking logarithm on both the sides we have
Substituting for k from Eq. Equation5 in Equation4 we have
RESULTS AND DISCUSSION
Figure indicates the comparison of the areas of 3 replicates of rice grains (raw and soaked) determined by physical measurements using a micrometer and by image analysis. The area by physical measurement was obtained by measuring the minor and major axes of an ellipse. Table indicates the statistical parameters and the values indicate the accuracy with which the area can be determined using the image analysis. Figure indicates the effect of heating time on the swelling ratio as determined by the ratio of area at different heating times to the initial area before heating. The figure indicates the effect of heating temperature on the swelling ratio. At lower temperature, the rate of swelling is slower and the maximum value reached is lower as compared to those values at higher temperature. At all temperatures, the area increased rapidly in the initial stages and gradually attained a constant value in the later part of heating. This constant value increased with increase in temperature and the swelling at 75°C continued even after 12 minutes of heating. This is because; each starch granule has its own degree of crystallinity with its own unique gelatinization characteristics. The starch granule consists of amorphous and crystalline regions. Due to its lower order of crystallinity, the amorphous region hydrates initially and is more labile to heat treatment with water present than the crystalline region. Since the amorphous region is an integral part of the starch granule, the destabilization and swelling of the amorphous region during heating at lower temperature facilitates further destabilization of the crystalline region by tearing molecules from crystallites as the heating temperature is increased. At low temperatures of heating near the onset of gelatinization, gelatnization occurs randomly in each granule, primarily in the amorphous region. Upon continued heating at the same temperature, all the amorphous regions are destabilized and crystalline regions begin to “gelatinize”. The extent of this gelatinization is dependent on temperature and as the heating temperature increases, the extent of crystallites that are gelatinized also increases. When the temperature is sufficiently high both the regions are completely gelatinized. Thus, the initial phase of heating where the amorphous regions get gelatinized may be interpreted as a “promoter” for further gelatinization.
Figure 3. Parity plot for image and physical measurements of the area of 3 replicates of rice.
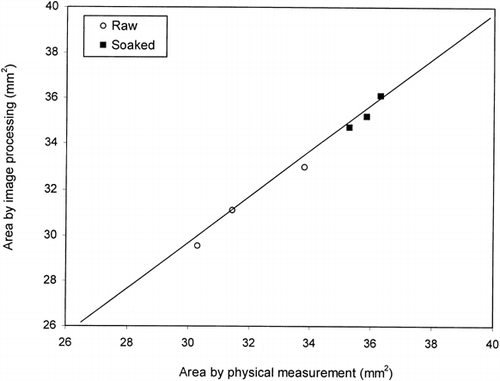
Figure 4. Influence of heating on the swelling ratio.
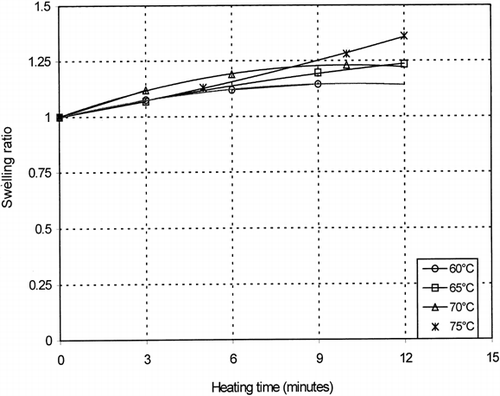
Table 1. Statistical Parameters
The increase in the rice grain size as indicated by the projected area at elevated temperatures is a reflection of the swelling and appears to be a quantitative index of kinetic studies on gelatinization of rice starch. The present study indicated 1st order kinetics within the cooking time studied. This is in accordance with the observation of earlier researchers Citation[16]. These data were used to obtain the reaction rate constants at various temperatures (Table ) and further the activation energy of cooking process Citation[43]. The reaction rate constant increased with increase in temperature indicating Arrhenius type of relationship. The activation energy calculated was 38.213 kJ/mole with the frequency factor ko equal to 15705 min−1. This value was compared with other processes as reported in the literature and is indicated in Table . Table indicates the comparison of activation energies of starch gelatinization with different methods of determination as reported in the literature Citation[19]. The isothermal values refer to the kinetic studies using DSC analyses at one single temperature for a longer duration and non-isothermal are carried out with a gradient of temperature (say 2°C/min) with in a temperature domain. The differences among these values may be due to the difference in the nature of raw material studied and the method of choosing the zero heating time reference Citation[19].
Table 2. Reaction Rate Constants at Various Temperatures
Table 3. Comparison of Ea Values with Literature Values
Table 4. Comparison of Ea Values During Starch Gelatinization Determined from Different Methods
The kinetic (equation Equation7) was used to predict the swelling ratios at other processing conditions. The predicted and actual swelling ratios are indicated in Table and the closeness of prediction of swelling ratio is evident.
Table 5. Swelling Ratios at Various Cooking Time and Temperatures
CONCLUSIONS
The study of the kinetics of the rice grain swelling during heating provides the data on the rate of gelatinization at various instances. The present study helps in understanding the kinetics of rice grain swelling which could be further correlated to the degree of gealtinization. The data on the effect of temperature on the swelling area will provide an insight into the importance of cooking temperature in rice cooking and also help in the development of on-line control system for the continuous cooker. This further helps in the design of cooking equipment by providing progressive increase in volume towards the discharge end to accommodate the swelling as cooking proceeds. From this study, the instantaneous changes in the dimensions of the rice grains can be derived that can be used in diffusion based models. The method can be further used to determine the perimeter, maximum length and width, compactness and elongation. The high statistical parameters between the physical measurement and the image analysis measurement of the rice dimension indicate the accuracy of this method. Hence, this method can be adopted to correlate the physical dimensions to the cooking properties at various temperatures.
ACKNOWLEDGMENTS
The author is thankful to Prof. M. Sukumar, Department of Instrumentation Technology, Sri Jayachamarajendra College of Engineering for providing the Image analysis facility. The author is also thankful to Ms Vidya, Ms Pramila Rani, Mr Rajesh, and Mr Girish for their assistance in the image analysis and for development of the software for calculating the area.
REFERENCES
- Doublier , J. L. , Llamas , G. and Le Meur , M. 1987 . A Rheological Investigation of Cereal Starch Pastes and Gels: Effect of Pasting Procedures . Carbohydrate Polymers , 7 : 251 – 275 .
- Doublier , J. L. , Paton , D. and Llamas , G. 1987 . A Rheological Investigation of Oat Starch Pastes . Cereal Chemistry , 64 : 21 – 26 .
- Zanoni , B. , Schivaldi , A. and Simonetta , R. 1995 . A Naïve Model of Starch Gelatinization Kinetics . Journal of Food Engineering , 24 : 25 – 33 .
- Aguerre , R. , Suarez , C. and Viollaz , P. E. 1982 . Drying Kinetics of Rough Rice Grain . Journal of Food Technology , 17 : 679 – 680 .
- Aguerre , R. J. , Gabitto , J. F. and Chirife , J. 1985 . Utilization of Fick's Second Law for the Evaluation of Diffusion Coefficients in Food Processes Controlled by Internal Diffusion . Journal of Food Technology , 20 : 623 – 629 .
- Chandra , P. and Singh , P. 1984 . Thin Layer Drying of Parboiled Rice at Elevated Temperatures . Journal of Food Science , 49 : 905 – 909 .
- Engels , C. , Hendrickx , M. , De Samblanx , S. , De Gryze , I. and Tobback , P. 1986 . Modeling Water Diffuison During Long – Grain Rice Soaking . Journal of Food Engineering , 5 : 55 – 60 .
- Bandyopadhyay , S. and Roy , N. 1980 . Desorption Characteristics of Hot-Soaked Parboiled Paddy . Journal of Food Technology , 15 : 329 – 334 .
- Bakshi , A. and Singh , R. 1980 . Kinetics of Water Diffusion and Starch Gelatinization During Rice Parboiling . Journal of Food Science , 45 : 1387 – 1392 .
- Steffe , J. and Singh , R. 1980 . Diffusivity of Starchy Endosperm and Bran of Fresh and Rewetted Rice . Journal of Food Science , 45 : 356 – 361 .
- Steffe , J. and Singh , R. 1980 . Theoretical and Practical Aspects of Rough Rice Tempering . Transaction of ASAE , 23 : 767 – 774 & 782 .
- Steffe , J. and Singh , R. 1982 . Diffusion Coefficients for Predicting Rice Drying Behavior . Journal of Agricultural Engineering Research , 27 : 489 – 493 .
- Zhang , T. , Bakshi , A. , Gustafson , R. and Lund , D. 1984 . Finite Element Analysis of Non-Linear Water Diffusion During Rice Soaking . Journal of Food Science , 49 : 246 – 250 .
- Engels , C. , Hendrickx , M. , De Samblanx , S. , De Gryze , I. and Tobback , P. 1986 . Modelling Water Vapor Soaking of Long-Grain White Rice . Lebensmittel-Wissenshaft-und-Technologie , 19 : 382 – 386 .
- Suzuki , K. , Kubota , K. , Omichi , M. and Hosaka , H. 1976 . Kinetic Studies on Cooking Rice . Journal of Food Science , 41 : 1180 – 1183 .
- Lund , D. B. and Wirakartakusumah , M. 1984 . “ A Model for Starch Gelatinization Phenomena ” . In Engineering and Food, Vol.1. Engineering Science in the Food Industry Edited by: Mckenna , B. M. 425 – 431 . London : Elsevier Applied Science .
- Slade , L. and Levine , H. 1991 . Beyond Water Activity: Recent Advances Based on an Alternative Approach to the Assessment of Food Quality and Safety . Critical Reviews in Food Science and Nutrition , 30 : 115 – 359 .
- Norman , F. L. and Marshall , W. E. 1989 . Differential Scanning Calorimetry of Whole Grain Milled Rice and Milled Rice Flour . Cereal Chemistry , 66 : 317 – 320 .
- Lund , D. B. 1984 . Influence of Time, Temperature, Moisture, Ingredients and Processing Conditions on Starch Gelatinization . Critical Reviews in Food Science and Nutrition , 20 : 249 – 273 .
- Yeh , A. I. and Li , J. Y. 1996 . A Continuous Measurement of Swelling of Rice Starch During Heating . Journal of Cereal Chemistry , 23 : 277 – 283 .
- Kar , A. and Dash , S. 1999 . Application of Image Processing Technique in Food Processing Industries . Indian Food Industry , 18 ( 4 ) : 223 – 228 .
- Russ , J. C. , Stewart , W. D. and Russ , J. C. 1988 . The Measurement of Macroscopic Images . Food Technology , 42 ( 2 ) : 94 – 102 .
- Gunasekaran , S. , Cooper , T. M. , Berlage , A. G. and Krishnan , P. 1987 . Image Processing for Stress Cracks in Corn Kernels . Transactions of ASAE , 30 ( 1 ) : 266 – 271 .
- Gunasekaran , S. , Cooper , T. M. and Berlage , A. G. 1988 . Evaluation Quality Factors of Corn and Soybean Using a Computer Vision System . Transaction of ASAE , 31 ( 4 ) : 1264 – 1271 .
- Zayas , I. , Pomeranz , Y. and Lai. , F. S. 1985 . Discrimination Between Arthur and Arkan Wheat by Image Analysis . Cereal Chemistry , 62 ( 2 ) : 478 – 480 .
- Zayas , I. , Pomeranz , Y. and Lai. , F. S. 1986 . Discrimination Between Wheat Classes and Varieties by Analysis . Cereal Chemistry , 63 ( 1 ) : 52 – 56 .
- Zayas , I. , Pomeranz , Y. and Lai. , F. S. 1989 . Discrimination of Wheat and Nonwheat Components in Grain Samples by Image Analysis . Cereal Chemistry , 66 ( 3 ) : 223 – 237 .
- Zayas , I. , Converse , H. and Steele , J. 1990 . Discrimination of Whole from Broken Corn Kernels with Image Analysis . Transactions of ASAE , 33 ( 5 ) : 1642 – 1646 .
- Neuman , M. R. , Sapirstein , H. D. , Shwedyk , E. and Bushuk , W. 1989 . Wheat Grain Colour Analysis by Digital Image Processing, I-Methodology . Journal of Cereal Science , 10 ( 3 ) : 175 – 182 .
- Neuman , M. R. , Sapirstein , H. D. , Shwedyk , E. and Bushuk , W. 1989 . Wheat Grain Colour Analysis by Digital Image Processing, II-Wheat Class Discrimination . Journal of Cereal Science , 10 ( 3 ) : 183 – 188 .
- Devaux , M. F. , Bertrand , D. , Robert , P. and Rousset , M. 1991 . Varietal Characterization of Soft Wheats by Image Analysis on Whole Grains: Preliminary Results . Industries-des-Cereals , 69 : 19 – 23 .
- Lai , F. S. , Zayas , I. and Pomeranz , Y. 1986 . Application of Pattern Recognition Techniques in the Analysis of Cereal Grains . Cereal Chemistry , 63 ( 2 ) : 168 – 172 .
- Zamfira , M. , Zayas , I. and Black , C. A. 1991 . Neural Network System for Grain Classification, Proceeding of AMSE Conference on Neural Network Methodologies and Application . 2 : 69 – 76 .
- Sapirstein , H. D. , Neuman , E. H.M. , Wright , Shedyk , E. and Bushuk , W. 1987 . An Instrumental System for Cereal Grain Classification Using Digital Image Analysis . Journal of Cereal Science , 6 : 3 – 14 .
- Myers , D. G. and Edsall , K. J. 1989 . The Application of Image Processing Techniques to the Identification of Australian Wheat Varieties . Plant varieties and seeds , 2 ( 2 ) : 109 – 116 .
- Tao , Y. C. , Morrow , T. and Heinemann , P. H. Automated Machine Vision Inspection of Potatoes , ASAE paper No., 90–3531 . St. Joseph, Michigan, ASAE 1990
- Matsuhisa , T. and Hosokawa , A. 1981 . Possibilities of Checking Cracks of Brown Rice Using Illumination by Oblique Ray and Image Data Processing System . Journal of the Society of Agriculture machinery of Japan , 42 ( 4 ) : 515 – 520 .
- Goodman , D. E. and Rao , R. M. 1984 . A New Rapid, Interactive Image Analysis Method for Determining Physical Dimensions of Milled Rice Kernels . Journal of Food Science , 49 : 648 – 649 .
- Saito , T. 1993 . Shape of Polished Rice for Sake Brewing and its Evaluation . Journal of Brewing Society of Japan , 88 : 402 – 406 .
- Sakai , N. , Yonekawa , S. and Matsuzaki , A. 1996 . Two-Dimensional Image Analysis of the Shape of Rice and its Application to Separating Varieties . Journal of Food Engineering , 17 : 397 – 407 .
- Sakai , N. and Yonekawa , S. 1992 . Three-Dimensional Image Analysis of the Shape of Soybean Seed . Journal of Food Engineering , 15 : 221 – 234 .
- Sun , D. W. 2000 . Inspecting Pizza Topping Percentage and Distribution by a Computer Vision Method . Journal of Food Engineering , 44 : 245 – 249 .
- Singh , R. P. 1996 . “ Chemical Kinetics in Food Processing ” . In Computer Applications in Food Technology Edited by: Singh , R. P. 93 – 107 . New York : Academic Press .
- Selman , J. D. , Rice , P. and Abdul-Rezzak , R. K. 1983 . A Study of the Apparent Diffusion Coefficients for Solute Losses from Carrot Tissue During Blanching in Water . Journal of Food Technology , 18 : 427 – 440 .
- Suarez , C. , Viollaz , P. and Chirife , J. 1980 . Diffusional Analysis of Air Drying of Grain Sorghum . Journal of Food Technology , 15 : 232 – 331 .
- Rao , D. G. , Sridhar , B. S. and Nanjundaiah , G. 1992 . Drying of Toria (Brassica Campistris var. Toria) Seeds: Part 1-Diffusivity Characteristics . Journal of Food Engineering , 17 : 49 – 58 .
- Farinati , L. E. 1982 . Cinetica de Secado de Semilla de Algodon y Estudio de lla Estabilidad de la Semilla Dukrante su Almacenaje , MSc Thesis Argentina : Universidad Nacional de Mar del Plata .
- Kubota , K. , Hosokawa , Y. , Suzuki , K. and Hosaka , H. 1979 . Studies on the Gelatinization Rate of Rice and Potato Starches . Journal of Food Science , 44 : 1394 – 1398 .
- Wirakartakusumah , M. A. 1981 . Kinetics of Starch Gelatinization and Water Absorption in Rice , Ph.D Thesis Dep. Food Science Madison : University of Wisconsin .