Abstract
Chicken slabs (10.0×1.0×0.5 cm) were deep-fat fried with sunflower oil at several temperatures 130, 140, and 150°C. Moisture content and oil absorption was determined during the whole experiment, and the following properties were evaluated: sample dimensions, temperature of the geometric center of the slab, mass transfer diffusivity, thermal diffusion coefficient and heat transfer coefficient. Fourier, Newton and Fick equations were applied to obtain the correspondent physical properties; whereas, empirical relationships were generated to describe the evolution of central temperature, moisture and oil content, as well as the product dimensions: length, width and thickness, as a function of frying time at three process temperatures.
INTRODUCTION
Deep-fat frying is a traditional way of Mexican and world wide food preparation, it produces desirable attributes for consumers: both physical and sensory attributes. In this process, in addition to proteins and carbohydrates characteristic transformations, fat reacts with both food constituents, to generate desirable sensory propertiesCitation[1]. For decades, Mexican consumers have enjoyed the flavors and aromas of fried foods as: French-fried potatoes, donuts, snacks, meat products as fish sticks, chicken strips and breaded pieces, and other Mexican special foods: “carnitas”, “fajitas”, “molotes”, “pelonas”, “tacos”, “tostadas”, among others. Most of these foods are prepared at a “practical” level and particularly some of them are fried in fast-food catering establishments and in home. There are very few formal studies about the frying process, therefore there is a need for more information regarding this cooking process. According to Dincer and YildizCitation[2], in order to design a proper frying process and equipment it is necessary to estimate physical properties of foods, especially thermal and moisture diffusivities.
Some advances have been reached in relation to deep-fat frying covering different aspects, such as chemical deterioration of frying oil, influence of physical properties of the vegetable oil on the food products, effect of physical and chemical characteristics of foodstuff on the final product, mass and heat transfer during frying, and mathematical modeling of transfer phenomenaCitation[3]. Therefore, it is important to know how physical properties are affected during the frying process, as well as the influence of process variables.
In a very interesting study, Gamble et al.Citation[4] established practical relationships for moisture loss and oil uptake during frying of potato slices. Both transfer phenomena were linear functions of the square root of frying time, and also the loss of water and gain of oil were interrelated at three examined temperatures by means of linear equations.
Ateba and MittalCitation[5] proposed a mathematical model for frying of beef meatballs considered as a fatty product. They subdivided the spherical geometry into concentric shells, and solved three differential equations to represent moisture, fat and heat transfer at the first stage or fat absorption period, and at the fat desorption or second period, only changing the conditions and adding some assumptions. The model was validated and good agreement was obtained between the observed and simulated mass loss data.
In other research work for frying of potatoes, Miller et al.Citation[6] followed the physical properties of different vegetable oils through the frying process and oil repeatedly used, finding kinematic viscosities in the range of 2.60–3.45×10⁻³ m2/s for canola, 2.50–3.95×10⁻³ for palm, and 2.61–3.80×10⁻³ for soybean oil. Oil viscosity obviously influenced the convection mechanism of heat transfer, the heat transfer coefficients were evaluated between 249.5 to 276.2 W/m°C for the tested experimental conditions.
In order to get a desired breaded chicken product by deep-fat frying, Rao and DelaneyCitation[7] developed a mathematical model for breaded chicken parts that predicts the internal temperature profile given inputs such as external temperature and geometry. Regularly shaped parts were modeled better than irregularly ones. The thermal diffusivity values played an important role in temperature predictions, as well as heat transfer coefficient.
Several proposed mathematical models utilizing different approaches,Citation[2], Citation[5], Citation7-12, have the limitation that they are not suitable for any food product in which heat and mass transfer occur differently with some particularities.
Ufheil and EscherCitation[13] followed oil uptake during frying of potato slices incorporating a dye to monitor the dynamics of oil absorption. They concluded the oil gain is mainly a surface phenomenon. In other study, Vasanti et al.Citation[14] made a complete study on physical changes of tapioca chips produced by deep-fat frying and affected by initial moisture. They pointed out that moisture loss exhibited a typical drying curve, oil absorption was also correlated to water loss irrespective of the frying conditions employed; additionally the linear expansion of the product was significantly affected by the frying conditions.
Chicken strips, “carnitas” and “fajitas” are quite popular and widely consumed in Mexico, without breading; and, there is little information about frying process of this product. It was decided to carry out a study of deep-fat frying of one of this products. Hence, our objective was to evaluate the effect of oil temperature on the physical properties of chicken strips as a function of frying time.
MATERIALS AND METHODS
Sample Preparation
Fresh chicken breasts were obtained from a local poultry vendor and immediately cut in slabs. Chicken strips of 10 cm long, 1 cm wide (±0.15 cm), and 0.5 cm thick (±0.06 cm) were employed during deep-fat frying experiments.
Frying Equipment
Immersion frying was carried out on a batch operation basis. A commercial (Deluxe model, Taurus Co., State of Mexico, MEXICO) batch fryer with a stainless steel tank of 5 L capacity was used, in which the oil is heated with electrical resistors at the bottom of the tank. A volume of 3.5 L was occupied; then a 1:100–400 mass ratio of product to oil was normally used (depending of the number of strip samples), and the level was kept with fresh oil.
Temperature Profiles
A thin thermocouple (Type T, 30 gauge) was inserted in the center of the chicken samples, assuring the position by measure of the sample dimensions. The temperatures at the geometric center of the sample and bulk oil were measured, with sampling time (t) frequency of 30 s by means of the thermocouples attached to a Digi-Sense (Cole-Parmer, Vernon Hills, Ill., EUA) data logger.
Frying Experiments
Sunflower oil was used as the cooking medium utilizing the commercial fryer for frying three to ten samples. The experiment was initiated once the oil temperature was reached, the oil bath temperature was thermostatically controlled. The sample temperature (T) was recorded through the whole frying process. The samples were removed from the oil, drained for 1 min on a metallic mesh, turned out onto absorbent paper, weighed and stored in plastic bags.
Firstly, an exploratory set of experiments at 150°C was conducted to decide the frying time for the chicken strips on a sensory evaluation basis, in which 50 consumers expressed their preferences on a hedonic scale (0–10). Subsequently, three sets of experiments were conducted using sunflower oil at temperatures of 150, 140 and 130°C to analyze the effect on the physical properties and to study the heat and mass transport phenomena. Fifteen experimental runs for 150°C, twelve runs for 140 and twelve for 130°C, were carried out. The frying periods (240–360 s) were based on the results of the first set of measurements and oil temperature. The samples were placed in plastic bags and stored in a desiccator for a few minutes (15–30 min) previous to further analysis.
Measurement of Strip Dimensions
Dimensional changes were determined by sample measurements with a Vernier scale, during frying. Reported measurements were based on the average of eight replicates, at least. The percentage of shrinkage or expansion was evaluated according to the equation:
Determination of Moisture Content
Moisture content was determined by weight difference after drying of samples, following the official method 39.1.02 A.O.A.C. Citation[15]. At each sampling time, two or more replicates were utilized. Water percentages were expressed as water content (w) and average content (W).
Determination of Oil Absorption
Oil absorption was determined by using the Soxhlet method based on oil extraction by using petroleum ether as the solvent (7 h), and weighting the collected fat. The determination was conducted by duplicate. Oil absorption percentage was expressed as oil content (o) and average oil content (O) and quantified by the next equation:
Evaluation of Physical Properties
Mass transfer diffusivity and thermal diffusivity were evaluated following transient methods, in contrast to the determination of the heat transfer coefficient. The diffusion coefficient (D a ) was evaluated according to the given Newman solution to the Fick's first law for an infinite slab in the form of a concentration-time-location equation, with constant D a and negligible surface resistanceCitation[8]. In the calculation of D a , the values of the second and subsequent terms in Eq. Equation3 are commonly ignored, because they are so small as to be neglected:
The thermal diffusivity (α) was separately evaluated by a transient method, considering an infinite slab submerged in a heating medium (water), recording the temperature rise at the geometric center of the sample as a function of time. The solution of the heat conduction equation to give the temperature at any time and position within the material undergoing heating depends on the boundary conditions Citation[16]. When a slab of material of initially uniform temperature, is placed in the heating medium, then the temperature in the sample can be expressed by the next Eq. Equation4a:
Experimental Design and Data Analysis
Experimental designs were carried out to study the effects of time and three frying temperatures, respectively. A factorial design of 7×3 levels was applied for water transfer, whereas a 6×3 levels was followed for oil content absorption. Multifactor analysis of variance was performed to show the significance of the studied factors using the CA-Cricket Graph software (version 1.5.2). It was also utilized to fit the experimental data, and to get the correlation coefficients.
RESULTS AND DISCUSSION
Thermal Properties
Sample temperature history of a chicken slab is given in Fig. at the three experimental temperatures. The center temperature increased rapidly at the beginning and had a plateau at around 95–105°C from 1–4 min, depending of the oil temperature. This profile is basically due to the sample unstable heating and water evaporation phenomenon from the surface. Within the experimental conditions studied, a difference between the maximum sample temperature and the oil temperature was recorded, in which the center temperature of most of the samples never reached 112 for 130°C, 125 for 140°C, and 140 for 150°C, respectively. So, the observed temperature difference (18, 15 and 10°C) was in reverse order of the oil temperature, suggesting a faster heat transfer.
Figure 1. Typical temperature profile of chicken slabs during deep-fat frying at three temperatures.
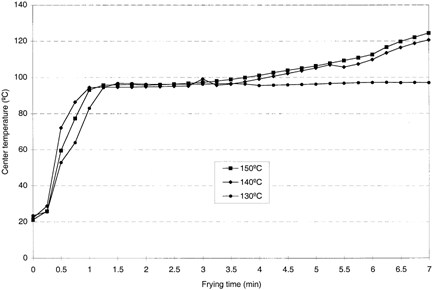
The frying time to get desirable sensory characteristics of the chicken strips was different for each oil temperature; the characteristic time decreased with increasing temperature, which is to be expected since the rate of heating is higher. At 150°C, the characteristic frying time was 4.5 min; whereas around 5 and 6 min were necessary at 140 and 130°C, respectively.
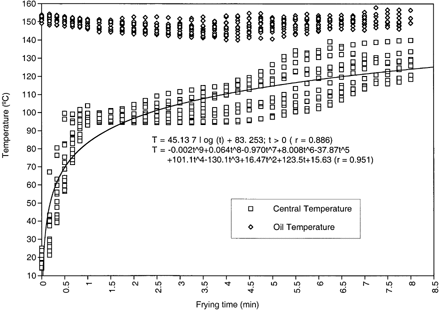
Based on the experimental center temperature some empirical models were generated for each frying temperature which fit the data very well (r>0.87); the corresponding equations are included in Table . In addition to the logarithmic relationships, a polynomial and a linear equation for the highest oil temperature are presented. At 150°, the polynomial relationship is more precise in temperature prediction but is not simple (Fig. ); furthermore, the centre temperature profile can be described by two linear trends for the first minute of frying and for the second period covering from one to eight minutes (Table ). The increase in experimental runs at three frying conditions did not contribute to a significant improvement in fitting coefficients. The ANOVA application showed that both factors, frying temperature and process time, are highly significant (α=0.01), such as it has been established in other related studies.Citation[6], Citation[14].
Predictive Empirical Equations for the Central Temperature as a Function of Time of Chicken Slabs at Three Frying Temperatures
Figure 2. Experimental temperature data for frying of chicken strips at 150°C.
Thermal diffusivity of chicken strips for each oil temperature was measured at different frying times, this property showed an increasing trend during the first three (at 150), four (at 140), and five minutes (at 130), from 7.0×10⁻⁸ to 1.5–1.7×10⁻⁷ m2/s; and a smoothly decreased for the rest of the frying period (from 1.7×10⁻⁷ to 1.3×10⁻⁷ m2/s), depending of the frying temperature; and basically, as a result of the water evaporation/oil absorption inside the sample. This decreasing trend as a function of frying time, has been also reported for fried tortilla chips Citation[18]. The determined average thermal diffusivities are given in Table , in which diffusivities at 130 and 140°C are practically the same, showing no significant difference from the statistical viewpoint (α=0.01); these average values are in agreement with those utilized by Rao and Delaney Citation[7] for deep-fat frying of breaded chicken.
Table 2. Thermal Properties Evaluated During the Frying Process of Chicken Slabs at Three Frying Temperatures
The evaluation of heat transfer coefficient was based on the assumption that heat is used mainly for sample heating and phase change of water. The coefficient changed for each experimental temperature, and the computed average values for these parameters are also included in Table . As expected, the heat transfer coefficient increased with oil temperature in agreement with Miller et al. Citation[6], who reported the corresponding coefficients for canola, corn, palm, and soybean oils from 250 to 276 W/m2 °C; also with Vijayan and Singh Citation[20], who employed surface heat coefficients of 300 and 500 W/m2 °C for simulation of the frying process for frozen foods.
Moisture Transfer
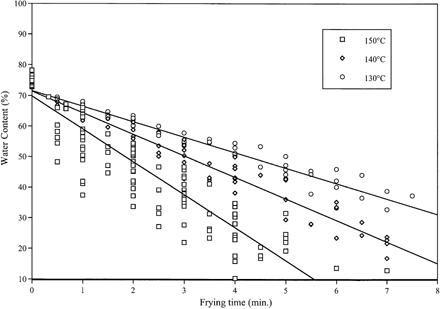
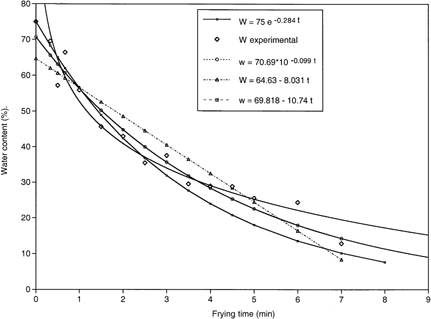
Figure shows the determined moisture content during the frying of chicken strips. The evaporation rate was high during the first 3 min of frying, becoming fairly constant as process continued, reaching a water content of: 45–50%, 35–40%, and 25–30% after 5 min of frying at 130, 140, and 150°C, respectively. Moisture transfer during the frying process appears to be similar to a drying profile, with an initial rapid fall period followed by a continuous drying stage. This double mass transfer rate has been commonly observed in deep-fat frying products, such as potato slices Citation[4], tortilla chips Citation[9], chicken nuggets Citation[21], and tapioca chips Citation[14], among others.
Figure 3. Moisture content profiles of chicken slabs during deep-fat frying at three temperatures.
By employing the average water content, the two moisture loss trends are more pronounced at the high temperature than at 130°C (Fig. ). Similarly as with the heat transfer phenomena, ANOVA results indicated that temperature and frying time have a high significant effect (α=0.01) on the moisture content. These water percentages (w) and average contents (W), as a function of process time (t), were fitted by different practical relationships for each experimental temperature; additionally the average moisture content was correlated to the square of the frying time as proposed by Gamble et al. Citation[4]. The corresponding equations are given in Table , and the comparison between experimental and predicted moisture content by some of the empirical relationships at 150°C is shown in Fig. . Average water content at low temperatures (130 and 140°C) were very well modeled by linear equations (r= 0.99), in contrast to the moisture percentage at frying temperature of 150°C being excellently fitted (r=0.999) by an exponential relationship.
Figure 4. Average moisture content of chicken strips during deep-fat frying at three temperatures
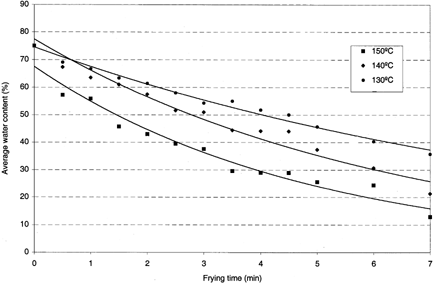
Table 3. Predictive Equations for Moisture Content as a Function of Time of Chicken Slabs at Three Frying Temperatures
Figure 5. Measured and predicted moisture content for frying of chicken slabs at 150°C.
Following the model developed by Rice and Gamble Citation[8], the apparent diffusion coefficients (D a ) were calculated (Table ); in the calculation of D a , the magnitudes of the second and next terms in Eq. Equation1 became so small as to be important, therefore were ignored. Even though, the composition and structure of fried foods are different, these results are in agreement with the diffusivity values: 0.80×10⁻⁸ at 145°C, 1.10×10⁻⁸ at 165°C, and 1.35×10⁻⁸ (m2/s) at 185°C reported by Rice and GambleCitation[8] for potato slice frying; and 9.348×10⁻⁸ (m2/s) at 190°C used by Moreira et al. Citation[9] for the deep-fat frying of tortilla chips. Also, these apparent diffusivity values are ten times below in comparison with the moisture diffusivity (1.312×10⁻⁷ at 180°C m2/s) obtained by Dincer and Yildiz Citation[2] for sausage frying. In the last comparison, the difference in diffusivity coefficients may be attributed to nature of foods, sausage is a formulated product in contrast to chicken strips; therefore moisture escapes easier from sausage than from chicken.
Table 4. Calculated Moisture Diffusion Coefficients and Activation Energy for Frying of Chicken Slabs
Assuming an Arrhenius relationship between the diffusion coefficient and temperature, the activation energy was evaluated applying the Eq. Equation6.
The calculated magnitude of 34.4 kJ/mol (Table ) is comparable with some activation energy values reported for drying processes (30–36 kJ/mol) and slightly higher than the reported energy (24.4 kJ/mol) by Rice and Gamble Citation[8] for potato frying. The difference in E a values may be attributed to the involved products, chicken has a more complex structure than potato tissue; therefore more energy is required to evaporate a mole of water from chicken strips than from potato slices.
Oil Content
The effect of frying time and temperature on oil content of chicken strips during deep-fat frying is shown in Fig. . The oil absorption increased as the frying time and temperature were higher, exhibiting a rapid increase during the first 4 min, attributed to the replacement of evaporated water Citation[22]. In the last two minutes at 140 and 150°C, an apparent fat desorption was observed. This increasing trend of oil content as a function of oil temperature is in agreement with findings by Gamble et al. Citation[4], who additionally correlated the oil content of potato chips to the square root of frying time; by Moreira et al. Citation[9] in tortilla chips, and by Pinthus et al. Citation[23], who linearly related oil uptake to porosity.
Figure 6. Oil content profile of deep-fat fried chicken strips as influenced by frying temperature and time.
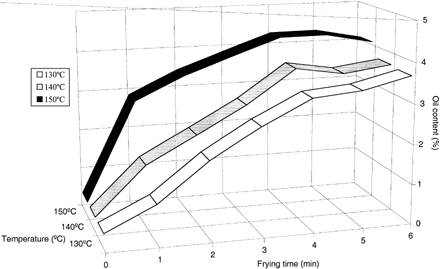
Data of oil content (o) and average oil content (O) as a function of time (t) was fitted by several models at each temperature (Table ). In order to improve the fitting coefficients, the oil content was correlated to the square of the frying time as proposed by Gamble et al. Citation[4], the generated equations are given in Table ; the fitting coefficients were improved just for two of the three frying temperatures: r = 0.97 at 130°C, r= 0.91 at 140°C, similarly to correlation values reported by Gamble et al. Citation[4]. This improvement basically is a consequence of the desorption phenomenon developed during the last frying stage due to capillary action Citation[21]. Although the average oil contents at low temperatures (130 and 140°C) were well modeled by power equations (r =0.93 and 0.85), and by a logarithmic relationship (r=0.90) at frying temperature of 150°C; the best fitting for oil contents prediction were those relationships at 130 and 140°C as a function of the square of the frying time. In this case, ANOVA indicated a high significant effect for frying time but not for oil temperature (α=0.01) on the oil content.
Table 5. Predictive Equations for the Oil Content as a Function of Time of Chicken Slabs at Three Frying Temperatures
The relationship between moisture loss and oil absorption of chicken slabs and the square root of frying time suggest a convective mass transfer controlled exchange, in which the outer water is rapidly lost generating a stream of vapor bubbles and producing a dry surface. This external dryness provides a diffusion gradient favoring the moisture transfer from internal cells and then oil may adhere to the strip and enter to free spaces formed as the water escapes.
Correlation of Oil and Moisture Contents
Because it has been shown that the amount of oil entering the chicken strips was directly proportional to the moisture lost Citation[4], these two parameters were correlated very well (r ≥ 0.85). Correlation and regression results are given in Table . Consequently, these regression equations may be utilized to calculate the oil content of a sample on the basis of residual water percentage.
Table 6. Correlation Between Oil Content and Moisture Content for Frying of Chicken Strips at Three Temperatures
Dimensional Changes
Table summarizes the trends for the measured changes of length, width and thickness of deep-fat fried chicken strips as influenced by oil temperature. The observed trends for the average percentages of shrinkage/expansion, basically are a consequence of the water evaporation and protein denaturation, generating structural changes of the chicken plates that are reflected as dimensional changes. On the other hand, the effect of frying time on these shrinkage/expansion changes are given as linear and logarithmic equations in Table , in which the relationships work well only for frying times above 0.5 min.
Table 7. Predictive Models for Percentages of Length and Width Shrinkage and Thickness Expansion of Fried Chicken Slabs at Three Temperatures
CONCLUSIONS
The present study underlines the importance of the interactive effects of the two frying parameters on the physical properties and the heat and mass transfer phenomena of chicken strips through the deep-fat frying process. The analytical and empirical approaches were satisfactorily employed to generate the corresponding mathematical relationships and physical properties given in this work.
Some of the presented data, such as thermal diffusivity, diffusion coefficient, and activation energy can be employed in analogue food products in order to predict or design deep-fat frying processes. Whereas the equations for dimensional changes can be utilized to estimate shrinking or expansion of similar products exposed to frying processes.
The obtained empirical models for chicken strips can be applied to make valid and valuable predictions about central temperature, moisture and oil contents, as well as product dimensions in the different stages of deep-fat frying. Good agreement was observed between proposed model and measured parameters at the three experimental temperatures.
According to the results obtained in this investigation, chicken strips as processed in our laboratory could have been fried in 4.5–6 min to obtain a sensorial attractive product, with a good color (8–9 in the hedonic scale), an attractive flavor (9 in the hedonic scale), and a desirable texture (8–9 in the hedonic scale). Therefore, it should be possible to produce fried food products of any kind with desired quality attributes by using mainly controlled frying process conditions and pre-frying treatments.
Acknowledgments
REFERENCES
- Weiss , T.J. 1983 . “ Frying Shortenings and Their Utilization ” . In Food Oils and their Uses 157 AVI Publishing Co. .
- Dincer , I. and Yildiz , M. 1996 . Modeling of Thermal and Moisture Diffusions in Cylindrically Shaped Sausages During Frying . J. Food Engng. , 28 : 35 – 43 .
- Vélez , J.F. and Xique , J. 1999 . Review: Frying Process of Foods . Int. J. of Technological Information (Revista Internacional Información Tecnológica, CHILE) , 10 ( 2 ) : 127 – 134 .
- Gamble , M.H. , Rice , P. and Selman , J.D. 1987 . Relationship Between Oil Uptake and Moisture Loss During Frying of Potato Slices from c.v. Record UK. Tubers . Int. J. of Food Sci. & Technol. , 22 : 233 – 241 .
- Ateba , P. and Mittal , G.S. 1994 . Modeling the Deep-fat Frying of Beef Meatballs . Int. J. of Food Sci. & Technol. , 29 : 429 – 440 .
- Miller , K.S. , Singh , R.P. and Farkas , B.E. 1994 . Viscosity and Heat Transfer Coefficients for Canola, Corn, Palm, and Soybean Oil . J. Food Process. & Preserv. , 18 : 461 – 472 .
- Rao , V.N.M. and Delaney , R.A.M. 1995 . An Engineering Perspective on Deep-fat Frying of Breaded Chicken Pieces . Food Technol. , 49 ( 4 ) : 138 – 141 .
- Rice , P. and Gamble , M.H. 1989 . Technical Note: Modeling Moisture Loss During Potato Slice Frying . Int. J. Food Sci. & Technol. , 24 : 183 – 187 .
- Moreira , R. , Palau , J. and Sun , X. 1995 . Simultaneous Heat and Mass Transfer During the Deep Fat Frying of Tortilla Chips . J. Food Proc. & Engng. , 18 : 307 – 320 .
- Farkas , B.E. , Singh , R.P. and Rumsey , T.R. 1996 . Modeling Heat and Mass Transfer in Immersion Frying. I, Model Development . J. Food Engng. , 29 : 211 – 226 .
- Farkas , B.E. , Singh , R.P. and Rumsey , T.R. 1996 . Modeling Heat and Mass Transfer in Immersion Frying. II, Model Solution and Verification . J. Food Engng. , 29 : 227 – 248 .
- Ikediala , J.N. , Correia , L.R. , Fenton , G.A. and Ben-Abdallah , N. 1996 . Finite Element Modeling of Heat Transfer in Meat Patties During Single-sided Pan-Frying . J. Food Sci. , 61 : 796 – 802 .
- Ufheil , L. G. and Escher , F. 1996 . Dynamics of Oil Uptake During Deep-fat Frying of Potato Slices . Lebensm.-Wiss. u -Technol. , 29 : 640 – 644 .
- Vasanti , C.K.N. , Seow , C.C. and Sulebele , G.A. 1996 . Effects of Frying Parameters on Physical Changes o Tapioca Chips During Deep-fat Frying . Int. J. Food Sci. & Technol. , 31 : 249 – 256 .
- 1995 . “ Official Methods of Analysis ” . In Association of Official Analytical Chemists (A.O.A.C.) Washington D.C., , USA
- Rahman , S. 1995 . “ Thermal Diffusivity of Foods ” . In Food Properties Handbook 338 – 392 . USA : CRC Press, Inc. .
- Vélez , J.F. , Lopezmalo , A. , Argaíz , A. and Lomas , J.M. 1990 . Adaptation and Design of Equipment for Thermal Properties Determination of Food Products . Chem. Engng. Advances MEXICO , : 16 – 29 .
- Moreira , R. , Palau , J. , Sweat , V.E. and Sun , X. 1995 . Thermal and Physical Properties of Tortilla Chips as a Function of Frying Time . J. Food Proc. & Preservat. , 19 : 175 – 189 .
- Rahman , S. 1995 . “ Heat Transfer Coefficient in Food Processing ” . In Food Properties Handbook 393 – 412 . USA : CRC Press, Inc. .
- Vijayan , J. and Singh , R.P. Sensitivity to Processing Conditions During Frying of Frozen Foods . Seventh International Congress of Engineering and Food . April 13–17 , England. Engineering and Food at ICEF 7 , Edited by: Jowitt , R. pp. 49 – 52 . UK : Sheffield Academic Prees . part 2, H
- Balasubramaniam , V.M. , Mallikarjunan , P. and Chinnan , M.S. 1995 . “ Heat and Mass Transfer During Deep-fat Frying of Chicken Nuggets Coated with Edible Film: Influence of Initial Fat Content ” . In CoFE 103 – 106 .
- Guillaumin , R. 1988 . “ Kinetics of Fat Penetration in Food ” . In Frying of Food. Principles, Changes, New Approaches Edited by: Varela , G. , Bender , A.E. and Morton , J.D. Chichester, , England : VCH Publishers .
- Pinthus , E.J. , Weinberg , P. and Saguy , I.S. 1995 . Oil Uptake in Deep-fat Frying as Affected by Porosity . J. Food Sci. , 60 ( 4 ) : 767 – 769 .