Abstract
The electrical conductivity of milk at various dilutions was measured at different temperatures from 2 to 70°C. The results showed that dilution has only a small influence on the temperature dependence of conductivity. A simple power-law model predicts that the conductivity is proportional to the milk concentration to the power of 0.84 and a two-term model describes the temperature dependency. The overall model has a standard deviation of 0.0067 mS cm−1, which corresponds approximately to 0.1% milk at 2°C and 0.07% milk at 70°C. It was further shown that for less than about 25% milk in water Kohlrausch's law and the Debye-Hückel-Onsager theory can be used to describe the relationship between the concentration, temperature, and conductivity using a representative limiting molar conductivity of milk ions of 75 mS cm2 mol−1.
Introduction
Conductivity measurements are widely used in the dairy industry, for example, as a quality control of milk to detect mastitis,Citation[1] for analysing fermentation processes for production of cheese startersCitation[2] or to monitor the start-up and prerinsing phases of the milk pasteurization process.Citation[3] Start-up and prerinsing constitute considerable sources of raw material waste in dairies and thus more accurate methods of evaluating conductivity are needed. So far we have only a limited knowledge of how dilution affects the conductivity in the full concentration range of milk at different temperatures. Dejmek's work,Citation[4] for example, comprises data on only highly diluted milk solutions. In particular the scientific background to the observed nonlinear behavior of conductivity with dilution has not been studied.
Conductivity of Milk
Seminal work on milk conductivity was performed by PrenticeCitation[5] Citation[6]; more recently renewed interest was shown by Therdthai and ZhouCitation[7] who used an artificial neural network to model the conductivity of recombined milk. They also developed the method further into hybrid models by including milk component contribution in the form of Nernst's law or Kohlrausch's law.Citation[8]
The natural composition of milk changes with the age of the milk, the stage of lactation, the season, and the breed of cattle. The natural variation in milk conductivity is from 4.0 to 5.5 mS cm−1 at 20°C.Citation[9] The greatest contributions to the conductivity are known to be from the salts of milk (Table ).Citation[10] Some of the salts are dissolved in the serum as ions, while others are in temperature and pH dependent equilibria with the various species associated with the casein micelles or other proteins and their contribution to the conductivity is therefore more difficult to ascertain. Apart from the salts, the major components of milk are lactose, proteins, and fat in the form of milk fat globules. Lactose does not carry a charge, and its effect on conductivity is given by its effect on milk viscosity. Proteins do carry a pH dependent net charge, and their mobility in electric field can be directly measured by electrophoresis. Proteins affect the conductivity in two ways, by carrying a charge and by influencing viscosity. Considering a protein molecule as a macro ion, the order of magnitude of its molar conductivity can be estimated from its charge and size. As an example, for the case of the dominant whey protein, beta-lactoglobulin, with a charge of about 7 at physiological pH, and a radius r of some 2.5 nm, the ionic molar conductivity λ:
Table 1 Some of the most common ions present in milk and their concentration, valence, and limiting molar conductivity
This viscosity increase is here some 1.5% and this will decrease the total solution conductivity in the corresponding degree. Thus the net effect of protein on conductivity is one of decrease. At the common, low protein concentrations in milk the effect on viscosity and charge transport are approximately linear with concentration and are thus not likely to contribute to any complications in the calculation of the effects of dilution on conductivity.
The conductivity of milk is lower than for its fat- and casein-free phase also due to the obstruction of the charge-carrying ions by the fat and casein micelles.Citation[12] For milk, the relation between the fat content and conductivity is well understood theoreticallyCitation[13] and studied experimentally,Citation[5] and is given by:
Increasing temperature has a positive effect on conductivity. This is mainly due to decreased viscosity, but other effects such as changes in the degree of dissociation of the salts and changes in hydrodynamic radius may be of importance. Other effects of increased temperature on milk include the association of dissolved calcium and phosphate with casein micelles and the formation of solid calcium phosphate, Ca3(PO4)2.Citation[15] Due to the release of protons the pH decreases, but below 60°C, the changes are expected to be small. The temperature coefficient, i.e., the temperature dependency of conductivity of undiluted milk, has been examined by PrenticeCitation[6] and Oshima.Citation[16] Prentice showed that the temperature coefficient of undiluted milk changes with temperature. In the temperature interval 15–40°C, the temperature coefficient was found to decrease from 2.41 to 1.73%°C−1.
Conductivity of Strong Electrolytes
For strong electrolytes at low concentrations Kohlrausch's law and the Debye-Hückel-Onsager theory describe a nonlinear relationship between conductivity, temperature, and concentration. The dominating ions dissociated in the milk serum are potassium, chloride, and sodium. When dissociated in the serum, the ions conduct current as strong electrolytes. Kohlrausch's law says that the molar conductivity varies as the square root of the concentrationCitation[11]:
In this study a relation between conductivity, temperature, and degree of dilution of milk was determined. The validity of Kohlrausch's law and the Debye-Hückel-Onsager theory was also investigated for diluted milk samples.
Materials and Methods
The experiments were performed using two batches of commercial milk, 0.1% w/w fat (“Minimjölk”) and 0.5% w/w fat (“Lättmjölk”) both from Skånemejerier, Sweden. The milk batches were diluted in six concentrations from 100 to 10% milk in deionized water. The milk concentrations were 10, 15, 25, 50, 75, and 100%. Three samples were studied at each dilution. Each sample was heated from 2 to 70°C and the conductivity was measured at 2, 10, 20, 30, 40, 50, 60, and 70°C. In all 144 measurements were performed on each milk batch. The conductivity sensor used was an Orion model 150 conductivity meter with a nominal accuracy of ±0.5% of range (Orion, Boston, Massachusetts, USA).
Results and Discussion
The results of the conductivity measurements are presented in Fig. . All the results are corrected to 0% fat according to Prentice's model (Eq. (Equation3)). The difference in using Prentice's model or Lawton and Pethig's model is 0.03% for milk with 0.5% fat. The differences in conductivity between the batches are due to natural variations in milk conductivity. Figure shows that within the temperature interval 20–40°C, the temperature coefficient agrees with Prentice's results.Citation[6]
Figure 1 Experimental results from the conductivity measurements. Temperature range 2–70°C.
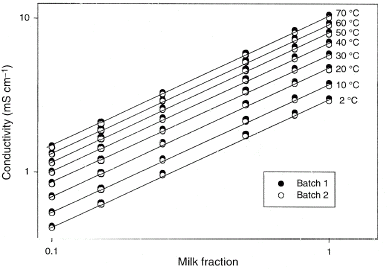
Figure 2 The relation between the conductivity of undiluted fat-free milk (K 0) and temperature. The experimental results from both milk batches are compared with Prentice's result.Citation[6]
![Figure 2 The relation between the conductivity of undiluted fat-free milk (K 0) and temperature. The experimental results from both milk batches are compared with Prentice's result.Citation[6]](/cms/asset/e2ab0eb0-25cf-4904-a9c9-b37b99b9ead4/ljfp_a_10345395_o_f0002.gif)
In Table the most common ions in milk serum and their properties are listed.Citation[9]
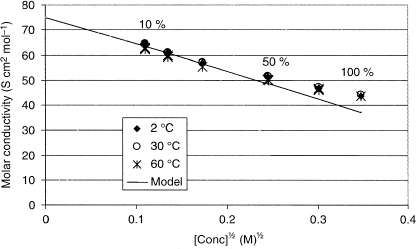
Citation[11] Based on the theoretical values, the total concentration of ions in undiluted milk is 120.9 mmol L−1 and a representative value of the valence is 1.1. The limiting molar conductivity () could not be found for some of the ions present in milk and therefore, a representative limiting molar conductivity could not be calculated based on literature data. A representative value of the limiting molar conductivity for milk, 75 S cm2 mol−1, was experimentally determined from the intercept in Fig. . Figure also shows Kohlrausch's law and the Debye-Hückel-Onsager theory at 25°C (solid line) together with experimental data for 2, 30, and 60°C. The experimental values are temperature compensated to 25°C. Temperature compensation is achieved assuming the same temperature dependency of the limiting molar conductivity of the ions of milk as the limiting molar conductivity of potassium, and the appropriate viscosities of milk serum.Citation[15]
Citation[17] The model shows good agreement at concentrations below 30 mM, which corresponds to about 25% milk in water. At higher concentrations the assumptions of the model are not valid. In milk solutions, a change in the degree of dissociation of the salts and changes in the voluminosity of micelles probably play an important role, and these parameters are influenced by the temperature as well as the concentration. The temperature also affects the composition of salts in the serum. Due to the complex nature of milk with primary and secondary effects of its components when heating or diluting it is very difficult to theoretically predict the conductivity. At high concentrations these effects become more dominant and make a prediction even more difficult. Therefore, an empirical model that includes all these effects is preferable for practical purposes.
Figure 3 The experimental values at 2, 30, och 60°C in relation to Kohlrausch law and the Debye-Hückel-Onsager theory, assuming a molar concentration of 120.9 mmol L−1, an ion valence of 1.1, and a limiting molar conductivity of 75 S cm2 mol−1. Pronounced deviation from linearity is seen at 0.2 M1/2, corresponding to about 25% milk in water.
A power-law model adequately describes the effect of dilution over the whole studied range:
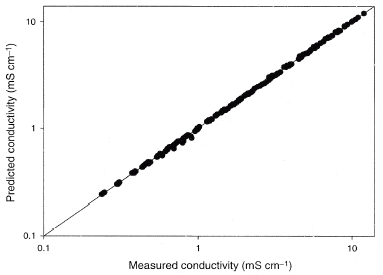
Figure 4 The predicted values from the model (Eqs. Equation(8)–(10)) vs. all the measured values.
By combining Eqs. (Equation3), (Equation8), and (Equation9) a general equation describing the conductivity of milk solutions in the temperature interval 2–70°C can be obtained:
Conclusions
Kohlrausch's law and the Debye-Hückel-Onsager theory show good agreement with experimental data at concentrations below 30 mM, which corresponds, to about 25% milk in water. The representative value of the limiting molar conductivity of milk was found to be 75 S cm2 mol−1. At higher milk concentrations, the theory cannot adequately describe the relationship between the conductivity, temperature, and milk concentration. A power-law model can, however, successfully describe this relation for milk concentrations between 10 and 100% in the temperature interval 2–70°C with a standard deviation of 0.0067 mS cm−1.
Acknowledgment
The authors wish to acknowledge the grant from The Swedish Agency for Innovation Systems. We should also like to thank Professor Rolf Sundberg for valuable comments to the article and advice in the model formulation.
References
- Nielen , M. , Deluyker , H. , Shukken , Y.H. and Brand , A. 1992 . Electrical conductivity of milk: measurement, modifiers, and meta analysis of mastitis detection performance . Journal of Dairy Science , 75 ( 2 ) : 606 – 614 .
- Paquet , J. , Lacroix , C. , Audet , P. and Thibault , J. 2000 . Electrical conductivity as a tool for analysing fermentation processes for production of cheese starters . International Dairy Journal , 10 : 391 – 399 .
- Lintner , K. 1986 . Dairy plant hygiene: can environmental impact be reduced? . Nordeuropæisk Mejeri-Tidskrift , 6 : 201 – 203 .
- Dejmek , P. Physical Measurements on Highly Diluted Dairy Products . 20th International Dairy Congress . June 26–30 1978 , Paris, France. pp. 430 – 432 . Paris : IDF .
- Prentice , J.H. 1962 . The conductivity of milk—the effect of the volume and degree of dispersion of the fat . Journal of Dairy Research , 29 : 131 – 139 .
- Prentice , J.H. 1972 . The temperature coefficient of electrolytic conductivity of milk . Journal of Dairy Research , 39 : 275 – 278 .
- Therdthai , N. and Zhou , W. 2001 . Artificial neural network modelling of the electrical conductivity property of recombined milk . Journal of Food Engineering , 50 ( 2 ) : 107 – 111 .
- Therdthai , N. and Zhou , W. 2002 . Hybrid neural modeling of the electrical conductivity property of recombined milk . Journal of Food Properties , 5 ( 1 ) : 49 – 61 .
- Walsta , P. , Geurts , T.J. , Noomen , A. , Jellema , A. and Van Boekel , M.A.J.S. 1999 . “ Milk Components ” . In Dairy Technology , Food Science and Technology 45 New York : Marcel Dekker, Inc. .
- Mabrook , M.F. and Petty , M.C. 2003 . Effect of composition on the electrical conductance of milk . Journal of Food Engineering , 10 : 391 – 399 .
- Atkins , P.W. 1994 . Physical Chemistry, , 5th Ed. 834 – 846 . Oxford, , Great Britain : Oxford University Press . C28 pp
- Dejmek , P. 1989 . Precision Conductometry in milk renneting . Journal of Dairy Research , 56 : 69 – 78 .
- Bruggeman , von D.A.G. 1935 . Berechnung verschiedener physikalischer konstanten von heterogenen substanzen . Annalen der Physik , 24 ( 5 ) : 636 – 664 .
- Lawton , B.A. and Pethig , R. 1993 . Determining the fat content of milk and cream using ac conductivity measurements . Measuring Science Technology , 4 : 38 – 41 .
- Walstra , P. and Jenness , R. 1984 . Dairy Chemistry and Physics 55 New York : John Wiley & Sons .
- Oshima , M. 1978 . Emperical formula for correcting electrical conductivity values of milk in relation to temperature . Japanese Journal of Zootechnical Science , 49 : 180 – 188 .
- Weast , R. , ed. 1974 . Handbook of Chemistry and Physics, , 55th Ed. D-132 Cleveland, Ohio : CRS Press .