Abstract
The meltabilities of 14 process cheese samples were determined at 2 and 4 weeks after manufacture using sensory analysis, a computer vision method, and the Olson and Price test. Sensory analysis meltability correlated with both computer vision meltability (R2 = 0.71, P < 0.001) and Olson and Price meltability (R2 = 0.69, P < 0.001). There was a marked lack of correlation between the computer vision method and the Olson and Price test. This study showed that the Olson and Price test gave greater repeatability than the computer vision method. Results showed process cheese meltability decreased with increasing inorganic salt content and with lower moisture/fat ratios. There was very little evidence in this study to show that process cheese meltability changed between 2 and 4 weeks after manufacture.
INTRODUCTION
Process cheese is made by further processing of finished natural cheese.[Citation1] This process involves blending and shredding natural cheeses of different types and degrees of maturity with emulsifying salts and heating the blend under a partial vacuum with constant agitation until a homogeneous mass is obtained. Other dairy and nondairy ingredients may also be included in the blend.[Citation2]
Meltability is a major functional property of cheese, especially in the applications of cheese as toppings or ingredients in prepared consumer foods.[Citation3] The measurement of cheese meltability is complex, as meltability is dependent on both the thermal phase change characteristics of the solid cheese and the rheological or flow properties of the melt. Both of these properties are dependent on the cheese composition and microstructure. However, their study is complicated because they are highly interdependent and transient properties. A melting cheese specimen experiences temperature gradients that are determined by cheese thermal properties, the external temperature distribution, the relative humidity in the oven, and the geometry of the system, which further complicates the assessment of cheese meltability.[Citation4]
All these factors hamper the development of a standard method that can objectively and reproducibly assess the meltability for different cheeses. Olson and Price,[Citation5] Kosikowski[Citation6] and Arnott et al.[Citation7] described the most commonly used methods currently employed for cheese meltability testing in industry. These are simple empirical methods that lack the objectivity required for research purposes, but they are attractive to industry because of their speed and simplicity. Sensory analysis of cheese to assess texture and flavor has been widely reported.[Citation8 Citation Citation Citation–11] Wang and Sun[Citation12] observed that the computer vision method provided an accurate quantitative account of the physical changes in cheese during melting and, thus, was capable of highlighting cheese meltability differences that were difficult to distinguish using the traditional methods. Wang and Sun[Citation12] reported that melting properties of different cheeses available in the literature to date have been inconsistent and incompatible. Reproducible methods that objectively assess cheese meltability are still needed in the industry.
Swenson et al.[Citation13] found that increasing the emulsifying salt content resulted in a decrease in the meltability of fat free process cheese spread. Awad et al.[Citation14] reported significant differences in meltability values of block type process cheese made with various emulsifying salt mixtures.
The aims of this research were (a) to assess the effects of inorganic salt content, moisture/fat ratios, and aging on process cheese meltability and (b) to compare sensory analysis, a computer vision method, and the Olson and Price test for determining process cheese meltability.
MATERIALS AND METHODS
Samples
Process cheese samples with varying moisture/fat ratios and inorganic salts content were manufactured at Teagasc, Dairy Products Research Centre. Ingredients used in the manufacture of the process cheeses were cheddar cheese, Irish commercial butter, water and emulsifying salt (disodium phosphate). A 3.1 kg batch of each cheese sample was manufactured. Ingredients were mixed for 1 minute in a Stephan cooker Model UMM/SK 5 (Stephan u. Söhne GmbH and Co., Hareln, Germany) and cooked to 80°C by direct (steam injection) and indirect (heating jacket) heating with constant stirring (knife at 300 rpm and baffle mixer at 80 rpm) for 2 minutes. The resulting mixture was poured into 225 g, food commercial grade, plastic containers with a capacity of 225 g, which were lidded, cooled, and placed in storage at 4°C.
Moisture was determined using an AOAC standard method[Citation15] with the substitution of an air-oven for the recommended vacuum oven. Fat, inorganic salt (NaCl + emulsifying salt) and protein contents of the batches were determined from the ingredients used. shows the range of composition of the 14 process cheese batches manufactured. The experimental design consisted of three levels of added butter (0, 5, and 10% of total mix) and five levels of emulsifying salt (1 – 3% of total mix). A fixed amount of natural cheese was added, and the balance of each mix was made up of pure water. One batch failed to produce a satisfactory cheese.
Table 1 Compositional data of process cheese batches
Sensory Analysis
Descriptive sensory analysis was carried out by an experienced panel of ten assessors, 9 females and 1 male, between 35 and 55 years of age, selected and recruited according to international standards.[Citation16] Prior to the start of the study, the panel took part in the development of a descriptive vocabulary to describe the sensory characteristics of process cheese. During discussion groups, the panel examined a full range of commercially available process cheeses. A list of attributes describing the characteristics of the samples was generated. During subsequent discussion groups, terms in the original list found to be similar in meaning were eliminated. The most representative terms describing the samples were retained. Descriptive sensory analysis was carried out using a final vocabulary of nine terms: firmness, rubbery, creamy, chewy, mouthcoating, fragmentable, melting, mass formation, and greasy/oily. In order to facilitate assessors as to the exact meaning of each attribute, included in the definition of each attribute was the location of the attribute within the chewing cycle.
Prior to assessment, each cheese was removed from refrigeration storage (4°C) and cut into 5 g cubes. Each process cheese sample was equilibrated to room temperature (21°C), presented in covered 110 ml polystyrene cups, and coded with randomly selected 3-digit codes. Each assessor was provided with deionised water and non-salted crackers and instructed to cleanse their palate between tasting. Each assessor was also provided with a list of the defined vocabulary. Cheeses were scored for attributes on unstructured 100 mm line scales labelled at both ends with extremes of each attribute. The intensity of each of the descriptive terms was recorded for each cheese using the Compusense five V 4.0 sensory data acquisition program (Guelph, Ont., Canada). At each test time, 2 and 4 weeks after manufacture, respectively, a descriptive analysis took place over 2 days. In total, there were 2 sessions for each test time, as all samples were analysed in duplicate. The order of tasting was balanced to account for the order of presentation and carry-over from one sample to the next effects.[Citation17] All assessments were conducted in individual booths at the sensory laboratory at University College Cork, which complies with international standards for the design of test rooms.[Citation18] The descriptive sensory factor, melting, was used in this study. The melting factor was judged on the extent to which the cheese melts in the mouth, characterized by a sensation of a smooth velvety fullness in the mouth, which is probably judged towards the end of the chewing cycle.
Computer Vision Method
This method was proposed by Wang and Sun.[Citation3] A similar test was reported by Kosikowski,[Citation6] which is known as “Schreiber's test.” Samples were tempered to 18 – 21°C, while in sealed 225 g plastic containers. Plugs of cheese, cut with a cork borer and a cheese string, 25 mm diameter and 5 mm long, were placed on open Petri dishes in a Gallenkamp Plus 2 oven (AGB Scientific, Dublin, Ireland) at 60°C for 10 minutes. A temperature of 60°C was chosen to avoided scorching and resulted in improved meltability determination, compared with higher temperatures, as found by Muthukumarappan et al.[Citation19] After 10 minutes in the oven, the samples were removed and allowed to cool for 15 minutes at room temperature on a horizontal surface. Due to the noncircular spread of the samples during heating observed in this study, measurement of the area of the spread rather than the diameter of the spread was recorded.[Citation19] The area of the melted cheese sample was measured using a computer vision system. The spread was calculated as the final area minus the original area of the cheese sample. This spread or change in area was taken as the meltability value for this method. Each sample was tested in triplicate and averaged to give the final result. Each sample was tested at 2 and 4 weeks after manufacture.
The computer vision system used in this study included a CCD camera (JVC, London, UK) supported by a copy stand, an IC-PCI frame grabber (Imaging Technology, Bedford, Mass., USA), a monitor and a computer. The system was switched on 30 minutes before tests. The images captured were saved in RGB format for subsequent analysis. Image processing and area measurement were performed using macros written in Opimas 6.51 (Media Cybernectics, Silver Spring, Md., USA).[Citation3]
Olson and Price Test
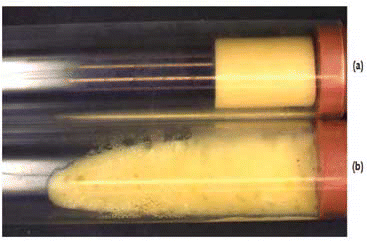
Meltability was measured using a technique similar to that developed by Mounsey and O'Riordan,[Citation20] which was a modification of the Olson and Price[Citation5] method. Samples were tempered to 18 – 21°C in sealed 225 g plastic containers. Cylinders of 25 mm diameter and 25 mm length were cut from the cheese blocks, with a cork bore and a cheese string. A sample was then placed in one end of a Pyrex tube (AGB Scientific, Dublin, Ireland), 250 mm length, 30 mm internal diameter, and this end was sealed with a rubber stopper. The opposite end was plugged with a pierced rubber stopper to allow gases to escape. The tube was placed horizontally in a Gallenkamp Plus 2 oven at 60°C for 15 minutes. The tubes were removed from the oven, allowed to cool for 15 minutes at room temperature on a horizontal surface, and the length in millimeters of the melted cheese sample was recorded, using standard calipers. The final length minus the original length was taken as an indication of the cheese meltability. Each cheese sample was tested in triplicate and averaged to give the final result. Each sample was tested at 2 and 4 weeks after manufacture.
RESULTS AND DISCUSSION
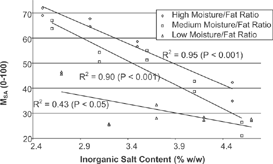
Significant correlations were obtained between inorganic salt content and sensory analysis meltability (MSA) for both high and medium moisture/fat ratios ( and ). These results concur with findings by Swenson et al.[Citation13] Increasing the inorganic salt content was found to decrease computer vision meltability (MCV) significantly for process cheese samples with high moisture/fat ratios (). Samples of medium moisture/fat ratios showed a lower but significant correlation between inorganic salt content and MCV, also concurring with the findings of Swenson et al.[Citation13] (). Correlations between inorganic salt content and Olson and Price meltability (MOP) were not significant for samples with high and low moisture/fat ratios but were significant for medium moisture/fat ratio, although less significant than MSA (). Samples of low moisture/fat ratio gave a low correlation between inorganic salt content and meltability (below the threshold for significance in the cases of MCV and MOP), indicating the effect of other factors on process cheese meltability. The lack of correlation between inorganic salt content and MCV and MOP for samples of low moisture/fat ratio may have been influenced by sample scorching altering the thermal and surface tension properties of the heating surface.
Table 2 Correlation (R2, signifanceFootnote 1 ) between inorganic salt content and process cheese meltability, determined by sensory analysis (MSA), computer vision method (MCV), and Olson and Price test (MOP)
Figure 1 Correlation coefficients (R2) computed for inorganic salt content and sensory analysis meltability (MSA) for high, medium and low moisture/fat ratio process cheese samples.
This study demonstrated that MSA and MOP, at 2 and 4 weeks after manufacture, were not significantly affected by aging and that MCV decreased, with low significance, over the 2 week aging period (). A study over a longer duration is recommended to further investigate the effect of aging on process cheese meltability.
Table 3 Sensory analysis meltability (MSA), computer vision meltability (MCV), and Olson and Price meltability (MOP) of the process cheeses in the study at 2 and 4 weeks after manufacture. Differences between 2 and 4 weeks are shown
The sensory analysis had a coefficient of variation of 7.6%. The Olson and Price test generated data with a coefficient of variation of 8.9%. The computer vision method was less repeatable with coefficients of variation of 24.7%. The statistical significance of the difference between 2 and 4 weeks for the computer vision method is probably due to the poor repeatability of the method.
The relationships between the three methods for assessing process cheese meltability were investigated. It was found that MSA significantly correlated with MCV (R2 = 0.71, P < 0.001), (
Figure 2 Correlation (R2) between sensory analysis meltability (MSA) and computer vision meltability (MCV) of process cheese samples.
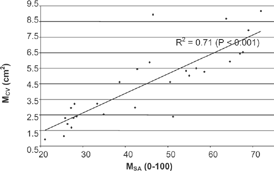
Figure 3 Correlation (R2) between sensory analysis meltability (MSA) and Olson and Price meltability (MOP) of process cheese samples.
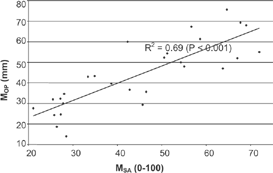
Figure 4 Images of process cheese discs (a) before and (b) after heating at 60°C for 10 minutes.
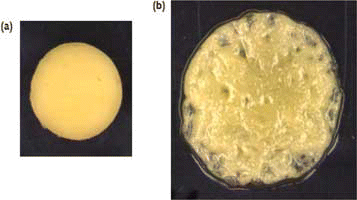
Figure 5 Images of process cheese cylinders (a) before and (b) after heating at 60°C for 15 minutes.
CONCLUSIONS
The meltabilities of 14 different process cheese samples were determined at 2 and 4 weeks after manufacture using sensory analysis, computer vision method, and Olson and Price test. Process cheese meltability decreased with increasing inorganic salt content and with lower moisture/fat ratios. There was very little evidence from this study of a change in process cheese meltability during storage between 2 and 4 weeks after manufacture. The Olson and Price test was found to have better repeatability than the computer vision method. Significant correlations were found between sensory analysis and the two reported methods. A less significant correlation was found between computer vision method and Olson and Price test, suggesting both methods provide information on the melting property of process cheese from different aspects.
References
- Bylund , G. 1995 . “ Tetra pak processing systems ” . In Dairy Processing Handbook , Sweden : AB, S-221 86 Lund .
- Fox , P.F. 1993 . “ Cheese: an overview ” . In Cheese: Chemistry, Physics and Microbiology , Vol. 1 , 1 – 36 . London, UK : Chapman and Hall .
- Wang , H.H. and Sun , D.W. 2002 . Melting characteristics of cheese: analysis of effect of cheese dimensions using computer vision techniques . J. Food Engineering , 52 : 279 – 284 .
- Park , J. , Rosenau , J.R. and Peleg , M. A . 1984 . comparison of four procedures of cheese meltability evaluation . J. Food Science , 49 : 1158 – 1170 .
- Olson , N.F. and Price , W.V. 1958 . A melting test for pasteurised process cheese spreads . J. Dairy Science , 41 : 999 – 1000 .
- Kosikowski , F . 1982 . Cheese and fermented milk foods , 2nd , 404 – 406 . New York, USA : F.V. Kosikowski and Associates .
- Arnott , D. , Morris , H. and Combs , W. 1957 . Effect of certain chemical factors on the melting quality of processed cheese . J. Dairy Science , 40 : 957 – 963 .
- Fenelon , M.A. , Guinee , T.P. , Delahunty , C. , Murray , J. and Crowe , F. 2000 . Composition and sensory attributes of retail cheddar cheese with different fat contents . J. Food Composition and Analysis , 13 ( 1 ) : 13 – 26 . [CROSSREF]
- Lawlor , J.B. and Delahunty , C.M. 2000 . The sensory profile and consumer performance for ten speciality cheeses . International J. Dairy Technology , 53 ( 1 ) : 28 – 36 .
- Piggott , J.R. 2000 . Dynamism in flavour science and sensory methodology . Food Research International , 33 ( 3–4 ) : 191 – 197 . [CROSSREF]
- Piggott , J.R. and Schaschke , C.J. 2001 . Release cells, breath analysis and in-mouth analysis in flavour research . Biomolecular Engineering , 17 ( 4–5 ) : 29 – 136 .
- Wang , H.H. and Sun , D.W. 2002 . Correlation between cheese meltability determined with a computer vision method and with Arnott and Schreiber tests . J. Food Science , 67 : 745 – 749 .
- Swenson , B.J. , Wendorff , W.L. and Lindsay , R.C. 2000 . Effects of ingredient on the functionality of fat-free process cheese spreads . J. Food Science , 65 : 822 – 825 .
- Awad , R.A. , Abdel-Hamid , L.B. , El-Shabrawy , S.A. and Singh , R.K. 2004 . Physical and sensory properties of block processed cheese with formulated emulsifying salt mixtures . J. Food Properties , 7 ( 4 ) : 429 – 448 . [CROSSREF]
- Association of Official Analytical Chemists . 1990 . “ AOAC 926.08. ” . In Official Methods of Analysis of the Association of Official Analytical Chemists , 15th , Vol. 2 , Arlington, USA : Association of Official Analytical Chemists, Inc. .
- International Organisation for Standardisation Sensory analysis . 1993 . “ ISO 8586 ” . In General Guidance for the Selection, Training and Monitoring of Assessors, Part 1: Selected Assessors , Geneva, Switzerland : ISO .
- MacFie , H.J. , Bratchell , N. , Greenhoff , K. and Vallis , I.V. 1989 . Designs to balance the effect of order of presentation and first-order carry-over effects in hall tests . J. Sensory Studies , 4 ( 2 ) : 129 – 148 .
- International Organisation for Standardisation Sensory analysis . 1988 . “ ISO 8589 ” . In General Guidance for the Design of Test Rooms , Geneva, Switzerland : ISO .
- Muthukumarappan , K. , Wang , Y.C. and Gunasekaran , S. 1999 . Short communication: Modified Schreiber test for evaluation of Mozzarella cheese meltability . J. Dairy Science , 82 : 1068 – 1071 .
- Mounsey , J. and O'Riordan , E. 1999 . Empirical and dynamic rheological data correlation to characterize melt characteristics of imitation cheese . J. Food Science , 64 : 701 – 703 .