
Abstract
Pharmacological stimulation/antagonism of astrocyte glio-peptide octadecaneuropeptide signaling alters ventromedial hypothalamic nucleus (VMN) counterregulatory γ-aminobutyric acid (GABA) and nitric oxide transmission. The current research used newly developed capillary zone electrophoresis-mass spectrometry methods to investigate hypoglycemia effects on VMN octadecaneuropeptide content, along with gene knockdown tools to determine if octadecaneuropeptide signaling regulates these transmitters during eu- and/or hypoglycemia. Hypoglycemia caused dissimilar adjustments in the octadecaneuropeptide precursor, i.e., diazepam-binding-inhibitor and octadecaneuropeptide levels in dorsomedial versus ventrolateral VMN. Intra-VMN diazepam-binding-inhibitor siRNA administration decreased baseline 67 and 65 kDa glutamate decarboxylase mRNA levels in GABAergic neurons laser-microdissected from each location, but only affected hypoglycemic transcript expression in ventrolateral VMN. This knockdown therapy imposed dissimilar effects on eu- and hypoglycemic glucokinase and 5’-AMP-activated protein kinase-alpha1 (AMPKα1) and -alpha2 (AMPKα2) gene profiles in dorsomedial versus ventrolateral GABAergic neurons. Diazepam-binding-inhibitor gene silencing up-regulated baseline (dorsomedial) or hypoglycemic (ventrolateral) nitrergic neuron neuronal nitric oxide synthase mRNA profiles. Baseline nitrergic cell glucokinase mRNA was up- (ventrolateral) or down- (dorsomedial) regulated by diazepam-binding-inhibitor siRNA, but knockdown enhanced hypoglycemic profiles in both sites. Nitrergic nerve cell AMPKα1 and -α2 transcripts exhibited division-specific responses to this genetic manipulation during eu- and hypoglycemia. Results document the utility of capillary zone electrophoresis-mass spectrometric tools for quantification of ODN in small-volume brain tissue samples. Data show that hypoglycemia has dissimilar effects on ODN signaling in the two major neuroanatomical divisions of the VMN and that this glio-peptide imposes differential control of glucose-regulatory neurotransmission in the VMNdm versus VMNvl during eu- and hypoglycemia.
Graphical Abstract
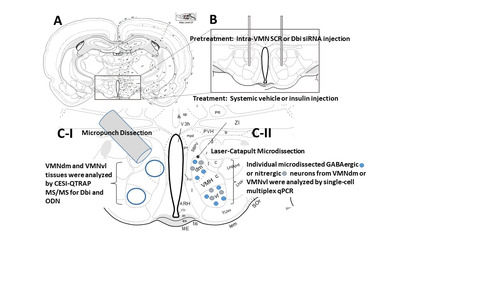
This is a visual representation of the abstract.
Introduction
An expansive, dedicated neural glucose-regulatory network controls autonomic, neuroendocrine, and behavioral outflow to maintain normal-range glycemic profiles (CitationWatts & Donovan, 2010). The final common command of these vital motor functions ensues from the hypothalamus, the hierarchal visceral efferent structure in the brain. The ventromedial hypothalamic nucleus (VMN) processes neurochemical, endocrine, and nutrient metabolic cues to shape counterregulatory hormone secretion (CitationChan & Sherwin, 2013; CitationTu et al., 2022). Neurochemical effectors of VMN glucose imbalance include the labile lipid-permeable gas nitric oxide (NO) and the amino acid transmitter γ-aminobutyric acid (GABA), which correspondingly stimulate or inhibit pancreatic glucagon and adrenomedullary epinephrine hormone secretion (CitationChan et al., 2006; CitationFioramonti et al., 2010; CitationRouth et al., 2014). NO and GABA signals originate within the VMN, as single-cell multiplex qPCR studies show that VMN neurons immunolabeled in situ for the marker protein glutamate decarboxylase65/67 (GAD) or neuronal nitric oxide synthase (nNOS) contain mRNA that encodes both GAD molecular weight variants (CitationAli, Alshamrani, Napit et al., 2022) or nNOSBriski [personal observation], respectively. The high-sensitivity energy gauge 5’-AMP-activated protein kinase (AMPK) undergoes activation via phosphorylation in reaction to the increased cellular AMP/ATP ratio (CitationHardie & Lin, 2017; CitationHardie et al., 2012; CitationHardie et al., 2016). Hypothalamic AMPK supplies vital cues on cell energy stability to neural pathways that govern bodily energy balance (CitationLópez, 2018; CitationPimentel et al., 2013; CitationXue & Kahn, 2006). Ventromedial hypothalamic AMPK is implicated in the neural regulation of hypoglycemic patterns of counterregulatory hormone outflow (CitationHan et al., 2005; CitationMcCrimmon et al., 2008). Brain cell glucopenia may directly suppress or enhance VMN GABAergic and nitrergic neuron transmission, respectively, as these nerve cell types express AMPK mRNAs (CitationAli, Alshamrani, Napit et al., 2022) and gene products (CitationBriski et al., 2020; CitationIbrahim et al., 2020), and show up-regulated AMPK phosphorylation during hypoglycemia (CitationBriski et al., 2020; CitationIbrahim et al., 2020).
Astrocytes sustain optimal brain nerve cell function by various mechanisms, including micro-circulatory blood flow control, energy fuel provision, and glio-transmitter signaling (CitationStobart & Anderson, 2013). The 86-amino acid astrocyte glio-peptide diazepam-binding inhibitor Dbi [also known as acyl-CoA-binding protein] is an endogenous ligand (endozepine) for the GABAA receptor-benzodiazepine binding site, i.e., central benzodiazepine receptor (CBR) (CitationAlho et al., 1985; CitationFerrero et al., 1986; CitationGuidotti et al., 1983). Octadecaneuropeptide (ODN; Dbi33–50), a bioactive endoproteolytic cleavage product of Dbi, is also a CBR ligand, yet ODN also acts by G-protein-coupled receptor (GPCR)-dependent mechanisms to control various distinctive neural functions, including maintenance of energy and glucose homeostasis (CitationAlquier et al., 2021; CitationBouyakdan et al., 2019; CitationLanfray et al., 2013; CitationLebrun et al., 2020; CitationMontégut et al., 2021; CitationPedro et al., 2019; CitationTonon et al., 2020). Pharmacological studies support the concept that ODN acts on central neural targets to impose feedback suppression of glycemia. Exogenous glucose supplied via perfusate to hypothalamic explants elicits ex vivo glucose release (CitationLanfray et al., 2013). Meanwhile, intracerebroventricular (icv) administration of the ODN isoactive surrogate ODN11−18 (OP) stimulates whole-body glucose utilization, whereas the ODN GPCR antagonist cyclo(1–8)[DLeu5]OP (LV-1075) increases blood glucose profiles (CitationLanfray et al., 2013). Use of these pharmacological tools in conjunction with a validated laboratory animal model for insulin (INS)-induced hypoglycemia (IIH) showed that ODN forebrain signaling controls GABAergic and nitrergic nerve cell energy sensor activation and transmitter marker protein expression within distinct rostro-caudal segments of the VMN (CitationBriski et al., 2023). As astrocyte endozepine release occurs widely throughout the hypothalamus (CitationAlho et al., 1985; CitationMalagon et al., 1993; CitationTonon et al., 1990), the prospect that icv OP or LV-1075 treatment effects on VMN neuron target protein expression reflect direct as opposed to afferent-mediated ODN input to those cells remains controversial. The current research utilized in vivo gene knockdown technology and high-resolution tissue- and cellular-level dissection tools to investigate the premise that VMN Dbi/ODN signaling is responsive to systemic glucoprivation, i.e., IIH, and, in turn, exerts control of VMN GABAergic and/or nitrergic metabolic-sensory function and neurotransmission during that nutrient imbalance.
Insight into physiological or pathophysiological patterns of Dbi/ODN signaling in discrete brain structures is meager as methods of requisite sensitivity for quantification of these individual peptides in small-volume neural tissue samples are lacking. The current research documents the utility of the integrated front-end high-performance capillary zone electrophoresis separation-electrospray ionization (CESI) module coupled with triple quadrupole-linear ion trap mass spectrometry (QTRAP MS/MS) for quantification of Dbi and ODN concentrations in brain tissue samples acquired by high-specificity microdissection in a relevant whole-animal model for glucose dyshomeostasis.
Recent studies show that the metabolic-sensory machinery expressed by VMN GABAergic neurons is not restricted to AMPK, but also includes glucokinase (Gck) (CitationAli, Alshamrani, Napit et al., 2022). Gck is a specialized hexokinase that catalyzes nonreversible, product-independent glucose phosphorylation in the initiating stage of glycolysis, hence performing as a glucose sensor at this critical phase of intermediary metabolism (CitationMatschinsky & Wilson, 2019). The upstream regulator glucokinase regulatory protein (Gkrp) controls Gck enzyme activity and subcellular distribution by controlling Gkrp-Gck complex formation (CitationAgius, 2008; CitationAgius, 2016; CitationSternisha & Miller, 2019). Glucose and Gkrp contend for attachment to Gck; falling intracellular glucose levels cause Gck deactivation, resulting creation of Gkrp-Gck complexes which move into the nucleus. New findings reveal that Gkrp protein expression is an indicator of Gck reactivity to metabolic stress (CitationAli, Alshamrani & Briski, 2022). The AMPK alpha catalytic subunit exists as two isoforms, e.g., Prkaa1/AMPK-alpha1 (AMPKα1) and Prkaa2/AMPK-alpha2 (AMPKα2). These variants are activated to a comparable extent when AMP levels rise, but each exhibits distinctive dissimilar substrate specificity which likely results in dissimilar effects on cell function by phosphorylation of different target proteins (CitationWoods et al., 1996). We lately observed that AMPK Prkaa1 and Prkaa2 subunit mRNAs are co-present in VMN GABAergic neurons, yet expression levels vary between neuroanatomical, e.g., dorsomedial (VMNdm) and ventrolateral (VMNvl) divisions of the VMN (CitationAli, Alshamrani, Napit et al., 2022), inferring that quantitative and/or qualitative aspects of AMPK function and influence on GABA nerve cell function may be different in these different subnuclear sites. It is not known if ODN regulates these metabolic-sensory gene profiles in GABAergic neurons located in one or both VMN divisions. It is also unclear if these gene transcripts are expressed in VMNdm and/or VMNvl NO nerve cells under ODN control. Herein, high-neuroanatomical resolution laser-catapult-microdissection technology was used in conjunction with single-cell multiplex qPCR analysis to address the concept that VMN Dbi/ODN signaling may regulate eu- and/or hypoglycemic patterns of Gck, Gkrp, and AMPKα1/Prkaa1 and AMPKα2/Prkaa2 subunit mRNA expression in GABAergic and nitrergic neurons, and that for one or both nerve cell types the direction or magnitude of this control may vary between VMNdm and VMNvl.
Materials and Methods
Animals: Male Sprague Dawley adult rats (340–380 gm bw) were housed in communal groups (2–3 animals per cage) under a 14 h light/10 h dark cycle (lights on at 05.00 h); animals were acclimated to daily handling prior to experimentation. Rats had unrestricted access to standard laboratory chow (prod. no. Harlan Teklad LM-485; Harlan Industries, Madison, WI, U.S.A.) and water. All experimental and surgical procedures were undertaken in conformity with the NIH Guide for the Care and Use of Laboratory Animals, 8th Edition, under approval by the university Institutional Animal Care and Use Committee. All studies were performed in accordance with ARRIVE guidelines.
Experimental Design: Rats were randomly assigned to one of four treatment groups (n = 4/group). On Study Day 1, animals were anaesthetized with ketamine/xylazine (0.1 mL/100 g bw; 90 mg ketamine:10 mg xylazine/mL; Henry Schein Animal Health, Dublin, OH, U.S.A.) prior to bilateral injection to the VMN with control scramble (SCR) siRNA (groups 1 and 3; 500 pmol; Accell™ Control Pool Non-Targeting; prod. no. D-001910-10-20; Horizon, Cambridge, U.K.) or Dbi siRNA (groups 2 and 4; 500 pmol; Accell™ Rat Dbi siRNA, set of 4; prod. no. A-099506-12-0010; Horizon). Stereotactic injections were made with a 33 gauge Neuros syringe (prod. no. 53496; Stoelting Co., Wood Dale, IL, U.S.A.) at predetermined three-dimensional coordinates [anteroposterior: 2.50 mm posterior to bregma; mediolateral: 0.6 mm lateral to midline; dorsoventral: 9.0 mm below skull surface], aided by a Neurostar stereotactic Drill and Injection Robot (Neurostar, Tubingen, DE), as described (CitationUddin et al., 2021). Post-operative care included subcutaneous (sc) ketoprofen [1 mg/ml/kg bw] (Bayer Health Care LLC, Animal Health Division, S. Mission, KS, U.S.A.) and intramuscular enrofloxacin [10 mg/0.1 mL] injections, and topical application of 0.25% bupivacaine to closed incisions. Rats were transferred to individual cages after full recovery from surgery. On Study Day 7, animals were injected sc at 09.00 h with sterile insulin diluent (V; groups 1 and 2, V; Eli Lilly & Company, Indianapolis, IN, U.S.A.) or neutral protamine Hagedorn insulin (INS; groups 3 and 4, INS; 10.0 U/kg bw CitationNapit et al., 2019; Eli Lilly); rats were euthanized by rapid decapitation at 10:00 h for brain and trunk blood collection. Each dissected brain was snap-frozen in dry ice-cooled isopentane for storage at −80°C. Serum was stored at −20°C.
VMN Neuron Immunolabeling and Single-Cell Laser-Catapult-Microdissection: Consecutive ten micron-thick fresh frozen sections were cut through the VMN between −1.8 mm and −2.3 mm posterior to bregma, and mounted on polyethylene naphthalate membrane-coated slides (prod. no. 415190-9041-000; Carl Zeiss Microscopy LLC, White Plains, NY, U.S.A.). Separate 1-in-5 series of sections were processed for immunolabeling of VMN GABAergic or nitrergic neurons, as described (CitationBriski et al., 2020; CitationBheemanapally et al., 2021; CitationRoy et al., 2023; CitationUddin et al., 2019). Briefly, after ice-cold acetone fixation (5 min), sections were blocked (1 h) with 1.5% normal goat serum (prod. no. S-1000, Vector Laboratories, Burlingame, CA, U.S.A.) in Tris-buffered saline, pH 7.4, (TBS) containing 0.05% Triton X-100 prior to incubation (36–48 h, 4°C) with rabbit anti-rat Gad65/67 (Gad; prod. no. ABN904, 1:1000; Millipore Sigma, Burlington, MA, U.S.A.; RRID:AB_2893025) or anti-rat nNOS (prod. no. NBP1-39681, 1:1000; Novus Biologicals, Littleton, CO, U.S.A.; RRID:AB_2282822) primary antibody (CitationBheemanapally et al., 2021; CitationBriski et al., 2020; CitationRoy et al., 2023; CitationUddin et al., 2019). Tissues were subsequently exposed to a horseradish peroxidase-labeled goat anti-rabbit secondary antiserum (prod. no. PI-1000, 1:1000; Vector Lab.; 1 h; RRID:AB-2336198). VMN Gad- or nNOS-immunoreactive-positive neurons were visualized using Vector ImmPACT 3,3-diaminobenzidine peroxidase substrate kit reagents (prod. no. SK-4105; Vector Lab.) for laser microdissection from VMNvl and VMNdm, using a Zeiss P.A.L.M. UV-A IV microlaser IV system (Carl Zeiss Microsc.). Dissected cells were collected into individual adhesive caps (prod. no. 415190-9181-000, Carl Zeiss Microsc.) containing lysis buffer (prod. no. 1725080, SingleShot Cell Lysis Kit; Bio-Rad Laboratories, Hercules, CA, U.S.A.) for single-cell multiplex reverse-transcription quantitative polymerase chain reaction (RT-qPCR) analysis (CitationAlshamrani et al., 2022; CitationUddin et al., 2019).
Single-cell Gene Profile Analysis of VMNdm versus VMNvl Laser-Catapult-Microdissected Samples: Complementary DNA (cDNA) Synthesis and Amplification: After centrifugation (3000 rpm; 4°C), cell lysates were sequentially incubated first at 25°C (10 min), then at 75°C (5 min) in a Bio-Rad iCycler iQ. Sample RNA integrity, purity, and quantity were evaluated in a Bio-Rad Experion electrophoresis system (CitationVavaiya & Briski, 2008). RNA samples were reverse-transcribed to cDNA by incubation at 46°C (20 min), then at 95°C (1 min) with cDNA synthesis buffer (1.5 µL; prod. no. 1725038, iScriptTM Advanced cDNA Synthesis Kit; Bio-Rad), as described (CitationAlshamrani et al., 2022; CitationUddin et al., 2019). The pre-amplification master mix was prepared by combining Gad1/Gad67 (prod. no. qRnoCID0004554), Gad2/Gad65 (prod. no. qRnoCID0003485), nNOS/NOS1/ (prod. no. qRnoCED0009301), Gck (prod. no. qRnoCID0009394), Gkrp (prod. no. qRnoCID0006775), Prkaa1 (prod. no. qRnoCID0001262), Prkaa2 (prod. no. qRnoCID0006799), and GAPDH (prod. no. qRnoCID0057018; Bio-Rad) PrimePCR™ PreAmp for SYBR® Green Assays with SsoAdvanced™ PreAmp Supermix (batch no. 64429956; Bio-Rad). cDNA pre-amplification was carried out by the addition of a 9.5 µL aliquot of pre-amplification master mix to individual cDNA samples prior to thermal cycler incubation at 95°C (3 min), followed by 22 cycles of incubation first at 95°C (15 s), followed by 60°C (4 min). RT-qPCR Analysis: Pre-amplified cDNA samples were diluted by the addition of IDTE (185 µL; prod. no. 11-05-01-05, 1X TE solution; Integrated DNA Technologies, Inc., Coralville, IA, U.S.A.); PCR samples were prepared by combining Bio-Rad primers [Gad1 (0.5 µL; prod. no. qRnoCID0004554), Gad2 (0.5 µL; prod. no. qRnoCID0003485), NOS1 (0.5 µL; prod. No. qRnoCED0009301), Gck (0.5 µL; prod. no. qRnoCID0009394), Gkrp (0.5 µL; prod. no. qRnoCID0006775), AMPKα1/Prkaa1 (0.5 µL; prod. no. qRnoCID0001262), AMPKα2/Prkaa2 (0.5 µL; prod. no. qRnoCID0006799), and GAPDH (0.5 µL; prod. no. qRnoCID0057018); Bio-Rad Lab.], cDNA sample (2 µL), and iTaq™ Universal SYBR® Green Supermix (5 µL; batch. no. 64463301; Bio-Rad). Samples were pipetted to Hard-Shell 384-Well PCR plates (prod. no. HSP3805; Bio-Rad) for analysis in a CFX384TM Touch Real-Time PCR Detection System (Bio-Rad), as follows: initial denaturation at 95°C (30 s), followed by 40 cycles of sequential incubation for 3 s at 95°C, then 45 s at 60.5°C for AMPKα1/Prkaa1 and AMPKα2/Prkaa2, 60.4°C for Gkrp, 60°C for Gad1 and Gad2, 59.5°C for Gck, or 57.3°C for nNOS and GAPDH. Melt curve analyses were performed to identify nonspecific products and primer dimers. Data were analyzed by the comparative Ct, e.g., 2−ΔΔCt method (CitationLivak & Schmittgen, 2001).
CESI-MS/MS QTRAP Analysis of Dbi and its Bioactive Fragment ODN in Micropunch-Dissected VMNvl versus VMNdm Tissue: The experimental design described above, with the exception that animals in each treatment group (n = 3/group) were sacrificed by microwave fixation (1.45 s exposure; In Vitro Microwave Fixation System, 5 kW; Stoelting Co., Wood Dale, IL, U.S.A.) 1 h after sc V or INS injection, (CitationBheemanapally et al., 2020a). Each snap-frozen brain was cut into consecutive 100 micron-thick fresh frozen sections through the VMN, over the distance of −1.80 to −2.30 mm posterior to bregma. For each animal, VMNvl and VMNdm tissues were each bilaterally micropunch-dissected from all sections, using a calibrated hollow 0.50 mm-diameter punch tool (prod. no. 57401; Stoelting Co.), and pooled separately in ultrapure water. Trypsinized or nontrypsinized VMNvl and VMNdm tissue samples were separated in a surface- and electrically-conditioned Silica Surface OptiMS cartridge bare-fused-silica capillary (prod. no. B07367; AB Sciex LLC, Farmington, MA, U.S.A.) in an AB Sciex CESI 8000 High Performance Separation Module with OptiMS Technology; data acquisition occurred in an AB Sciex QTRAP 5500 + mass spectrometer. A standard concentration of ODN (100 ng/mL) was introduced into the QTRAP 5500 + system to determine the presence of ODN +3 ion at m/z 638 in the plot of intensity (counts per second) versus m/z (Da) at ion spray voltage 2000 or 2200 V. Q1 MS Q1—enhanced product ion (EPI, Skyline Precursor ion scans)—multiple reaction monitoring was implemented to measure Dbi in trypsinized VMN samples, whereas Q1 MS Q1—EPI—MRM was performed to quantify ODN in non-trypsin-treated tissue. The ratio of the mass spectrometric area of each Dbi or ODN chromatogram was established relative to the sample protein content. For each treatment group, the mean value for triplicate peptide analysis was established and then divided by residuals to generate a response relative to the V-injected control group. Additional groups of animals (n = 3/group) were sacrificed by rapid decapitation 1 h after sc V or INS injection for micropunch-dissection of bilateral VMNvl and VMNdm samples, by reported methods (CitationAlenazi et al., 2014; CitationGujar et al., 2014; CitationShakya et al., 2018), for RT-qPCR analysis of the tissue Dbi mRNA content using protocols described above. Briefly, PCR samples were prepared by combining Bio-Rad Dbi primer (prod. no. qRnoCED0004146), cDNA, and iTaq™ Universal SYBR® Green Supermix, and analyzed by initial denaturation at 95°C (30 s), followed by 40 cycles of sequential incubation for 3 s at 95°C, then 45 s at 57.3°C. Data were analyzed by the 2−ΔΔCt method.
Glucose and CounterRegulatory Hormone Analyses: Plasma glucose concentrations were measured using an ACCU-CHECK Aviva-Plus glucometer (Roche Diagnostic Corporation, Indianapolis, IN, U.S.A.), as reported (CitationNapit et al., 2019). Plasma corticosterone (prod. no. ADI-900-097; Enzo Life Sciences, Inc., Farmingdale, NY; Corticosterone antibody: RRID:AB_2307314) and glucagon (prod. no. EIAR-GLU-1; RayBiotech, Peachtree Corners, Gam, U.S.A.), levels were measured as described (CitationNapit et al., 2019).
Statistical Analyses: Mean normalized mRNA measures, Dbi and ODN mass spectrometric data, and glucose and counterregulatory hormone profiles were evaluated between treatment groups by two-way analysis of variance and Student Newman Keuls post-hoc test. Differences of p < 0.05 were considered significant. In each figure, statistical differences between specific pairs of treatment groups are denoted as follows: *p < 0.05; **p < 0.01; and ***p < 0.001.
Results
Current research utilized integrated front-end high-performance CESI coupled with QTRAP mass spectrometry to analyze the Dbi and ODN content of micropunch-dissected tissue taken from distinctive subdivisions of the VMN, i.e., VMNdm versus VMNvl, of eu- or hypoglycemic rats, and to investigate Dbi siRNA pretreatment effects on those measures. depicts the effects of bilateral stereotactic administration of scramble (SCR) or DBI siRNA to the VMN on VMNdm or VMNvl Dbi mRNA ( and ), Dbi protein ( and ), and ODN protein ( and ) content of micropunch-dissected tissue samples acquired after sc injection of V or INS. Euglycemic animals exhibited significant reductions in VMNdm () and VMNvl () Dbi mRNA profiles following Dbi siRNA delivery compared to SCR controls [Dbi siRNA/V (diagonal-striped white bars) versus SCR siRNA/V (solid white bars)]. INS injection had divergent, subdivision-specific effects on Dbi mRNA expression as levels were increased (VMNdm) or decreased (VMNvl) relative to V controls [SCR siRNA/INS (solid gray bars) versus SCR siRNA/V]. Dbi gene knockdown was efficacious in preventing the VMNdm Dbi mRNA stimulatory response to IIH [Dbi siRNA/INS (diagonal-striped gray bar) versus SCR siRNA/INS].
Figure 1 High-performance Capillary Electrophoresis-Electrospray Ionization-Quadrupole-Linear Ion Trap Mass Spectrometry (QTRAP CESI-MS/MS) Quantification of Diazepam Binding Inhibitor (Dbi) and Octadecaneuropeptide (ODN) in Ventromedial Hypothalamic Nucleus (VMN) Dorsomedial (VMNdm) versus Ventrolateral (VMNvl) Divisions. Groups of Dbi or scramble (SCR) siRNA-pretreated male rats (n = 3/group) were sacrificed by microwave fixation 1 h after subcutaneous (sc) injection of vehicle (V) or neutral protamine Hagedorn insulin (INS; 10.0 U/kg bw). VMNvl and VMNdm tissues were each bilaterally micropunch-dissected from 100 micron-thick fresh frozen sections cut from −1.80 to −2.30 mm posterior to bregma, using a hollow 0.50 mm-diameter punch tool, for CESI-QTRAP MS/MS analysis (see the Materials and Methods section). Data depict mean Dbi mRNA [ (VMNdm) and 1D (VMNvl)], Dbi protein [ (VMNdm) and 1E (VMNvl), or ODN protein [ (VMNdm) and 1F (VMNvl)] measures ± S.E.M. following treatment groups: SCR siRNA/V (solid white bars, n = 3), Dbi siRNA/V (diagonal-striped white bars, n = 3), SCR siRNA/INS (solid gray bars, n = 3), and Dbi siRNA/INS (diagonal-striped gray bars, n = 3). Results of statistical analyses are as follows: VMNdm Dbi mRNA: F(3,8): 45.65, p < 0.001; Knockdown main effect: F(1,8): 34.62, p < 0.001; INS main effect: F(1,8): 62.05, p < 0.001; Knockdown/INS interaction: F(1,8): 40.27; p < 0.001; VMNvl Dbi mRNA: F(3,8): 69.86, p < 0.001; Knockdown main effect: F(1,8): 177.75, p < 0.001; INS main effect: F(1,8): 18.45, p = 0.003; Knockdown/INS interaction: F(1,8): 13.38; p = 0.006]; F(3,8): 45.65, p < 0.001, Knockdown main effect: F(1,8): 34.62, p < 0.001; INS main effect: F(1,8): 62.05, p < 0.001; Knockdown/INS interaction: F(1,8): 40.27; p < 0.001]; VMNdm Dbi protein: F(3,8): 4.90, p = 0.032; Knockdown main effect: F(1,8): 0.702, p = 0.426; INS main effect: F(1,8):1.01, p = 0.344; Knockdown/INS interaction: F(1,8): 12.98; p = 0.007]; VMNdm ODN protein: F(3,8): 14.07, p = 0.001, Knockdown main effect: F(1,8): 1.97, p = 0.198; INS main effect: F(1,8): 9.45, p = 0.015; Knockdown/INS interaction: F(1,8): 30.78, p < 0.001; VMNvl Dbi protein: F(3,8): 13.15, p = 0.002, Knockdown main effect: F(1,8): 1.97, p = 0.198; INS main effect: F(1,8): 6.83, p = 0.031; Knockdown/INS interaction: F(1,8): 30.66, p < 0.001; VMNvl ODN protein: F(3,8): 37.87, p < 0.001; Knockdown main effect: F(1,8): 22.29, p = 0.002; INS main effect: F(1,8): 91.27, p < 001; Knockdown/INS interaction: F(1,8): 0.06, p = 0.816]. Statistical differences between discrete pairs of treatment groups are denoted as follows: *p < 0.05; **p < 0.01; and ***p < 0.001.
![Figure 1 High-performance Capillary Electrophoresis-Electrospray Ionization-Quadrupole-Linear Ion Trap Mass Spectrometry (QTRAP CESI-MS/MS) Quantification of Diazepam Binding Inhibitor (Dbi) and Octadecaneuropeptide (ODN) in Ventromedial Hypothalamic Nucleus (VMN) Dorsomedial (VMNdm) versus Ventrolateral (VMNvl) Divisions. Groups of Dbi or scramble (SCR) siRNA-pretreated male rats (n = 3/group) were sacrificed by microwave fixation 1 h after subcutaneous (sc) injection of vehicle (V) or neutral protamine Hagedorn insulin (INS; 10.0 U/kg bw). VMNvl and VMNdm tissues were each bilaterally micropunch-dissected from 100 micron-thick fresh frozen sections cut from −1.80 to −2.30 mm posterior to bregma, using a hollow 0.50 mm-diameter punch tool, for CESI-QTRAP MS/MS analysis (see the Materials and Methods section). Data depict mean Dbi mRNA [Figures 1A (VMNdm) and 1D (VMNvl)], Dbi protein [Figures 1B (VMNdm) and 1E (VMNvl), or ODN protein [Figures 1C (VMNdm) and 1F (VMNvl)] measures ± S.E.M. following treatment groups: SCR siRNA/V (solid white bars, n = 3), Dbi siRNA/V (diagonal-striped white bars, n = 3), SCR siRNA/INS (solid gray bars, n = 3), and Dbi siRNA/INS (diagonal-striped gray bars, n = 3). Results of statistical analyses are as follows: VMNdm Dbi mRNA: F(3,8): 45.65, p < 0.001; Knockdown main effect: F(1,8): 34.62, p < 0.001; INS main effect: F(1,8): 62.05, p < 0.001; Knockdown/INS interaction: F(1,8): 40.27; p < 0.001; VMNvl Dbi mRNA: F(3,8): 69.86, p < 0.001; Knockdown main effect: F(1,8): 177.75, p < 0.001; INS main effect: F(1,8): 18.45, p = 0.003; Knockdown/INS interaction: F(1,8): 13.38; p = 0.006]; F(3,8): 45.65, p < 0.001, Knockdown main effect: F(1,8): 34.62, p < 0.001; INS main effect: F(1,8): 62.05, p < 0.001; Knockdown/INS interaction: F(1,8): 40.27; p < 0.001]; VMNdm Dbi protein: F(3,8): 4.90, p = 0.032; Knockdown main effect: F(1,8): 0.702, p = 0.426; INS main effect: F(1,8):1.01, p = 0.344; Knockdown/INS interaction: F(1,8): 12.98; p = 0.007]; VMNdm ODN protein: F(3,8): 14.07, p = 0.001, Knockdown main effect: F(1,8): 1.97, p = 0.198; INS main effect: F(1,8): 9.45, p = 0.015; Knockdown/INS interaction: F(1,8): 30.78, p < 0.001; VMNvl Dbi protein: F(3,8): 13.15, p = 0.002, Knockdown main effect: F(1,8): 1.97, p = 0.198; INS main effect: F(1,8): 6.83, p = 0.031; Knockdown/INS interaction: F(1,8): 30.66, p < 0.001; VMNvl ODN protein: F(3,8): 37.87, p < 0.001; Knockdown main effect: F(1,8): 22.29, p = 0.002; INS main effect: F(1,8): 91.27, p < 001; Knockdown/INS interaction: F(1,8): 0.06, p = 0.816]. Statistical differences between discrete pairs of treatment groups are denoted as follows: *p < 0.05; **p < 0.01; and ***p < 0.001.](/cms/asset/5794c293-2579-433e-b550-1519aefeaa30/tasn_a_12426813_f0001.jpg)
As shown in and , DBI gene silencing significantly decreased baseline VMNdm ODN, but not Dbi protein levels versus SCR siRNA-pretreated, V-injected controls [Dbi siRNA/V versus SCR siRNA/V]. IIH caused dissimilar changes in these VMNdm protein profiles as the Dbi content was increased relative to euglycemic controls [SCR siRNA/INS (solid gray bars) versus SCR siRNA/V], whereas ODN levels declined compared to the SCR siRNA/V group. Pretreatment with Dbi siRNA attenuated the Dbi stimulatory response to hypoglycemia [Dbi siRNA/INS (diagonal-striped gray bar) versus SCR siRNA/INS], and attenuated the coincident decline in ODN content. Data in and indicate that Dbi gene knockdown suppressed VMNvl Dbi and ODN protein levels in the euglycemic state [Dbi siRNA/V (thin diagonal-striped gray bars) versus SCR siRNA/V (solid white bars)]. IIH decreased VMNvl Dbi protein profiles [SCR siRNA/INS versus SCR siRNA/V] while causing a coincident augmentation of ODN levels. Dbi siRNA pretreatment abated hypoglycemic up-regulation of the VMNvl Dbi content [Dbi siRNA/INS versus SCR siRNA/INS] and reversed IIH-associated diminution of ODN protein.
illustrates the effects of SCR versus Dbi siRNA pretreatment on target gene expression profiles in laser-catapult-microdissected VMNvl GABAergic nerve cell samples acquired from eu- or hypoglycemic animals. Data in and show that Dbi gene silencing significantly suppressed euglycemic patterns of Gad1 and Gad2 mRNA expression. IIH down-regulated both GAD isoform transcripts; these inhibitory responses were blunted by Dbi siRNA pretreatment. Hypoglycemia suppression of Gad1 and Gad2 gene expression exceeded that caused by Dbi gene silencing. Dbi siRNA also suppressed baseline VMNvl GABA nerve cell Gck and Gkrp mRNA expression. Hypoglycemia significantly decreased both Gck and Gkrp gene expression in this cell type; Dbi gene knockdown attenuated this inhibition of Gck, but not Gkrp. Baseline VMNvl GABAergic neuron AMPKα1/Prkaa1 and AMPKα2/Prkaa2 gene profiles in euglycemic animals were correspondingly refractory to or down-regulated by Dbi siRNA. IIH stimulated expression of the former, but inhibited the latter mRNA profile. These dissimilar gene responses were each reversed by Dbi siRNA pretreatment.
Figure 2 Effects of Dbi Gene Knockdown on Eu- or Hypoglycemic Neurotransmitter and Metabolic Sensor Marker Gene Expression Patterns in VMNvl γ-Aminobutyric Acid (GABAergic) Neurons. Groups of male rats (n = 4/group) were pretreated by bilateral administration of Dbi or SCR siRNA to the VMN 7 days prior to sc V or INS injection. Individual VMNvl glutamate decarboxylase (Gad)65/67-immunopositive neurons were laser-catapult-microdissected from 10 micron-thick fresh frozen sections for multiplex single-cell qPCR analyses. mRNA data were normalized to the housekeeping gene GAPDH by the 2−ΔΔCt method. Data depict mean normalized Gad1/Gad67 (), Gad2/Gad65 (), glucokinase (Gck; ), glucokinase-regulatory peptide (Gkrp; ), 5’-AMP-activated protein kinase-alpha1 (AMPKα1/Prkaa1; ), or AMPK-alpha2 (AMPKα2/Prkaa2; ) mRNA measures ± S.E.M. for the following treatment groups: SCR siRNA/V (solid white bars, n = 8), Dbi siRNA/V (diagonal-striped white bars, n = 8), SCR siRNA/INS (solid gray bars, n = 8), and Dbi siRNA/INS (diagonal-striped gray bars, n = 8). Outcomes of statistical analyses are as follows: Gad1: F(3,28): 115.48, p < 0.001; Knockdown main effect: F(1,28): 58.82, p < 0.0001; INS main effect: F(1,28): 155.34, p < 0.001; Knockdown/INS interaction: F(1,28): 132.28, p < 0.001; Gad2: F(3,28): 193.99, p < 0.001; Knockdown main effect: F(1,28): 98.60, p < 0.0001; INS main effect: F(1,28): 214.88, p < 0.001; Knockdown/INS interaction: F(1,28): 268.50, p < 0.001; Gck: F(3,28): 1425.23, p < 0.001; Knockdown main effect: F(1,28): 497.17, p < 0.0001; INS main effect: F(12,8): 2786.75, p < 0.001; Knockdown/INS interaction: F(12,8): 991.77, p < 0.001; Gkrp: F(3,28): 248.72, p < 0.001; Knockdown main effect: F(1,28): 182.30, p < 0.0001; INS main effect: F(1,28): 336.03, p < 0.0001; Knockdown/INS interaction: F(1,28): 227.83, p < 0.001]; AMPKα1/Prkaa1: F(3,28): 358.40, p < 0.001; Knockdown main effect: F(1,28): 401.23, p < 0.0001; INS main effect: F(1,28): 316.17, p < 0.001; Knockdown/INS interaction: F(1,28): 357.81, p < 0.001; AMPKα2/Prkaa2: F(3,28): 164.77, p < 0.001, Knockdown main effect: F(1,28): 55.19, p < 0.0001; INS main effect: F(1,28): 6.39, p = 0.017; Knockdown/INS interaction: F(1,28): 432.73, p < 0.001]. Statistical differences between discrete pairs of treatment groups are denoted as follows: *p < 0.05; **p < 0.01; and ***p < 0.001.
![Figure 2 Effects of Dbi Gene Knockdown on Eu- or Hypoglycemic Neurotransmitter and Metabolic Sensor Marker Gene Expression Patterns in VMNvl γ-Aminobutyric Acid (GABAergic) Neurons. Groups of male rats (n = 4/group) were pretreated by bilateral administration of Dbi or SCR siRNA to the VMN 7 days prior to sc V or INS injection. Individual VMNvl glutamate decarboxylase (Gad)65/67-immunopositive neurons were laser-catapult-microdissected from 10 micron-thick fresh frozen sections for multiplex single-cell qPCR analyses. mRNA data were normalized to the housekeeping gene GAPDH by the 2−ΔΔCt method. Data depict mean normalized Gad1/Gad67 (Figure 2A), Gad2/Gad65 (Figure 2B), glucokinase (Gck; Figure 2C), glucokinase-regulatory peptide (Gkrp; Figure 2D), 5’-AMP-activated protein kinase-alpha1 (AMPKα1/Prkaa1; Figure 2E), or AMPK-alpha2 (AMPKα2/Prkaa2; Figure 2F) mRNA measures ± S.E.M. for the following treatment groups: SCR siRNA/V (solid white bars, n = 8), Dbi siRNA/V (diagonal-striped white bars, n = 8), SCR siRNA/INS (solid gray bars, n = 8), and Dbi siRNA/INS (diagonal-striped gray bars, n = 8). Outcomes of statistical analyses are as follows: Gad1: F(3,28): 115.48, p < 0.001; Knockdown main effect: F(1,28): 58.82, p < 0.0001; INS main effect: F(1,28): 155.34, p < 0.001; Knockdown/INS interaction: F(1,28): 132.28, p < 0.001; Gad2: F(3,28): 193.99, p < 0.001; Knockdown main effect: F(1,28): 98.60, p < 0.0001; INS main effect: F(1,28): 214.88, p < 0.001; Knockdown/INS interaction: F(1,28): 268.50, p < 0.001; Gck: F(3,28): 1425.23, p < 0.001; Knockdown main effect: F(1,28): 497.17, p < 0.0001; INS main effect: F(12,8): 2786.75, p < 0.001; Knockdown/INS interaction: F(12,8): 991.77, p < 0.001; Gkrp: F(3,28): 248.72, p < 0.001; Knockdown main effect: F(1,28): 182.30, p < 0.0001; INS main effect: F(1,28): 336.03, p < 0.0001; Knockdown/INS interaction: F(1,28): 227.83, p < 0.001]; AMPKα1/Prkaa1: F(3,28): 358.40, p < 0.001; Knockdown main effect: F(1,28): 401.23, p < 0.0001; INS main effect: F(1,28): 316.17, p < 0.001; Knockdown/INS interaction: F(1,28): 357.81, p < 0.001; AMPKα2/Prkaa2: F(3,28): 164.77, p < 0.001, Knockdown main effect: F(1,28): 55.19, p < 0.0001; INS main effect: F(1,28): 6.39, p = 0.017; Knockdown/INS interaction: F(1,28): 432.73, p < 0.001]. Statistical differences between discrete pairs of treatment groups are denoted as follows: *p < 0.05; **p < 0.01; and ***p < 0.001.](/cms/asset/152cbf69-0297-403e-a76a-3862f3f42519/tasn_a_12426813_f0002.jpg)
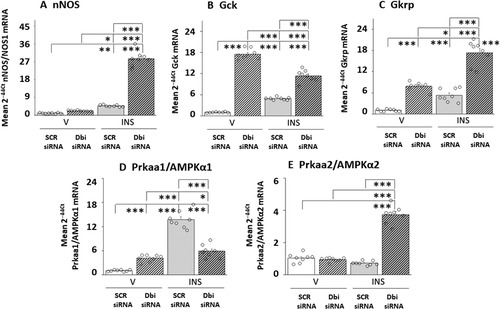
depicts patterns of VMNdm GABA neuron transmitter marker and metabolic sensor gene expression in SCR versus Dbi siRNA-pretreated, V- or INS-injected rats. Dbi gene silencing in euglycemic rats caused suppression of Gad1 and Gad2 gene profiles in this cell type. This cell type also exhibited a reduction in both GAD isoform gene profiles during IIH; this inhibitory effect was similar in magnitude to that caused by Dbi gene knockdown. Hypoglycemia thus evidently results in a loss of Dbi/ODN inhibition of both GAD mRNA profiles in VMNdm, but not VMNvl GABAergic neurons. VMNdm GABAergic neurons also differ from their VMNvl counterparts by a lack of Dbi siRNA effects on basal Gck or Gkrp gene expression. IIH did not modify Gck mRNA expression, but elevated Gkrp mRNA in these cells by Dbi/ODN-dependent mechanisms. As seen in and , baseline VMNdm GABAergic neuron AMPKα1/Prkaa1 and AMPKα2/Prkaa2 gene profiles were each up-regulated by Dbi siRNA, albeit to a dissimilar extent. While the former gene transcript was unaffected by IIH, the latter mRNA was amplified under those conditions by Dbi/ODN-dependent mechanisms.
Figure 3 VMNdm GABAergic Nerve Cell Neurotransmitter and Metabolic Sensor Marker Gene Expression during Eu- versus Hypoglycemia; Effects of Dbi Gene Knockdown. Experimental design, treatment group designations, target gene profiles, analytical and statistical methods, and data presentation format are identical to those described in above, except that GAD-immunopositive neurons were laser-catapult-microdissected from the VMNdm. Outcomes of statistical analyses are as follows: Gad1: F(3,28): 35.44, p < 0.001; Knockdown main effect: F(1,28): 21.68, p < 0.0001; INS main effect: F(1,28): 26.88, p < 0.0001; Knockdown/INS interaction: F(1,28): 57.77; p < 0.001]; Gad2: F(32,8): 28.17, p < 0.001, Knockdown main effect: F(1,28): 22.09, p < 0.0001; INS main effect: F(1,28): 56.50, p < 0.0001; Knockdown/INS interaction: F(1,28): 5.91, p = 0.022]; Gck: F(3,28): 45.97, p < 0.001; Knockdown main effect: F(1,8): 56.53, p < 0.0001; INS main effect: F(1,28): 40.52, p < 0.001; Knockdown/INS interaction: F(1,28): 40.84, p < 0.001]; Gkrp: F(3,28): 11.19, p < 0.001; Knockdown main effect: F(1,28): 13.58, p = 0.001; INS main effect: F(1,28): 13.78, p = 0.001; Knockdown/INS interaction: F(1,28): 5.99, p = 0.021]; AMPKα1/Prkaa1: F(3,28): 145.46, p < 0.001, Knockdown main effect: F(1,28): 123.46, p < 0.0001; INS main effect: F(1,28): 143.73, p < 0.00; Knockdown/INS interaction: F(1,28): 169.21, p < 0.001]; AMPKα2/Prkaa2: F(3,28): 84.67, p < 0.001; Knockdown main effect: F(1,28): 71.92; p < 0.0001; INS main effect: F(1,28): 32.30; p < 0.001; Knockdown/INS interaction: F(1,28): 149.78; p < 0.001]. *p < 0.05; **p < 0.01; and ***p < 0.001.
![Figure 3 VMNdm GABAergic Nerve Cell Neurotransmitter and Metabolic Sensor Marker Gene Expression during Eu- versus Hypoglycemia; Effects of Dbi Gene Knockdown. Experimental design, treatment group designations, target gene profiles, analytical and statistical methods, and data presentation format are identical to those described in Figure 2 above, except that GAD-immunopositive neurons were laser-catapult-microdissected from the VMNdm. Outcomes of statistical analyses are as follows: Gad1: F(3,28): 35.44, p < 0.001; Knockdown main effect: F(1,28): 21.68, p < 0.0001; INS main effect: F(1,28): 26.88, p < 0.0001; Knockdown/INS interaction: F(1,28): 57.77; p < 0.001]; Gad2: F(32,8): 28.17, p < 0.001, Knockdown main effect: F(1,28): 22.09, p < 0.0001; INS main effect: F(1,28): 56.50, p < 0.0001; Knockdown/INS interaction: F(1,28): 5.91, p = 0.022]; Gck: F(3,28): 45.97, p < 0.001; Knockdown main effect: F(1,8): 56.53, p < 0.0001; INS main effect: F(1,28): 40.52, p < 0.001; Knockdown/INS interaction: F(1,28): 40.84, p < 0.001]; Gkrp: F(3,28): 11.19, p < 0.001; Knockdown main effect: F(1,28): 13.58, p = 0.001; INS main effect: F(1,28): 13.78, p = 0.001; Knockdown/INS interaction: F(1,28): 5.99, p = 0.021]; AMPKα1/Prkaa1: F(3,28): 145.46, p < 0.001, Knockdown main effect: F(1,28): 123.46, p < 0.0001; INS main effect: F(1,28): 143.73, p < 0.00; Knockdown/INS interaction: F(1,28): 169.21, p < 0.001]; AMPKα2/Prkaa2: F(3,28): 84.67, p < 0.001; Knockdown main effect: F(1,28): 71.92; p < 0.0001; INS main effect: F(1,28): 32.30; p < 0.001; Knockdown/INS interaction: F(1,28): 149.78; p < 0.001]. *p < 0.05; **p < 0.01; and ***p < 0.001.](/cms/asset/6111085c-70e9-436a-b09b-34d64542b98c/tasn_a_12426813_f0003.jpg)
depicts the effects of Dbi siRNA pretreatment on target gene expression in VMNvl nitrergic nerve cells collected from eu- or hypoglycemic rats. Data in show that euglycemic patterns of nNOS mRNA expression were unaffected by Dbi gene silencing, but hypoglycemic up-regulation of this gene profile was significantly amplified by Dbi siRNA pretreatment. Baseline VMNvl NO neuron Gck and Gkrp gene transcript levels were each increased by Dbi gene silencing. Hypoglycemia elevated each of these mRNA profiles, albeit to a lesser extent than Dbi knockdown; both stimulatory responses were exacerbated by Dbi siRNA pretreatment. Euglycemic VMNvl nitrergic nerve cell AMPKα1/Prkaa1 gene profiles were enhanced by Dbi siRNA, whereas AMPKα2/Prkaa2 mRNA levels were unaffected by that treatment. Similarly, AMPKα1/Prkaa1 and AMPKα2/Prkaa2 gene transcripts were, respectively, up-regulated or refractory to IIH. Dbi siRNA pretreatment reversed the AMPKα1/Prkaa1 stimulatory response to hypoglycemia, but elevated PRKAA2 gene expression.
Figure 4 Effects of Dbi Gene Silencing on Eu- or Hypoglycemic Neurotransmitter and Metabolic Sensor Marker Gene Expression Patterns in VMNvl Nitrergic Neurons. Groups (n = 4/group) of Dbi or SCR siRNA-pretreated, V- or INS-injected male rats were sacrificed one hour after sc injection. Individual VMNdm neuronal nitric oxide synthase (nNOS/NOS1)-immunopositive neurons were laser-catapult-microdissected from 10 micron-thick fresh frozen sections for multiplex single-cell qPCR analyses. Data depict mean normalized nNOS/NOS1 (), Gck (), Gkrp (), AMPKα1/Prkaa1 (), or AMPKα2/Prkaa2 () mRNA measures ± S.E.M. for SCR siRNA/V (n = 8), Dbi siRNA/V (n = 8), SCR siRNA/INS (n = 8), Dbi siRNA/INS (n = 8) treatment groups. Outcomes of statistical analyses are as follows: nNOS: F(3,28): 365.90, p < 0.001; Knockdown main effect: F(1,28): 337.27, p < 0.0001; INS main effect: F(1,28): 483.78; p < 0.001; Knockdown/INS interaction: F(1,28): 276.65; p < 0.001; Gck: F(3,28): 328.81, p < 0.001; Knockdown main effect: F(1,28): 822.64, p < 0.0001; INS main effect: F(1,28): 7.36, p = 0.011; Knockdown/INS interaction: F(1,28): 156.42, p < 0.001; Gkrp: F(3,28): 93.08, p < 0.001; Knockdown main effect: F(1,28): 173.19, p < 0.001; INS main effect: F(1,28): 92.90, p < 0.001; Knockdown/INS interaction: F(1,28): 13.14, p = 0.001; AMPKα1/Prkaa1: F(3,28): 122.73, p < 0.001; Knockdown main effect: F(1,28): 24.09, p < 0.0001; INS main effect: F(1,28): 218.50, p < 0.001; Knockdown/INS interaction: F(1,28): 125.60, p < 0.001; AMPKα2/Prkaa2: F(3,28): 160.07, p < 0.001, Knockdown main effect: F(1,28): 168.68, p < 0.0001; INS main effect: F(1,28): 121.08, p < 0.001; Knockdown/INS interaction: F(1,28): 190.44, p < 0.001. Statistical differences between discrete pairs of treatment groups are denoted as follows: *p < 0.05; **p < 0.01; and ***p < 0.001.
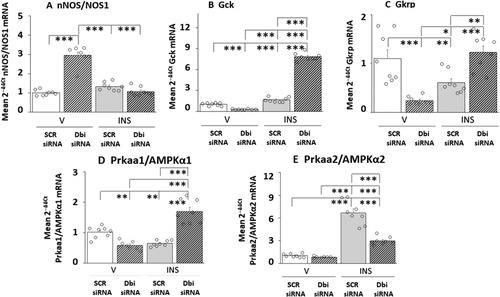
depicts the patterns of VMNdm nitrergic neuron transmitter marker and metabolic sensor gene expression in SCR versus Dbi siRNA-pretreated, V- or INS-injected rats. In contrast to the VMNvl, VMNdm nitrergic neurons exhibited up-regulated baseline nNOS mRNA in response to Dbi gene silencing, and no change in this gene profile after INS injection. Dbi siRNA reduced basal Gck and Gkrp gene expression in these cells, as opposed to augmentation of these profiles in the VMNvl. IIH caused dissimilar changes in these gene profiles, as Gck and Gkrp were, respectively, up- or down-regulated; Dbi siRNA pretreatment amplified the former stimulatory response and reversed the latter inhibitory reaction. Euglycemic patterns of VMNdm NO neuron Prkaa1 () mRNA expression was inhibited by Dbi gene knockdown, whereas Prkaa2 transcript profiles were insensitive to this treatment. Hypoglycemia caused opposite adjustments in these gene profiles, as Prkaa1 and Prkaa2 mRNAs were down- or up-regulated, respectively. These dissimilar responses were each reversed by Dbi siRNA.
Figure 5 Eu- versus Hypoglycemic Neurotransmitter and Metabolic Sensor Marker Gene Expression Patterns in VMNdm Nitrergic Neurons: Effects of Dbi Gene Knockdown. Experimental design, treatment group designations, target gene profiles, analytical and statistical methods, and data presentation format are identical to that described in above, except that nNOS-immunopositive neurons were laser-catapult-microdissected from the VMNdm. Outcomes of statistical analyses are as follows: nNOS: F(3,28): 78.52, p < 0.001; Knockdown main effect: F(1,28): 65.83, p < 0.0001; INS main effect: F(1,28): 526.22, p < 0,001; Knockdown/INS interaction: F(1,28): 113.52, p < 0.001; Gck: F(3,28): 859.64, p < 0.001; Knockdown main effect: F(1,28): 531.39, p < 0.0001; INS main effect: F(1,28): 1197.25, p < 0.001; Knockdown/INS interaction: F(1,28): 850.27, p < 0.001; Gkrp: F(3,28): 14.82, p < 0.001; Knockdown main effect: F(1,28): 1.04, p = 0.317; INS main effect: F(1,28):4.44, p = 0.044; Knockdown/INS interaction: F(1,28): 38.99, p < 0.001; AMPKα1/Prkaa1: F(3,28): 39.14, p < 0.001; Knockdown main effect: F(1,28): 14.03, p = 0.001; INS main effect: F(1,28): 20.78, p < 0,001; Knockdown/INS interaction: F(1,28): 82.60, p < 0.001; AMPKα2/Prkaa2: F(3,28): 88.86, p < 0.001; Knockdown main effect: F(1,28): 46.27, p < 0.0001; INS main effect: F(1,28): 183.48, p < 0.001; Knockdown/INS interaction: F(1,28): 36.81, p < 0.001. *p < 0.05, **p < 0.01, and ***p < 0.001.
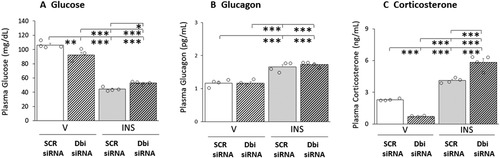
depicts the effects of Dbi siRNA administration to the VMN on circulating glucose and counterregulatory hormone concentrations. As seen in , plasma glucose levels were decreased by Dbi gene silencing, yet glycemic profiles in INS-injected rats did not differ between SCR siRNA/INS and Dbi siRNA/INS groups. Mean glucagon secretion patterns () in V- or INS-injected rats were unaffected by Dbi siRNA pretreatment. Baseline patterns of corticosterone release () were significantly lower following Dbi versus SCR siRNA administration. Hypoglycemia-associated augmentation of circulating corticosterone levels was exacerbated by Dbi siRNA pretreatment.
Figure 6 Effects of VMN Dbi Gene Silencing on Plasma Glucose and CounterRegulatory Hormone Profiles in Eu- or Hypoglycemic Male Rats. Plasma samples were obtained from groups of Dbi or SCR siRNA-pretreated male rats one hour after sc injection of V or INS, and analyzed for glucose (), glucagon (), or corticosterone () concentrations. In each panel, individual treatment group data depict mean concentrations ± S.E.M. for n = 4 samples. Data were analyzed by two-way ANOVA and Student–Newman–Keuls post-hoc test, using GraphPad Prism, Vol. 8 software. Results of statistical analyses are as follows: glucose: F(3,12): 170.27, p < 0.001; Knockdown main effect: F(1,8): 1.18, p = 0.299; INS main effect: F(1,12): 485.76, p < 0.001; Knockdown/INS interaction: F(1,12): 23.87, p < 0.001; glucagon: F(3,12): 34.66, p < 0.001; Knockdown main effect: F(1,8): 0.51, p = 0.489; INS main effect: F(1,12): 102.85, p < 0.001; Knockdown/INS interaction: F(1,12): 0.61, p = 0.450; corticosterone: F(3,12): 147.23, p < 0.001; Knockdown main effect: F(1,12): 0.19, p = 0.671; INS main effect: F(1,12): 359.18, p < 0.001; Knockdown/INS interaction: F(1,12): 82.33, p < 0.001. *p < 0.05, **p < 0.01, and ***p < 0.001.
Discussion
Recent pharmacological studies document VMN counterregulatory transmitter sensitivity to the astrocyte endozepine transmitter ODN (CitationBriski et al., 2023). Here, combinatory high-resolution microdissection/single-cell multiplex qPCR and QTRAP CESI-MS/MS methods were used to address the premise that pathophysiological perturbance of glucose homeostasis affects levels of the precursor protein Dbi and its cleavage product ODN in the VMN and that genetic manipulation of these protein profiles during eu- or hypoglycemia alters GABAergic and/or nitrergic neuron transmitter and metabolic sensor gene expression in distinct neuroanatomical divisions of the VMN. Results show that hypoglycemic causes dissimilar changes in tissue Dbi and ODN in the VMNvl versus VMNdm. Data suggest that Dbi/ODN signaling may stimulate basal GABA production in each VMN division, yet may be required for hypoglycemic down-regulation of VMNvl GABA transmission. This glucose status-dependent switch in the direction of Dbi/ODN control of VMNvl GABA output correlates with differential regulation of glucose and energy sensor marker gene expression in this cell population during eu- versus hypoglycemia. Data infer that Dbi/ODN may act by Gck- and/or AMPK-dependent mechanisms to promote basal VMNdm NO transmission and limit the hypoglycemic output of this neurochemical into the VMNvl. Importantly, outcomes show that Dbi/ODN input to VMN circuitries governs eu- and hypoglycemic patterns of counterregulatory hormone secretion. Additional effort will be required to determine if Dbi/ODN-sensitive counterregulatory transmitter neuron populations identified here are involved in that control.
There is a rich, prolific literature that exists to detail the history of research devoted to knowledge of the physiological traits of endozepine gliotransmission regarding brain function (CitationAlho et al., 1985; CitationAlquier et al., 2021; CitationBouyakdan et al., 2019; CitationFerrero et al., 1986; CitationGuidotti et al., 1983; CitationLanfray et al., 2013; CitationLebrun et al., 2020; CitationPedro et al., 2019; CitationTonon et al., 2020). Recent pharmacological studies expand upon this foundation with evidence to support ODN involvement in neural control of glucose homeostasis (CitationBriski et al., 2023; CitationLanfray et al., 2013), and, moreover, verification that ODN may affect brain glucose-regulatory network function by action on substrates within the VMN (CitationBriski et al., 2023), a principal component of the brain glucose-regulatory network (CitationWatts & Donovan, 2010). The VMN and other brain nuclei exhibit cyto-architectural diversity within their boundaries; hence, the need for analytical methods of requisite sensitivity for discriminative analysis of endogenous and exogenous molecules of interest within specific nuclear subdivisions. The current research sought to develop QTRAP CESI-MS/MS protocols for individual quantification of DBI and ODN in small-volume brain tissue samples as a complementary technology to pharmacologic approaches that are popular for investigation of ODN control of brain function, with the goal to introduce new capabilities to quantify potential changes in tissue endozepine levels in neuroanatomical sites of potential action. A corollary objective was to demonstrate the compatibility of this novel analytical method with high-neuroanatomical resolution microdissection tools. The current research represents an important advance in the utilization of in vivo gene knockdown technology and high-resolution tissue- and cellular-level dissection tools to investigate the premise that VMN Dbi/ODN signaling is responsive to systemic glucoprivation, i.e., IIH, and, in turn, exerts control of VMN GABAergic and/or nitrergic metabolic-sensory function and neurotransmission during that nutrient imbalance.
The current research was devised to acquire proof-of-principle that capillary zone electrophoresis-mass spectrometric methods are applicable for independent quantification of ODN and its parent molecule Dbi in small-volume brain rat tissue samples. Novel analytical technology developed here was consequently implemented to determine if IIH alters levels of one or both peptides in distinct neuroanatomical divisions of the VMN. Lastly, siRNA gene knockdown tools were used to examine whether genetic manipulation of tissue ODN levels during eu- or hypoglycemia affects functional parameters of VMN glucose-regulatory neurons previously characterized by responsiveness to ODN pharmacological drugs. The considerable volume of work associated with the tasks described above was a critical factor in our decision to use here only one sex as experimental subjects. The analytical tools described herein will facilitate future research aimed at investigating molecular mechanisms of endozepine regulation of VMN regulation of systemic glucostasis in each sex.
VMN Dbi gene knockdown caused dissimilar changes in basal Dbi protein in the VMNvl (decreased) versus VMNdm (unchanged). In the former site, Dbi transcript and gene product profiles may undergo parallel repression in response to siRNA treatment, whereas stabilization of VMNdm Dbi protein levels may reflect compensatory augmentation of Dbi translation in that division despite transcript reductions. IIH elicited opposite adjustments on VMNvl (inhibitory) versus VMNdm (stimulatory) tissue Dbi protein; current work does not address the molecular mechanisms that shape these contrary responses. Yet, Dbi siRNA pretreatment reversed these division-specific Dbi protein responses to hypoglycemia. It can be theorized that up-regulated VMNvl Dbi levels may reflect stimulated protein translation (and/or decreased processing to ODN, as discussed below) owing to possible exacerbation of hypoglycemia-associated decrements in Dbi mRNA. Meanwhile, knockdown-induced attenuation of hypoglycemic stimulation of VMNdm Dbi protein may indicate that blunting of increased mRNA levels in that location may promote a corresponding reduction in Dbi protein (and/or increased processing to yield ODN, discussed below).
Baseline VMNvl Dbi and ODN protein profiles were each decreased after Dbi gene silencing. These proteins exhibited dissimilar responses to IIH, namely Dbi suppression versus ODN amplification, which infers that systemic glucoprivation is a likely potent stimulus for Dbi cleavage to ODN. Dbi knockdown attenuated hypoglycemic stimulation of VNvl ODN content; thus, repression of local Dbi gene transcription during IIH may diminish Dbi processing to ODN. Meanwhile, VMNdm Dbi and ODN proteins exhibited dissimilar responses to Dbi gene knockdown, as Dbi levels were unaffected, whereas ODN levels declined. Thus, treatment-induced suppression of local Dbi mRNA levels may cause adaptive augmentation of Dbi protein production, while limiting conversion of this molecule to ODN. Evidence that VMNdm Dbi and ODN profiles were, respectively, up- or down-regulated during IIH implies that Dbi cleavage to yield ODN may be inhibited in that site by glucoprivation. Dbi siRNA pretreatment blunted these opposite responses to IIH, suggesting that down-regulation of local Dbi mRNA content may inhibit Dbi protein expression and/or exacerbate the processing of this molecule to ODN. Results support the novel concept that the Dbi-to-ODN conversion in the VMNvl and VMNdm may be governed by the glucose status and that hypoglycemia may promote or repress Dbi cleavage according to division. Data also raise the distinctive notion that the relative magnitude of Dbi mRNA expression, which evidently varies between the VMNvl and VMNdm, may determine whether siRNA-mediated decrements in this transcript profile stimulate or inhibit processing to ODN.
Dbi gene silencing down-regulated GABAergic neuron Gad1 and Gad2 mRNA profiles in each VMN division. As this inhibitory response occurred alongside decreased tissue ODN content, ODN signaling may likely be a positive stimulus for GABA transmission in each division under euglycemic conditions. This assumption will require experimental validation that Dbi per se does not regulate the expression of either GAD transcript via CBR action. Interestingly, in the VMNvl, hypoglycemia elicits a directional shift in this control, e.g., from positive to negative as Dbi siRNA reversed IIH-associated suppression of both GAD mRNAs in GABA nerve cells in that division. The molecular mechanism(s) that mediates this switch in ODN action remains unclear. Hypoglycemia-associated elevations in the VMNvl tissue ODN content, resulting in increased signal volume, may be partly responsible. While potential hypoglycemia effects on VMNvl GABAergic neuron CBR expression and/or signal transduction can be addressed by future research, the role of the ODN-G protein-coupled receptor (GPCR) in bi-directional ODN governance of GABA signaling will remain unresolved until structural characterization of this molecule is accomplished. In the VMNdm, hypoglycemia promotes a loss of ODN regulation of GABA neuron Gad1 and Gad2 mRNA expression, as down-regulated transcript profiles are refractory to Dbi siRNA. This outcome that could reflect, in part, reductions in ODN tissue levels, documented here, and associated decline in signal volume, as well as diminution of GABA nerve cell receptivity, involving decreased CBR and/or ODN-GPCR expression and adjustments in signal transduction by one or both receptors.
Dbi/ODN signaling may likely exert VMN division-specific control of GABAergic neuron Gck function as Dbi gene knockdown down-regulated (VMNvl) or did not affect (VMNdm) this transcript profile. This genetic manipulation also had disparate effects on mRNAs encoding the AMPK alpha catalytic subunits Prkaa1 and Prkaa2, as both transcripts were amplified in the VMNdm GABAergic neurons, whereas the latter transcript was decreased in cells from the VMNvl. Thus, the possibility emerges that Dbi/ODN signaling may cause dissimilar AMPK-mediated target protein phosphorylation in these GABA nerve cell subpopulations. It remains to be determined if, in one or both divisions, Dbi/ODN regulatory effects on glucose and/or energy sensory function elicit changes in GABA signaling. GABAergic nerve cell Gck transcript profiles were sensitive (VMNvl) or insensitive (VMNdm) to hypoglycemia, depending upon VMN division. Dbi siRNA-mediated reversal of IIH-associated down-regulation of VMNvl Gck reflects glucose-dependent, bi-directional Dbi/ODN control of VMNvl GABA neuron glucose monitoring, similar to the regulation of Gad1 and −2 transcripts in this site. Evidence for Dbi/ODN-dependent hypoglycemic up- and down-regulation of Prkaa1 and Prkaa2, respectively, in VMNvl GABAergic neurons implies that this signal may enhance and diminish target protein phosphorylation by these enzyme isoforms during IIH, while concurrently amplifying activation of VMNdm PRKAA2 targets.
Baseline nitrergic nerve cell nNOS gene expression is either sensitive (VMNdm) or insensitive (VMNvl) to Dbi/ODN control. Up-regulating effects of Dbi gene silencing on Gck and Prkaa1 gene expression in VMNvl nitrergic neurons suggest that basal NO release is unaffected by Dbi/ODN-sensitive glucose and energy sensing functions in those cells. Yet, parallel regulatory effects of Dbi siRNA on VMNdm nitrergic nerve cell Gck, Prkaa1, and nNOS mRNA profiles support the possibility that, in that location, these gene responses may be causally linked. Hypoglycemia promotes a gain of Dbi/ODN control of nNOS gene expression in VMNvl nitrergic neurons, as this input is required for the stimulatory nNOS mRNA response to IIH. Further work will be needed to determine if this acquired governance reflects, in part, increased ODN signal strength due to augmented tissue ODN levels, as well as enhanced CBR or ODN-GPCR expression and/or amplified post-receptor signal transduction. Dbi/ODN-dependent patterns of Gck and Prkaa1 gene transcription in VMNvl nitrergic neurons during hypoglycemia suggest that one or both sensors may mediate hypoglycemic up-regulation of NO release in this site. Interestingly, VMNvl nitrergic and GABAergic neurons exhibit Dbi/ODN-mediated up- or down-regulated Gck gene expression, respectively, which coincides with likely enhanced glucose-stimulatory NO and decreased glucose-inhibitory GABA transmission. Additional effort is warranted to determine if Gck functions downstream of ODN input to each cell type to control hypoglycemic neurotransmission patterns. Data show that VMNdm nitrergic neuron nNOS mRNA levels were unaffected by hypoglycemia and insensitive to Dbi gene knockdown, despite hypoglycemic augmentation of Gck and dissimilar regulation of Prkaa1 (inhibitory) and Prkaa2 (stimulatory) gene transcript expression by Dbi/ODN-dependent mechanisms. Further research is warranted to investigate whether Dbi/ODN signaling may cause dissimilar AMPK-mediated target protein phosphorylation in these nitrergic nerve cell subpopulations. In this NO nerve cell group, hypoglycemia may dissociate NO neurotransmission from control by metabolic-sensory function, by possibly decreasing ODN signal strength. It is of interest to note that, unlike the VMNvl, in VMNdm nitrergic and GABAergic neurons, ODN regulates either Gck or transmitter marker gene expression during hypoglycemia, not both transcript profiles.
Plasma glucose levels were significantly lowered by Dbi/ODN knockdown, suggesting that collective Dbi/ODN action within the VMN may diminish counter-regulation and/or increase glucose uptake and utilization. Results document VMN Dbi/ODN signaling does not affect systemic glucagon secretion but does provide critical input to neural pathways that regulate baseline and hypoglycemic patterns of corticosterone secretion. This control is evidently bi-directional, as Dbi gene silencing suppressed basal hormone levels, yet amplified hypoglycemic hypercorticosteronemia, outcomes that disclose a shift in the direction of control from stimulatory (euglycemic) to inhibitory (hypoglycemia). While current data document coincident effects of Dbi gene knockdown on VMN neurotransmitter marker gene expression and counterregulatory hormone profiles, it should be kept in mind that further work is required to establish whether those neurochemicals mediate ODN regulatory effects on hormone endpoints.
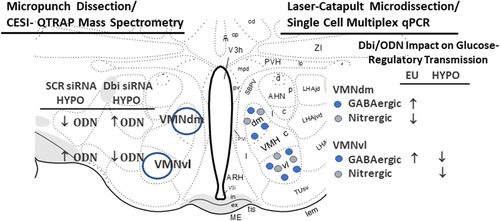
In summary, current studies highlight the utility of high-performance QTRAP CESI-MS/MS technology for quantification of the astrocyte endozepine peptides Dbi and ODN in brain tissue samples acquired by high-specificity microdissection (). Outcomes verify the presence of Dbi and its bioactive fragment ODN in major structural subdivisions of the VMN, while illustrating distinctive effects of hypoglycemia on these protein profiles in each location. Information gained from stereotactic in vivo gene silencing identifies populations of GABAergic and nitrergic neurons in the VMN that exhibit Dbi/ODN signal-dependent patterns of transmitter and/or metabolic-sensory marker gene expression during glucose homeostasis or dyshomeostasis.
Figure 7 Summary of Outcomes of CESI-QTRAP MS/MS and Single Cell Multiplex qPCR Analysis Analyses of VMN tissue or Laser-Catapult-Microdissected Glucose-Regulatory Neurons. The left side of the cartoon illustrates the effects of Dbi gene knockdown on VMNdm versus the VMNvl ODN tissue content during insulin-induced hypoglycemia (HYPO). The right side depicts the effects of Dbi/ODN signaling on euglycemic (EU) versus HYPO patterns of transmitter marker gene expression in GABAergic or nitrergic neurons laser-microdissected from the VMNdm or VMNvl.
Abbreviations
| AMPKα1 | = | 5’-AMP-activated protein kinase-alpha 1 |
| AMPKα2 | = | 5’-AMP-activated protein kinase-alpha 2 |
| CBR | = | central benzodiazepine receptor |
| cDNA | = | complementary DNA |
| Dbi | = | diazepam binding inhibitor |
| GABA | = | γ-aminobutyric acid |
| Gad1/Gad67 | = | glutamine decarboxylase (GAD)67 |
| Gad2/Gad65 | = | GAD65 |
| Gck | = | glucokinase |
| Gkrp | = | glucokinase regulatory protein |
| GPCR | = | G-protein-coupled receptor |
| IIH | = | insulin-induced hypoglycemia |
| INS | = | insulin |
| LV-1075 | = | cyclo(1−8)[DLeu5]OP |
| nNOS/NOS1 | = | neuronal nitric oxide synthase |
| NO | = | nitric oxide |
| ODN | = | octadecaneuropeptide |
| OP | = | isoactive surrogate ODN11−18 |
| Prkaa1 | = | protein kinase AMP-activated catalytic submit alpha 1: rat homolog |
| Prkaa2 | = | protein kinase AMP-activated catalytic submit alpha 2: rat homolog |
| qPCR | = | quantitative reverse-transcription polymerase chain reaction |
| QTRAP CESI-MS/MS | = | capillary zone electrophoresis-electrospray ionization-triple quadrupole linear ion trap mass spectrometry |
| RT-PCR | = | reverse transcription-polymerase chain reaction |
| SCR | = | scramble/control siRNA |
| Sc | = | subcutaneous |
| siRNA | = | short-interfering RNA |
| V | = | vehicle |
| VMN | = | ventromedial hypothalamic nucleus |
| VMNdm | = | VMN dorsomedial division |
| VMNvl | = | VMN ventrolateral division |
Author Contribution Statement
Sagor C. Roy: conceptualization, investigation, formal analysis, validation, data curation, visualization, writing—original draft, writing—review and editing, and visualization; Subash Sapkota: investigation, formal analysis, validation, and data curation; Madhu Babu Pasula: investigation, formal analysis, validation, and data curation; Khaggeswar Bheemanapally: investigation, formal analysis, validation, and data curation; Karen P. Briski: conceptualization, writing—original draft, writing—review and editing, supervision, project administration, and funding acquisition.
Submission Declaration
The authors declare that this work has not been published previously, nor is it under consideration for publication elsewhere at this time. The manuscript has been read by all authors and is authorized by them for submission. The authors agree that if accepted for publication, this work will not be published in the same form elsewhere in the absence of written copyright-holder consent.
Declaration of Animal Use
All animal protocols and procedures were performed in accord with the National Institutes of Health Guide for the Care and Use of Laboratory Animals, 8th Edition, as stated in the manuscript. The sex of animals used in this work is described, as is a discussion of potential sex effects on study outcomes.
Declaration of Conflicting Interests
The authors declared no potential conflicts of interest with respect to the research, authorship, and/or publication of this article.
Ethical Statement
All animal protocols and procedures were performed in accord with the National Institutes of Health Guide for the Care and Use of Laboratory Animals, 8th Edition, as stated in the manuscript. The sex of animals used in this work is described, as is a discussion of potential sex effects on study outcomes.
ORCID iD
Karen P. Briski https://orcid.org/0000-0002-7648-1395
sj-tif-1-asn-10.1177_17590914231214116 - Supplemental material for Diazepam Binding Inhibitor Control of Eu- and Hypoglycemic Patterns of Ventromedial Hypothalamic Nucleus Glucose-Regulatory Signaling
Download TIFF Image (185.4 KB)Acknowledgments
Not Applicable
Supplemental Material
Data Availability
The data that support the findings of this study are available from the corresponding author upon reasonable request.
Funding
The author(s) disclosed receipt of the following financial support for the research, authorship, and/or publication of this article: This work was supported by the U.S. National Institutes of Health award. (National Institute of Diabetes and Digestive and Kidney Diseases, grant number DK 109382).
Supplemental material
Supplemental material for this article is available online.
References
- Agius L. (2008). Glucokinase and molecular aspects of liver glycogen metabolism. Biochem J, 414(1), 1–18. https://doi.org/10.1042/BJ20080595
- Agius L. (2016). Hormonal and metabolite regulation of hepatic glucokinase. Annu. Rev. Nutr, 36, 389–415. https://doi.org/10.1146/annurev-nutr-071715-051145
- Alenazi F. S. H., Ibrahim B. A., Briski K. P. (2014). Estradiol regulates effects of hindbrain activator 5-aminoimidazole-4-carboxamide-riboside administration on hypothalamic adenosine 5’-monophosphate-activated protein kinase activity and metabolic neurotransmitter mRNA and protein expression. J. Neurosci. Res, 93(4), 651–659. https://doi.org/10.1002/jnr.23520
- Alho H., Costa E., Ferrero P., Fujimoto M., Cosenza-Murphy D., Guidotti A. (1985). Diazepam-binding inhibitor: A neuropeptide located in selected neuronal populations of rat brain. Science, 229(4709), 179–182. https://doi.org/10.1126/science.3892688
- Ali M. H., Alshamrani A. A., Briski K. P. (2022). Hindbrain lactate regulation of hypoglycemia-associated patterns of catecholamine and metabolic-sensory biomarker gene expression in A2 noradrenergic neurons innervating the ventromedial hypothalamic nucleus in male versus female rat. J. Chem. Neuroanat. https://doi.org/10.1016/j.jchemneu.2022.102102
- Ali M. H., Alshamrani A. A., Napit P. R., Briski K. P. (2022). Single-cell multiplex qPCR evidence for sex-dimorphic glutamate decarboxylase, estrogen receptor, and 5’-AMP-activated protein kinase alpha subunit mRNA expression by ventromedial hypothalamic nucleus GABAergic neurons. J. Chem. Neuroanat, 27, 102132.
- Alquier T., Christian-Hinman C. A., Alfonso J., Færgeman N. J. (2021). From benzodiazepines to fatty acids and beyond: Revisiting the role of ACBP/DBI. Trends Endocrinol Metab, 32, 890–903. https://doi.org/10.1016/j.tem.2021.08.009
- Alshamrani A. A., Ibrahim M. M. H., Briski K. P. (2022). Effects of short-term food deprivation on catecholamine and metabolic-sensory biomarker gene expression in hindbrain A2 noradrenergic neurons projecting to the forebrain rostral preoptic area: Impact of negative versus positive estradiol feedback. IBRO Neurosci. Rep, 13, 38–46. https://doi.org/10.1016/j.ibneur.2022.06.001
- Bheemanapally K., Alhamyani A. R., Ibrahim M. M. H., Briski K. P. (2021). Ventromedial hypothalamic nucleus glycogen phosphorylase regulation of metabolic-sensory neuron AMPK and neurotransmitter protein expression: Role of L-lactate. Amer. J. Physiol. Regul. Integr. Comp. Physiol, 320(6), R791–R799. https://doi.org/10.1152/ajpregu.00292.2020
- Bheemanapally K., Ibrahim M. M. H., Briski K. P. ( 2020). Combinatory high-resolution microdissection/ultra-performance liquid chromatographic-mass spectrometry approach for small tissue volume analysis of rat brain glycogen. J. Pharmaceut. Biomed. Anal, 178(January), 112884. https://doi.org/10.1016/j.jpba.2019.112884
- Bouyakdan K., Martin H., Liénard F., Budry L., Taib B., Rodaros D., Chrétien C., Biron É, Husson Z., Cota D., Pénicaud L., Fulton S., Fioramonti X., Alquier T. (2019). The gliotransmitter ACBP controls feeding and energy homeostasis via the melanocortin system. J. Clin. Invest, 129(6), 2417–2430. https://doi.org/10.1172/JCI123454
- Briski K. P., Mandal S. K., Bheemanapally K., Ibrahim M. M. H. (2020). Effects of acute versus recurrent insulin-induced hypoglycemia on ventromedial hypothalamic nucleus metabolic-sensory neuron AMPK activity: Impact of alpha1-adrenergic receptor signaling. Brain Res. Bull, 157, 41–50. https://doi.org/10.1016/j.brainresbull.2020.01.013
- Briski K. P., Napit P. R., Alhamyani A. R., LePrince J. R., Mahmood A. S. M. H. (2023). Sex-dimorphic octadecaneuropeptide (ODN) regulation of ventromedial hypothalamic nucleus metabolic-sensory neuron 5’AMP-activated protein kinase activity, transmitter signaling and counter-regulatory hormone secretion in rat. ASN Neuro, 15, 17590914231167230. https://doi.org/10.1177/17590914231167230
- Chan O., Sherwin R. (2013). Influence of VMH fuel sensing on hypoglycemic responses. Trends Endocrinol. Metab, 24(12), 616–624. https://doi.org/10.1016/j.tem.2013.08.005
- Chan O., Zhu W., Ding Y., McCrimmon R. J., Sherwin R. S. (2006). Blockade of GABA(A) receptors in the ventromedial hypothalamus further stimulates glucagon and sympathoadrenal but not the hypothalamo-pituitary-adrenal response to hypoglycemia. Diabetes, 55(4), 1080–1087. https://doi.org/10.2337/diabetes.55.04.06.db05-0958
- Ferrero P., Santi M. R., Conti-Tronconi B., Costa E., Guidotti A. (1986). Study of an octadecaneuropeptide derived from diazepam binding inhibitor (DBI): Biological activity and presence in rat brain. Proc. Natl. Acad. Sci, 83(3), 827–831. https://doi.org/10.1073/pnas.83.3.827
- Fioramonti X., Marsollier N., Song Z., Fakira K. A., Patel R. M., Brown S., Duparc T., Pica-Mendez A., Sanders N. M., Knauf C., Valet P., McCrimmon R. J., Beuve A., Magnan C., Routh V. H. (2010). Ventromedial hypothalamic nitric oxide production is necessary for hypoglycemia detection and counterregulation. Diabetes, 59(2), 519–528. https://doi.org/10.2337/db09-0421
- Guidotti A., Forchetti C. M., Corda M. G., Konkel D., Bennett C. D., Costa E. (1983). Isolation, characterization, and purification to homogeneity of an endogenous polypeptide with agonistic action on benzodiazepine receptors. Proc. Natl. Acad. Sci, 80(11), 3531–3535. https://doi.org/10.1073/pnas.80.11.3531
- Gujar A. D., Ibrahim B. A., Tamrakar P., Koshy Cherian A., Briski K. P. (2014). Hindbrain lactostasis regulates hypothalamic AMPK activity and hypothalamic metabolic neurotransmitter mRNA and protein responses to hypoglycemia. Amer. J. Physiol. Regul. Integ. Comp. Physiol, 306(7), R457–R469. https://doi.org/10.1152/ajpregu.00151.2013
- Han S. M., Namkoong C., Jang P. G., Park I. S., Hong S. W., Katakami H., Chun S., Kim S. W., Park J. Y., Lee K. U., Kim M. S. (2005). Hypothalamic AMP-activated protein kinase mediates counter-regulatory responses to hypoglycaemia in rats. Diabetologia, 48(10), 2170–2178. https://doi.org/10.1007/s00125-005-1913-1
- Hardie D. G., Lin S. C. (2017). AMP-activated protein kinase – not just an energy sensor. F1000R, 6, 1724. https://doi.org/10.12688/f1000research.11960.1
- Hardie D. G., Ross F. A., Hawley S. A. (2012). AMPK: A nutrient and energy sensor that maintains energy homeostasis. Nat. Rev. Mol. Cell Biol, 13(4), 251–262. https://doi.org/10.1038/nrm3311
- Hardie D. G., Schaffer B. E., Brunet A. (2016). AMPK: An energy-sensing pathway with multiple inputs and outputs. Trends in Cell Biology, 26(3), 190–201. https://doi.org/10.1016/j.tcb.2015.10.013
- Ibrahim M. M. H., Bheemanapally K., Alhamami H. N., Briski K. P. (2020). Effects of intracerebroventricular glycogen phosphorylase inhibitor CP-316,819 infusion on hypothalamic glycogen content and metabolic neuron AMPK activity and neurotransmitter expression in the male rat. J. Mol. Neurosci, 70, 647–658. https://doi.org/10.1007/s12031-019-01471-0
- Lanfray D., Arthaud S., Ouellet J., Compère V., Do Rego J. L., Leprince J., Lefranc B., Castel H., Bouchard C., Monge-Roffarello B., Richard D., Pelletier G., Vaudry H., Tonon M. C., Morin F. (2013). Gliotransmission and brain glucose sensing: Critical role of endozepines. Diabetes, 62(3), 801–810. https://doi.org/10.2337/db11-0785
- Lebrun B., Barbot M., Tonon M. C., Prévot V., Leprince J., Troadec J. D. (2020). Glial endozepines and energy balance: Old peptides with new tricks. Glia. (5). https://doi.org/10.1002/glia.23927. PMID: 33105065.
- Livak K. J., Schmittgen T. D. (2001). Analysis of relative gene expression data using real-time quantitative PCR and the 2−Delta Delta C(t) method. Methods, 25(4), 402–408. https://doi.org/10.1006/meth.2001.1262
- López M. (2018). Hypothalamic AMPK and energy balance. Eur J Clin Invest, 48(9), e12996. https://doi.org/10.1111/eci.12996
- Malagon M., Vaudry H., Van Strien F., Pelletier G., Gracia-Navarro F., Tonon M. C. (1993). Ontogeny of diazepam-binding inhibitor-related peptides (endozepines) in the rat brain. Neuroscience, 57, 777–786. https://doi.org/10.1016/0306-4522(93)90023-9
- Matschinsky F. M., Wilson D. F. (2019). The central role of glucokinase in glucose homeostasis; a perspective 50 years after demonstrating the presence of the enzyme in islets of Langerhans. Front Physiol. March). https://doi.org/10.3389/fphys.2019.00148
- McCrimmon R. J., Shaw M., Fan X., Cheng H., Ding Y., Vella M. C., Zhou L., McNay E. C., Sherwin R. S. (2008). Key role for AMP-activated protein kinase in the ventromedial hypothalamus in regulating counterregulatory hormone responses to acute hypoglycemia. Diabetes, 57(2), 444–450. https://doi.org/10.2337/db07-0837
- Montégut L., Lopez-Otin C., Magnan C., Kroemer G. (2021). Old paradoxes and new opportunities for appetite control in obesity. Trends Endocrinol Metab, 32(5), 264–294. https://doi.org/10.1016/j.tem.2021.02.005
- Napit P. R., Ali M. H., Shakya M., Bheemanapally K., Mahmood A. S. M. H., Ibrahim M. M. H., Briski K. P. (2019). Hindbrain estrogen receptor regulation of counter-regulatory hormone secretion and ventromedial hypothalamic nucleus glycogen content and glucoregulatory transmitter signaling in hypoglycemic female rats. Neuroscience, 411(July), 211–221. https://doi.org/10.1016/j.neuroscience.2019.05.007
- Pedro J. M. B., Sica V., Madeo F., Kroemer G. (2019). Acyl-CoA-binding protein (ACBP): The elusive ‘hunger factor’ linking autophagy to food intake. Cell Stress, 3(10), 312–318. https://doi.org/10.15698/cst2019.10.200
- Pimentel G. D., Ropelle E. R., Rocha G. Z., Carvalheira J. B. C. (2013). The role of neuronal AMPK as a mediator of nutritional regulation of food intake and energy homeostasis. Metabolism, 62, 171–178. https://doi.org/10.1016/j.metabol.2012.07.001
- Routh V. H., Hao L., Santiago A. M., Sheng Z., Zhou C. (2014). Hypothalamic glucose sensing: Making ends meet. Front. Syst. Neurosci, 8, 236. https://doi.org/10.3389/fnsys.2014.00236
- Roy S. C., Napit P. R., Pasula M., Bheemanapally K., Briski K. P. (2023). G protein-coupled lactate receptor GPR81 control of ventrolateral ventromedial hypothalamic nucleus glucoregulatory neurotransmitter and 5’-AMP-activated protein kinase expression. Amer. J. Physiol. Regul. Integr. Comp. Physiol, 324(1), R20–R34. https://doi.org/10.1152/ajpregu.00100.2022
- Shakya M., Shrestha P. K., Briski K. P. (2018). Hindbrain 5’-monophosphate-activated protein kinase mediates short-term food deprivation inhibition of the gonadotropin-releasing hormone-luteinizing hormone axis: Role of nitric oxide. Neuroscience, 383, 46–59. https://doi.org/10.1016/j.neuroscience.2018.04.040
- Sternisha S. M., Miller B. G. (2019). Molecular and cellular regulation of human glucokinase. Arch Biochem Biophys, 663(March), 199–213. https://doi.org/10.1016/j.abb.2019.01.011
- Stobart J. L., Anderson C. M. (2013). Multifunctional role of astrocytes as gatekeepers of neuronal energy supply. Cell Neurosci, 7, 1–21. https://doi.org/10.3389/fncel.2013.00038
- Tonon M. C., Désy L., Nicolas P., Vaudry H., Pelletier G. (1990). Immunocytochemical localization of the endogenous benzodiazepine ligand octadecaneuropeptide (ODN) in the rat brain. Neuropeptides, 15, 17–24. https://doi.org/10.1016/0143-4179(90)90155-r
- Tonon M. C., Vaudry H., Chuquet J., Guillebaud F., Fan J., Masmoudi-Kouki O., Vaudry D., Lanfray D., Morin F., Prevot V., Papadopoulos V., Troadec J. D., Leprince J. (2020). Endozepines and their receptors: Structure, functions and pathophysiological significance. Pharmacol. Ther, 208(April), 107386. https://doi.org/10.1016/j.pharmthera.2019.06.008
- Tu L., Fukuda M., Tong Q., Xu Y. (2022). The ventromedial hypothalamic nucleus: Watchdog of whole-body glucose homeostasis. Cell & Bioscience, 12, 71. https://doi.org/10.1186/s13578-022-00799-2
- Uddin M. M., Ibrahim M. M. H., Briski K. P. (2021). Glycogen phosphorylase isoform regulation of ventromedial hypothalamic nucleus gluco-regulatory neuron 5’-AMP-activated protein kinase and transmitter marker protein expression. ASN Neuro, 13, 17590914211035020. https://doi.org/10.1177/17590914211035020
- Uddin M. M., Mahmood A. S. M. H., Ibrahim M. M. H., Briski K. P. (2019). Sex dimorphic estrogen receptor regulation of ventromedial hypothalamic nucleus glucoregulatory neuron adrenergic receptor expression in hypoglycemic male and female rats. Brain Res. https://doi.org/10.1016/j.brainres.2019.146311
- Vavaiya K. V., Briski K. P. (2008). Effects of caudal hindbrain lactate infusion on insulin-induced hypoglycemia and neuronal substrate transporter glucokinase and sulfonylurea receptor-1 gene expression in the ovariectomized female rat dorsal vagal complex: Impact of estradiol. J. Neurosci. Res, 86(3), 694–701. https://doi.org/10.1002/jnr.21530
- Watts A. G., Donovan C. M. (2010). Sweet talk in the brain: Glucosensing, neural networks, and hypoglycemic counterregulation. Front. Neuroendocrinol, 31(1), 32–43. https://doi.org/10.1016/j.yfrne.2009.10.006
- Woods A., Salt I., Scott J., Hardie D. G., Carling D. (1996). The alpha1 and alpha2 isoforms of the AMP-activated protein kinase have similar activities in rat liver but exhibit differences in substrate specificity in vitro. FEBS Lett, 397(2–3), 347–351. https://doi.org/10.1016/s0014-5793(96)01209-4
- Xue B., Kahn B. B. (2006). AMPK Integrates nutrient and hormonal signals to regulate food intake and energy balance through effects in the hypothalamus and peripheral tissues. J Physiol, 574, 73–83. https://doi.org/10.1113/jphysiol.2006.113217