
Abstract
The quenching and partitioning (Q&P) process for heat treatment of steel has previously been shown yield to good combinations of strength and ductility owing to the presence of martensite and austenite. Interface mobility has been discussed in previous literature, mostly related to local driving forces. The present work considers the migration of the martensite/austenite interface in two steels (containing CMnSiMo or CNiSiMo). Experimental data show clear evidence of interface migration in the CMnSiMo steel during partitioning treatments at temperatures between 200 and 400°C for times ranging from 30 to 1000 s; conversely, the interface in the CNiSiMo steel was stationary during the same partitioning treatments. The different behaviours observed are considered in the context of differences in interface mobility and driving forces, and it appears that interface crystallography differences could influence the partitioning behaviour of Q&P steels.
Introduction
Quenching and partitioning (Q&P) is a thermal process aimed at stabilising retained austenite.Citation1–Citation4 The process involves an initial partial or full austenitisation, then quenching to a temperature (typically >100°C) between the martensite start and finish temperature to create a controlled fraction of martensite, followed by a ‘partitioning step’ to allow carbon to diffuse from martensite into the remaining austenite. The enhanced carbon levels in the austenite stabilise it to room temperature. Early assumptions in the development of the Q&P concept utilised assumptions of an immobile martensite/austenite interface during partitioning to define the constrained carbon equilibrium condition.Citation1 However, later analyses also included the possibility of a mobile interface in light of experimental evidence of interface migration.Citation5–Citation9 The present study was intended to further the understanding of interface mobility and migration by direct observation of the microstructure and the martensite/austenite interface before and after partitioning treatments. The present work utilised relatively highly alloyed Q&P chemistries that allowed for direct quenching from austenitisation temperatures to room temperature (instead of some elevated quench temperature) while maintaining significant fractions of austenite. The steels were characterised after this quenching step using a variety of techniques (e.g. SEM/EBSD and XRD), then subjected to a partitioning treatment (e.g. reheated to 200–400°C for 30–1000 s) and then cooled back to room temperature and characterised again. Comparison of observations from before and after the partitioning treatment allowed for observation of changes that occurred during the partitioning treatment such as interface migration.
Speer et al.Citation5 provided an early conceptual treatment of the potential for interface migration during partitioning; in their description, the authors point out that there is a clear potential for a driving force for martensite/austenite interface migration (in either direction) due to carbon partitioning resulting in chemical potential gradients for iron (and substitutionals) in each of the two phases. Based on this work, Santofimia et al.Citation7,Citation8 modelled the migration of such interfaces considering various cases of interface mobility (described as a function of an activation energy for iron atom motion at the interface). The model included carbon partitioning kinetics and allowed the interface between martensite (ferrite) and austenite to move with various degrees of contraint, ranging from immobile (e.g. a coherent interface) to relatively highly mobile (e.g. an incoherent interface). The model predicts very different microstructural evolution depending on the interface mobility. For the case of the immobile interface, it was found that the behaviour was the same as that predicted for constrained carbon equilibrium behaviour (i.e. stationary interface and carbon transport from martensite into austenite). For the semicoherent interface, results suggested it was found that the carbon concentration profiles were similar to those of the immobile interface for short times; however, for longer partitioning times, the calculated phase fractions and carbon concentrations move closer to equilibrium values (i.e. the interface migrated in the direction of austenite). Finally, for the case of the more mobile incoherent interface, it was found that carbon profiles and phase fractions were uniquely coupled during the partitioning process and the martensite/austenite interface migrated first towards the martensite and later towards the austenite (i.e. austenite growth followed by martensite growth).
The movement of the martensite/austenite interface in the direction of martensite is perhaps consistent with classically observed ‘reversion’ (the literature is not clear whether ‘reversion’ refers only austenite growth by shear mechanisms or if interface migrations by diffusional processes are also includedCitation12–Citation14,Citation30–Citation37). Martensite reversion to austenite has been reported to occur by growth of existing austenite or by nucleation of new austenite and subsequent growth; in which the former would result in reversed austenite of the same orientation as the parent austeniteCitation10 and the latter might cause austenite to be formed with orientations that are different than the parent austenite from which martensite formed.Citation10,Citation11 Growth of austenite might occur by an athermal shear mechanism (i.e. martensitic ‘reverse’ transformation) or by a thermally activated diffusional mechanisms (i.e. short range diffusion across the martensite/austenite interface).Citation12 The dominant mechanism depends on the temperature and the heating rate; where high heating rates are reportedly associated with shear transformationsCitation11,Citation12 and low heating rates are typically associated with thermally activated diffusion mechanisms.Citation12,Citation13 In either case, the reversed austenite typically has a high density of defectsCitation14 (although austenite formed by shear mechanisms may have a higher defect density as compared to that formed by diffusional growthCitation12). It has been hypothesised that the reversed austenite is more stabile than the parent austenite (i.e. resistant to transformation back to martensite) due to hindering of martensitic growth by the recovered sub-grain structure of the reversed austenite.Citation10,Citation12
Diffusional interface migration is reported to occur by one of two mechanisms. The first is a step or ledge mechanismCitation15 which occurs for coherent and semicoherent interfaces with relatively low index orientation relationships and habit planes; this mechanism usually displays start–stop growth behaviour due to the necessity of critical nucleation events.Citation15–Citation17 The second is the massive transformation which involves continuous or stepwise growth. The structure (e.g. coherency) of the martensite/austenite interface may partially govern the mobility of the interface. Ma and PondCitation18 have modelled martensite/austenite and suggest that the interface is semicoherent and can migrate by glissile motion of transformation dislocations at the interface. The present work aimed to understand the role of interface structure on interface mobility.
Procedure
Two steels were studied in this work, containing 0·31C–13·95Ni–1·91Si–0·24Mo (wt-%) or 0·27C–8·31Mn–1·94Si–0·25Mo (wt-%); the steels were designated as ‘14Ni steel’ and ‘8Mn steel’ respectively, due to the elevated nickel or manganese levels. The steels were laboratory cast and hot rolled to 2·54 mm thickness. Salt pots were used to heat treat the material according to the Q&P heat treatment process. The samples were austenitised at 875°C for 300 s and the quenched into water to room temperature. Some samples were left in this as quenched condition for examination. Other samples were reheated to 200, 300 or 400°C and held for 30, 60, 100 or 1000 s. This is referred to as the partitioning step. After the partitioning step, the samples were quenched in water to room temperature.
X-ray diffraction (XRD) was used to measure the retained austenite fraction and estimate the carbon content of austenite before and after the partitioning treatments. XRD was performed at room temperature with nickel filtered copper radiation using a Phillips X-pert diffractometer operating at 45 kV and 40 mA and equipped with an X’celerator detector with a 1° slit. Samples were prepared by grinding to remove surface oxides with 60, 120, 240, 300, 400 and 600 grit silicon carbide papers. The grinding step introduces work into the sample that might alter the XRD measurement; to avoid the detrimental effects of grinding, the samples were chemically thinned for approximately 15 min in a water cooled container of 10 parts water, 10 parts 30% hydrogen peroxide and 1 part hydrofluoric acid. Samples were scanned through a 2θ range from 40 to 105° over a total scan time of about 21 min. Filtered copper radiation was used and four austenite peaks ({111}, {200}, {220} and {311}) and four ferrite/martensite peaks ({110}, {200}, {211}, {220}) were quantified and the austenite fraction was estimated using the SAE method.Citation19 The carbon content of the as quenched austenite () was assumed to be that of the bulk alloy. The carbon content of austenite after partitioning treatments (
) was calculated from the change in lattice parameter relative to the as quenched condition according to the equationCitation20–Citation22
(1) where aγ is the lattice parameter of austenite after the partitioning treatment and
is the lattice parameter of austenite in the as quenched condition. Unless otherwise noted, all data were collected from unique samples which were each subjected to partitioning treatments for the times and temperatures indicated.
EBSD was used to characterise the microstructures before and after partitioning, to identify phases (austenite and ferrite/martensite) present in the microstructure, observe the morphology of austenite and provide orientation information useful for understanding microstructural evolution. EBSD analyses were performed using a JEOL-7000F FESEM. Samples were polished with 6, 3 and 1 μm diamond slurries. The final step before EBSD data collection involved vibratory polishing using 0·05 μm colloidal silica. The samples were tilted 70° (with respect to horizontal) towards the camera used to collect EBSD patterns. Owing to the tilting of the sample, the working distance (approximately 15 mm) varied with position; therefore, dynamic focus control was used to focus the entire image during data collection. The accelerating voltage was 20 kV. The step size for EBSD data collection was 50 nm using a hexagonal grid pattern. EDAX-TSL OIM Data Collection 5·1 software was used to collect and index the Kikuchi band patterns and TSL OIM Data Analysis 5·1 software was used to analyse the results obtained from EBSD. Post-processing cleaning routines were not employed (unless otherwise noted).
Results
The austenite fractions and austenite carbon content estimated from XRD are shown for both steels in as a function of partitioning time (Pt). As seen , relative to the as quenched condition (i.e. Pt = 0 s), the austenite fractions of the 8Mn steel increased significantly with increasing partitioning time after partitioning at 200, 300 or 400°C. The higher partitioning temperatures resulted in a greater increase in the austenite fraction for the partitioning times examined. To verify that the increase in austenite fraction observed was a real effect and not an artefact of the experimental method, a single sample was subjected to a cumulative partitioning treatment in which the austenite fraction was measured by XRD and then the same sample was heated to the partitioning temperature (PT) for the prescribed amount of time and then cooled to room temperature for XRD analysis, and then reheated to the partitioning temperature and so on. The results are shown as closed symbols in . This procedure led to a similar increase in austenite fractions with partitioning time. The increase in austenite fraction must be the result of either growth of existing austenite or nucleation of new austenite and subsequent growth.
1. XRD results as a function of partitioning time. a, c Austenite fractions for 8Mn and 14Ni steel respectively. b, d Austenite carbon contents for 8Mn and 14Ni steel respectively. With exception of the closed symbols in a, all data were collected from unique samples subjected to partitioning treatments for the times and temperatures indicated. The closed symbols in a were collected from a single sample that was heat-treated cumulatively for the indicated time at 400°C
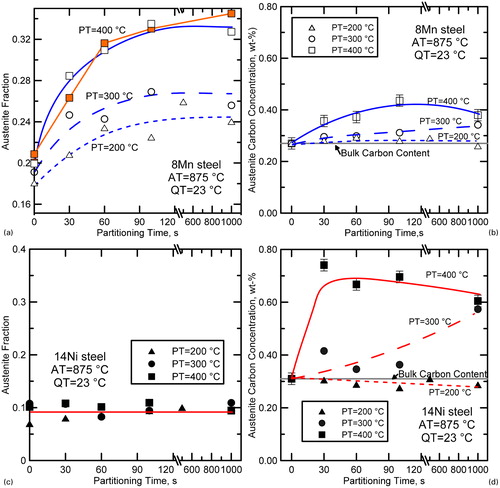
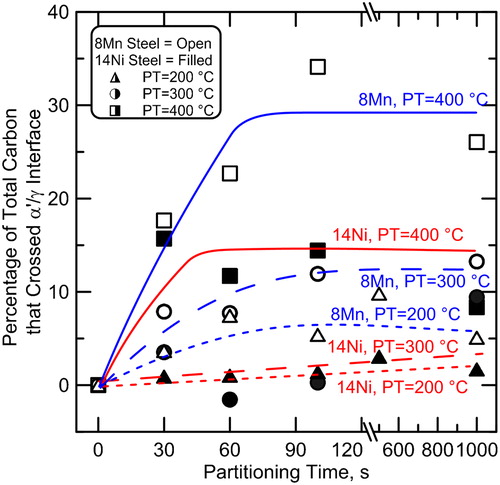
The austenite fractions measured from the 14Ni steel were essentially stabile with partitioning times up to 1000 s for partitioning temperatures of 200, 300 or 400°C, as shown in . In this regard, the behaviour of the 14Ni steel was in contrast to the 8Mn steel, but consistent with assumptions made with respect to constrained carbon equilibrium (CCE).Citation1 The austenite carbon content estimated from XRD are shown in ) and d as a function of partitioning time. The austenite carbon concentrations increased in both steels after partitioning treatments at 300°C or higher, and the effect was apparently more pronounced in the 14Ni steel. However, it should be noted that the austenite fraction in the 8Mn steel was increasing simultaneously with the observed increase in carbon content of the austenite; thus, the flux of carbon atoms across the interface was greater in the 8Mn steel than the measured average carbon content of the austenite alone would indicate. To illustrate this point, shows the percentage of carbon atoms that crossed the martensite/austenite interface as a function of partitioning time based on carbon mass balance using XRD data from . Values were calculated by dividing the number (or weight) of carbon atoms that crossed the interface during the partitioning treatment by the total number (or weight) of carbon atoms in the system. Positive values indicate carbon migration in the direction from martensite to austenite. As seen in the figure, the percentages of carbon atoms that must have crossed the martensite/austenite interface are similar for each of the steels. Further, the percentage of carbon atoms that must have crossed the interface for the samples partitioned at any particular temperature was greater for the 8Mn steel than that for the 14Ni steel, despite the fact that the enrichment of austenite appears to be less in the 8Mn steel-as measured by carbon concentration (e.g. versus d).
2. Percentage of total carbon that crossed the martensite/austenite interface as a function of partitioning time based on carbon mass balance using XRD data from . Values were calculated by dividing the number (or weight) of carbon atoms that crossed the interface during the partitioning treatment by the total number (or weight) of carbon atoms in the system
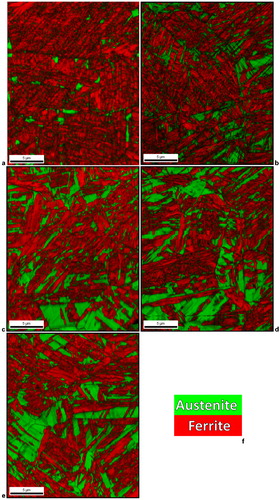
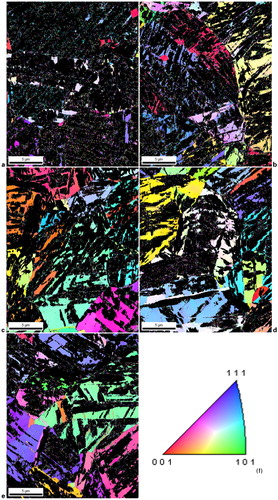
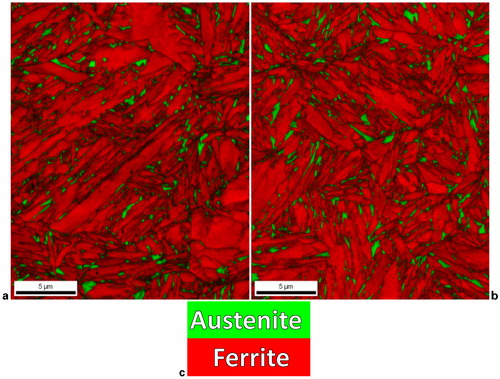
shows the results of a series of EBSD analyses also performed on individual samples of the 8Mn steel to examine the evolution of microstructure during partitioning at 400°C for various times. displays the data as a phase+image quality map in which colour represents the indexed phase (red for bcc or bct, and green for fcc) and the greyscale represents the image quality (comparable to band contrast in some EBSD analysis packages) which gives an indication of the dislocations density of the martensite.Citation23,Citation24 As shown in the phase+image quality maps of , the austenite fractions in the 8Mn steel increased significantly with increasing partitioning time up to about 100 s. This observation is in agreement with the XRD analyses presented in . The austenite in the microstructures shown in is in thin films as well as large pools. This increase in austenite fraction must be the result of either growth of existing austenite or nucleation of new austenite and subsequent growth, as previously mentioned. To determine which of these two phenomena occurred, additional EBSD analyses were performed. shows inverse pole figure maps of only regions that indexed as austenite; the colour indicates the orientation of the austenite crystal (martensite appears black). Inspection of figures reveals that the orientations of the prior austenite grains remain after quenching and partitioning for various times. That is, the individual austenite grains present in the microstructure share common orientations inherited from the parent austenite grains (present at the austenitising temperature). If new austenite crystals were to have nucleated, these common orientations would not be dominant and additional austenite orientation variants would be expected.Citation10 Thus, shows strong evidence that existing austenite was growing (instead of new austenite nucleating and growing).
3. a 8Mn steel 875°C+WQ (as quenched); b 8Mn steel 875°C+WQ+400°C, 30 s; c 8Mn steel 875°C+WQ+400°C, 60 s; d 8Mn steel 875°C+WQ+400°C, 100 s; e 8Mn steel 875°C+WQ+400°C, 1000 s; f legend
EBSD image quality+phase maps of 8Mn steel: a as quenched; then partitioned at 400°C for b 30 s, c 60 s, d 100 s, e 1000 s; f legend
4. a 8Mn steel 875°C+WQ (as quenched); b 8Mn steel 875°C+WQ+400°C, 30 s; c 8Mn steel 875°C+WQ+400°C, 60 s; d 8Mn steel 875°C+WQ+400°C, 100 s; e 8Mn steel 875°C+WQ+400°C, 1000 s; f legend
Inverse pole figure maps of austenite in 8Mn steel: a as quenched, partitioned at 400°C for b 30 s, c 60 s, d 100 s, e 1000 s; f legend. Regions that indexed as martensite regions appear black
shows the number of austenite crystals found in a 20×25 μm area as measured by EBSD after quenching and after partitioning at 400°C for various times. As seen in the table, the as quenched condition (i.e. Pt = 0 s) featured the highest number of distinct crystals. The number of distinct crystals decreased with partitioning times as a result of multiple austenite features growing into one another (hence becoming one feature). If new austenite were have nucleated, the number of distinct austenite features likely would have increased for some time. The observed behaviour is hypothesised to result from coalescence of austenite grains during growth, although the details of this process are not completely understood. Therefore, it is most likely that existing austenite was growing during the partitioning step. Thus, based on the evidence collected by XRD and EBSD methods, it is clear that the martensite/austenite interface is mobile and there is a driving force for movement of the interface towards martensite during the partitioning treatment of the 8Mn steel.
Table 1. Number of distinct austenite crystals present in 8Mn steel in 20×25 μm area measured by EBSD after partitioning at 400°C for times indicated
Similar analyses were performed using the 14Ni steel which exhibited stabile austenite fractions based on XRD. shows the EBSD results for an individual sample of the 14Ni steel after quenching (figure a) and after quenching and partitioning at 400°C for 100 s (). As seen in the figure, the austenite is present as thin films and pools typical of Q&P microstructures. Although not presented here, EBSD analyses of the 14 Ni steel were also conductedCitation25 for a variety of other partitioning conditions (e.g. as quenched, and quenched and partitioned 200 or 400°C for 30, 60, 100 or 1000 s). The images revealed that the austenite fraction was stabile during partitioning treatment, in agreement with the XRD analyses. The only change observed in EBSD results for the other partitioning conditions was variation in the image quality (represented by greyscale in ), where samples subjected to longer partitioning treatments generally exhibited higher values of image quality, likely due to recovery of the martensite.
5. a 14Ni steel 875°C+WQ (as quenched); b 14Ni steel 875°C+WQ+400°C, 100 s; c legend
EBSD image quality+phase maps of 14Ni steel after a water quenching and b water quenching and partitioning at 400°C for 100 s
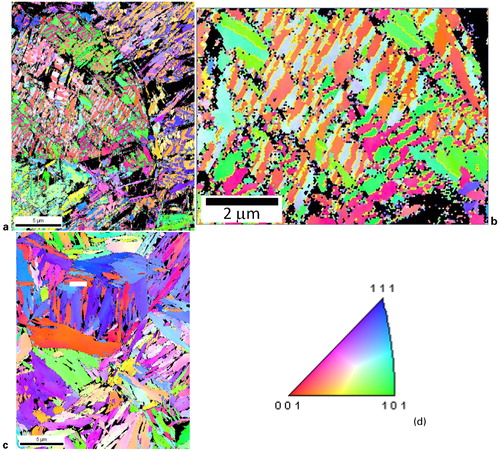
shows inverse pole figure maps that are representative of the martensite observed in each steel. As shown in , the martensite in the 8Mn steel exhibited a morphology that consists of fine laths that sometimes exhibit alternating variants. This morphology has been termed ‘ladder martensite’ due to the appearance of alternating layers of twin related α′-martensite. This type of martensite morphology has been related to the formation of ϵ-martensite prior to formation of α′-martensite.Citation26 XRD analysis of the 8Mn steel showed evidence of ϵ-martensite, suggesting that ϵ-martensite may have preceded α′-martensite formation and yielded this characteristic morphology. In , yellow lines highlight boundaries between laths that represent 60° rotations about a <111>α axis which represents a low energy twin boundary. This type of boundary was observed for all of the alternating laths observed in the 8Mn steel. As shown in , the 14Ni steel did not exhibit any of the ‘ladder martensite’ structure when observed via EBSD, rather a more plate-like morphology was observed in which twin orientations were not observed. Further, XRD analyses did not reveal any evidence of ϵ-martensite in the 14Ni steel suggesting that α′-martensite may have formed directly from austenite. Thus, the mechanisms of martensite formation and resulting structures of the martensite formed in each of the two steels appear to be quite different.
6. a 8Mn steel 875°C+WQ+400°C, 30 s; b 8Mn steel 875°C+WQ+400°C, 30 s; c 14Ni steel 875°C+WQ+400°C, 30 s; d legend
Representative inverse pole figure map of ferrite/martensite in a 8Mn steel and c 14Ni steel. Samples were partitioned at 400°C for 30 s. b Higher magnification image of that shown in a where yellow highlighting shows all boundaries that represent a 60° rotation about a <111>α axis. These boundaries were found in all conditions of the 8Mn steel
Previous literature has reported different orientation relationships between austenite and martensite. Two commonly cited orientation relationships are the Kurdjumov–Sachs (KS) orientation relationship and the Nishiyama–Wassermann (NW) orientation relationship (OR).Citation27 shows the description for these orientation relationships as well as associated axis–angle pairs (an axis–angle pair describes a rotation about a common axis necessary to bring two unit cell orientations into coincidence).Citation28 shows greyscale image quality maps of each steel in which austenite is highlighted green and martensite/austenite phase boundaries associated with the KS or NW orientation relationship are highlighted red or yellow respectively. The samples shown were partitioned at 400°C for 60 s. The angular tolerance for this analysis was ±2·5°. The angular tolerance was chosen to avoid overlap based on the difference between the KS and NW orientation relations of 5·26°.Citation28,Citation29
7. Representative EBSD. Image quality maps (greyscale) with austenite highlighted in green and martensite/austenite boundaries that exhibit particular orientation relationships highlighted in red (KS OR) or yellow (NW OR). Samples were partitioned at 400°C for 60 s
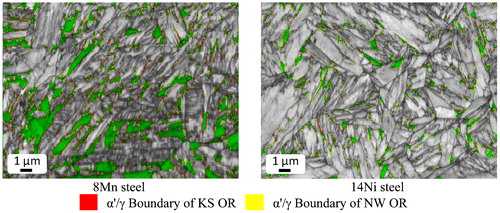
Table 2. Orientation relationships and associated axis–angle pairsCitation28
tabulates the total line length of the aforementioned boundaries and shows the ratio of boundary lengths of KS/NW for all of the partitioning conditions of the 8Mn steel. As seen in the table, the martensite/austenite interfaces exhibited in the 8Mn steel were predominately of the KS OR (at a ratio of about 2∶1 compared to the NW OR). The 14Ni steel featured the opposite behaviour, wherein the predominant OR of the martensite/austenite interfaces was of the NW OR (at a ratio of about 2∶1 compared to the KS OR).
Table 3. Length of boundaries associated with KS or NW orientation relationships analysed by EBSD
Discussion
The results of this work have shown that the martensite/austenite interface in the 8Mn steel migrated during the partitioning step. This migration was evident as a significant increase in austenite fraction after partitioning as compared to the as quenched condition. In contrast, the behaviour of the 14Ni steel during partitioning treatments was very different, with of stabile austenite fractions indicative of a stationary martensite/austenite interface. While both steels exhibited a significant flux of carbon atoms across the boundary, it is evident that boundary movement was prominent in the 8Mn steel but not in the 14Ni steel. On a basic level, the difference in the behaviour of the two steels must be the result of (1) differences in the driving force for austenite formation and/or (2) differences in the mobility of the martensite/austenite interface. It is apparent that there was a driving force for interface migration (e.g. austenite growth) and the interface was mobile at the partitioning temperatures of interest such that the interface could move at an appreciable velocity in the 8Mn steel. Alternatively, at least one of these two criteria clearly was not met for the 14Ni steel. At present, it is difficult to positively identify which of these criteria were not met, but it is clear that there are significant differences in the martensitic structures and interface character between the two phases that might have led to a more highly mobile interface in the 8Mn steel versus the 14Ni steel. The 8Mn steel exhibited and ϵ-martensite precursor and ladder martensite with multiple twin variants; while the 14Ni steel did not exhibit twinned variants and was associated with a much greater propensity toward the NW OR (whereas the 8Mn steel exhibited the KS OR). Kajiwara and OwenCitation30,Citation31 have suggested that differences in dislocation density or differences in the martensite morphology (such as the presence of transformation twins that extend to the martensite/austenite interface) might have an effect on the interface mobility. Thus, the differences in observed martensite morphologies and interface structure may offer an explanation for the observed interface migration in the 8Mn steel and the stationary interface in the 14Ni steel. The results do not conclusively prove, but are suggestive that austenite/martensite interface between crystals having a KS OR may be more mobile during partitioning in comparison to crystals having a NW OR.
Conclusions
Based on changes in phase fractions during partitioning (measured by both XRD and EBSD) it is concluded that the martensite/austenite interface in a CMnSiMo steel (8Mn steel) migrated towards martensite during partitioning treatments at 200, 300 and 400°C, indicating that the martensite/austenite interface was mobile. The martensite/austenite interface in a CNiSiMo (14Ni steel) did not migrate during partitioning treatments at 200, 300 or 400°C. The martensite morphology and OR with austenite was found to be quite different between the two steels. The 8Mn steel featured ‘ladder martensite’ resulting from ϵ-martensite formation preceding α′-martensite formation with a predominately KS OR with austenite. Alternatively, the 14Ni steel featured more plate-like martensite with a predominately NW OR with austenite. It is hypothesised that differences in the martensitic structure and interface orientation may be related to the difference in interface mobility between the two steels, where the 8Mn steel featured a mobile martensite/austenite interface, and the 14Ni steel featured a stationary interface.
Notes
This paper is part of a special issue on Adventures in the Physical Metallurgy of Steels
Related Research Data
References
- Speer J, Matlock DK, de Cooman BC and Schroth JG: ‘Carbon partitioning into austenite after martensite transformation’, Acta Mater., 2003, 51, 2611–2622.
- Edmonds DVV, He K, Rizzo FCC, de Cooman BCC, Matlock DKK and Speer JGG: ‘Quenching and partitioning martensite – a novel steel heat treatment’, Mater. Sci. Eng. A, 2006, A438–A440, 25–34.
- de Moor E, Lacroix S, Clarke AJ, Penning J and Speer JG: ‘Effect of retained austenite stabilized via quench and partitioning on the strain hardening of martensitic steels’, Metall. Mater. Trans. A, 2008, 39A, 2586–2595.
- Clarke A, Speer JG, Matlock DK, Rizzo FC, Edmonds DV and Santofimia MJ: ‘Influence of carbon partitioning kinetics on final austenite fraction during quenching and partitioning’, Scr. Mater., 2009, 61, 149–152.
- Speer JG, Hackenberg RE, Decooman BC and Matlock DK: ‘Influence of interface migration during annealing of martensite/austenite mixtures’, Philos. Mag. Lett., 2007, 87, 379–382.
- Zhong N, Wang X, Rong Y and Wang L: ‘Interface migration between martensite and austenite’, J. Mater. Sci. Technol., 2006, 22, 751–754.
- Santofimia MJ, Zhao L and Sietsma J: ‘Model for the interaction between interface migration and carbon diffusion during annealing of martensite–austenite microstructures in steels’, Scr. Mater., 2008, 59, 159–162.
- Santofimia MJ, Speer JG, Clarke aJ, Zhao L and Sietsma J: ‘Influence of interface mobility on the evolution of austenite–martensite grain assemblies during annealing’, Acta Mater., 2009, 57, 4548–4557.
- Yuan L, Ponge D, Wittig J, Choi P, Jiménez JA and Raabe D: ‘Nanoscale austenite reversion through partitioning, segregation, and kinetic freezing: example of a ductile 2 GPa Fe–Cr–C steel’, Acta Mater., 2012, 60, 2790.
- Guy KB, Butler EP, and West DRF: ‘Reversion of bcc α′ martensite in Fe–Cr–Ni austenitic stainless steels’, Met. Sci., 1983, 17, 167–176.
- Kessler H and Pitsch W: ‘On the nature of the martensite to austenite reverse transformation’, Acta Metall., 1967, 15, 401–405.
- Apple CA and Krauss G: ‘The effect of heating rate on the martensite to austenite transformation in Fe–Ni–C alloys’, Acta Metall., 1972, 20, 849–856.
- Tavares SSM, Fruchart D and Miraglia S: ‘A magnetic study of the reversion of martensite α′ in a 304 stainless steel’, J. Alloys Compd, 2000, 307, 311–317.
- Smith H and West DRF: ‘The reversion of martensite to austenite in certain stainless steels’, J. Mater. Sci., 1973, 8, 1413–1420.
- Aaronson HI, Howe JM, Hall MG, Furuhara T and Hirth JP: ‘Mobility of structural ledges’, Scr. Mater., 1997, 37, 1301–1307.
- Howe JM: ‘Comparison of the atomic structure, composition, kinetics and mechanisms of interfacial motion in martensitic, bainitic, massive and precipitation face-centered cubic–hexagonal close-packed phase transformations’, Mater. Sci. Eng. A, 2006, A438–A440, 35–42.
- Wu J, Howe JM and Zhang WZ: ‘An in situ transmission electron microscopy study of interface growth during martensitic transformation in an Fe–Ni–Mn alloy’, Acta Mater., 2011, 59, 3297–3303.
- Ma X and Pond RC: ‘Parent–martensite interface structure in ferrous systems’, J. Nucl. Mater., 2007, 361, 313–321.
- ‘Retained austenite and its measurement by X-ray diffraction’, Society of Automotive Engineers, Warrendale, PA, USA, 1980, 12.
- Santofimia MJJ, Zhao L, Petrov R, Kwakernaak C, Sloof WGG and Sietsma J: ‘Microstructural development during the quenching and partitioning process in a newly designed low-carbon steel’, Acta Mater., 2011, 59, 6059–6068.
- Dyson DJ and Holmes B: ‘Effect of alloy additions on the lattice parameter of austenite’, J. Iron Steel Inst., 1970, 208, 469–474.
- van Dijk NH: ‘Thermal stability of retained austenite in TRIP steels studied by synchrotron X-ray diffraction during cooling’, Acta Mater., 2005, 53, 5439–5447.
- Thomas G, Speer J, Matlock D and Michael J: ‘Application of electron backscatter diffraction techniques to quenched and partitioned steels’, Microsc. Microanal., 2011, 17, 368–373.
- Santofimia MJ, Zhao L, Petrov R and Sietsma J: ‘Characterization of the microstructure obtained by the quenching and partitioning process in a low-carbon steel’, Mater. Charact., 2008, 59, 1758–1764.
- Thomas GA: ‘A study of partitioning mechanisms operating during Q&P heat treatment of steel’, PhD thesis, Colorado School of Mines, Golden, CO, USA, 2012.
- Cheol KHK, Lee H, Um K.-K, Choi J.-K and Kim NJ: ‘Microstructural development in Fe–12Mn steel’, Proc. Int. Conf. on ‘Advanced steel’, 78, Guilin, China, November 2010, CSM.
- Krauss G: ‘Processing, structure, and performance’, 613; 2005, Materials Park, OH, ASM International.
- He Y, Godet S and Jonas JJ: ‘Representation of misorientations in Rodrigues–Frank space: application to the Bain, Kurdjumov–Sachs, Nishiyama–Wassermann and Pitsch orientation relationships in the Gibeon meteorite’, Acta Mater., 2005, 53, 1179–1190.
- Bhadeshia HKDH: ‘Worked examples in the geometry of crystals’, 2nd edn; 1987, London, Maney Publishing.
- Kajiwara S: ‘Velocity of the austenite-martensite interface in reverse martensitic transformation in FeNiC alloys’, Mater. Charact., 1995, 34, 105–119.
- Kajiwara S and Owen WS: ‘The martensite–austenite interface and the thickness of twins in martensite in Fe 3Pt’, Scr. Metall., 1977, 11, 137–142.
- Mangonon PL and Thomas G: ‘Structure and properties of thermal-mechanically treated 304 stainless steel’, Metall. Trans., 1970, 1, 1587–1594.
- Kajiwara S and Kikuchi T: ‘Reversible movement of the austenite–martensite interface and dislocation structures in reverse-transformed austenite in Fe–Ni–C alloys’, Philos. Mag. A 1983, 48A, 509–526.
- Mangonon P and Thomas G: ‘The martensite phases in 304 stainless steel’, Metall. Trans., 1970, 1, 1577–1586.
- Gauzzi F and Montanari R: ‘Martensite reversion in an Fe–21%Mn–0·1%C alloy’, Mater. Sci. Eng. A, 1999, A273–A275, 524–527,.
- Montanari R: ‘AISI 304 steel: effects of slow heating rates on α′→γ reversion’, Mater. Lett., 1989, 8, 297–300.
- Zararsiz A, Gedikoğlu A and Durlu TN: ‘Mössbauer study of martensite to austenite reverse transformations in Fe 17·1% Ni O. 81% C alloy’, Scr. Metall., 1981, 15, 999–1001.