
Abstract
Auditory discrimination of speech stimuli is an essential tool in speech and language therapy, for example, in dysarthria rehabilitation. It is unclear, however, which listener characteristics are associated with the ability to perceive differences between one's own utterance and target speech. Knowledge about such associations may help to support patients participating in speech and language therapy programs that involve auditory discrimination tasks. Discrimination performance was evaluated in 96 healthy participants over 60 years of age as individuals with dysarthria are typically in this age group. Participants compared meaningful words and sentences on the dimensions of loudness, pitch, and speech rate. Auditory abilities were assessed using pure-tone audiometry, speech audiometry, and speech understanding in noise. Cognitive measures included auditory short-term memory, working memory, and processing speed. Linguistic functioning was assessed by means of vocabulary knowledge and language proficiency. Exploratory factor analyses showed that discrimination performance was primarily associated with cognitive and linguistic skills, rather than auditory abilities. Accordingly, older adults’ discrimination performance was mainly predicted by cognitive and linguistic skills. Discrimination accuracy was higher in older adults with better speech understanding in noise, faster processing speed, and better language proficiency, but accuracy decreased with age. This raises the question whether these associations generalize to clinical populations and, if so, whether patients with better cognitive or linguistic skills may benefit more from discrimination-based therapeutic approaches than patients with poorer cognitive or linguistic abilities.
Introduction
Adequate self-perception is considered a prerequisite to attain modifications of speech behavior (Schroter-Morasch and Ziegler, Citation2005). Patients in speech or language therapy programs are frequently asked to compare their own realizations with target speech, which is presented either by the therapist or by a speaker whose speech was recorded for that purpose. Auditory discrimination of speech stimuli is thus an essential component of speech and language therapy. Auditory discrimination of non-speech stimuli has been shown to rely on auditory and cognitive abilities (e.g. Humes, Citation2005). However, in therapy settings, patients typically have to discriminate words and sentences. This raises the question which abilities are involved in the discrimination of speech materials. After all, if patients are unable to perceive deviations in the acoustic properties in speech, their ability to adequately modify their speech production will be limited.
Recently, an auditory discrimination test (ADT) has been developed to assess the ability of individuals with dysarthria to discriminate acoustic properties in speech (Beijer et al., Citation2011). Outcomes of the test are used to evaluate whether patients qualify for E-learning-based speech therapy (EST) (Beijer et al., Citation2010). This speech training offers patients with dysarthria secondary to neurological impairment (Parkinson's disease or stroke) an opportunity for intensive and independent training at home. During training, patients are presented with sentences from a database – according to a personalized protocol – and have to repeat target utterances. The patients’ task is to maximize the similarity between the targets and their own realizations (Beijer et al., Citation2011). To assess the success of their attempt, patients can replay their own utterance and compare it to the original sentence. Obviously, in order to benefit from this form of intervention, individuals with dysarthria should be able to detect the differences between their own realizations and the target utterances, so that they can adjust their speech production accordingly. As patients’ performance on the ADT is used to (contra-)indicate participation in EST, it is important to know whether any other constraints in sensory or cognitive functioning may affect discrimination performance on language materials. That is, knowledge about the association between auditory, cognitive, and linguistic abilities, and auditory discrimination performance is of clinical relevance, as it may provide indications to support patients participating in programs of speech and language therapy involving auditory discrimination tasks.
Individuals with dysarthria are commonly over 60 years of age. Age-related changes in hearing sensitivity (Cruickshanks et al., Citation1998) and cognitive abilities (for a review, see Park and Reuter-Lorenz, Citation2009) are prevalent in this age group. As auditory discrimination is a function of auditory processing (American Speech-Language-Hearing Association (ASHA), Citation1996), and measures of auditory processing have previously been associated with cognitive (e.g. Fogerty et al., Citation2010; Humes, Citation2005) and auditory abilities (Cox et al., Citation2008; Humes, Citation2005), auditory discrimination performance may already be affected in a healthy older population. Therefore, our study was set up (1) to help establish reference data for clinical populations on those subtests of the ADT that represent the most general acoustic dimensions (i.e. loudness, pitch, and speech rate) and (2) to determine how strongly variability in hearing abilities and cognitive and linguistic performance is associated with individual ADT performance among healthy older adults. Knowledge about associations between discrimination of acoustic properties in speech and both auditory and cognitive abilities may guide the therapist in choosing an appropriate therapeutic approach for individual patients: for example, if working memory turns out to play a role, the length of stimuli in auditory discrimination tasks may be adjusted.
Importantly, auditory processing is commonly assessed by asking participants to detect, discriminate, or identify characteristics of unfamiliar non-speech stimuli such as discriminating pitch of pure tones or detecting gaps in modulated noise. Although performance on these tasks has been directly linked to older adults’ speech processing abilities (e.g. Papakonstantinou et al., Citation2011), thereby highlighting the importance of auditory processing in speech perception, it remains unclear whether auditory processing of non-speech stimuli taps the same abilities as processing of speech stimuli. Kidd et al. (Citation2007) included identification of nonsense syllables, words, and sentences in their analysis of auditory abilities. Based on the performance of 340 participants on 19 auditory processing tests, they extracted four distinct auditory processing abilities. All measures regarding identification of speech stimuli in broadband noise loaded on a common factor, together with a task of familiar environmental sound identification. Kidd et al. (Citation2007) concluded that the common factor described a distinct ability of auditory processing of familiar sounds including speech. As this factor was clearly distinct from the other auditory processing abilities (i.e. a loudness-duration factor reflecting sensitivity to changes in overall energy; an amplitude modulation factor resembling sensitivity to brief changes in level; and a pitch and time factor resembling sensitivity to patterns affecting longer stretches of sound), correlates of auditory processing of non-speech stimuli may not necessarily generalize to auditory processing tasks making use of speech materials. Given the differences between speech and non-speech stimuli – for example, the duration of non-speech stimuli in discrimination tasks ranges between 100 and 250 ms (Kidd et al., Citation2007), whereas words and sentences span several hundreds of milliseconds – processing of speech and non-speech stimuli may indeed (partially) require different abilities.
This study was therefore set up to investigate which cognitive processes are involved in auditory discrimination of acoustic properties in speech. As the first, anchor stimulus of a trial has to be stored over a brief period of time until its internal representation can be compared with the second, contrasting stimulus, memory skills are likely to come into play. Auditory short-term memory is needed for the immediate recall of auditory information (Gathercole, Citation1999). Moreover, working memory is required to simultaneously store and process auditory information, which is necessary to compare the two, anchor and contrast, stimuli (Gathercole, Citation1999). The high incidence of auditory processing deficits in patients with memory dysfunctions (e.g. Idrizbegovic et al., Citation2011) supports the idea that memory processes relate to auditory discrimination.
Furthermore, processing speed has been found to explain individual variation in temporal auditory processing (Harris et al., Citation2010) and may also relate to auditory discrimination of speech characteristics. In speech, auditory temporal processing enables listeners to differentiate between phonemes such as stop consonants (Pichora-Fuller and Souza, Citation2003). Similarly, age-related declines in auditory temporal processing have been related to older adults’ speech perception difficulties (Pichora-Fuller and Souza, Citation2003; Schneider and Pichora-Fuller, Citation2001), such as problems in discriminating certain phonemic contrasts that are distinguishable on the basis of durational cues such as the length of gaps (Schneider and Pichora-Fuller, Citation2001).
Additionally, language proficiency and vocabulary knowledge may relate to the ease with which auditory speech discrimination can be performed as auditory processing involves two subtasks in this context: processing the speech stimuli and comparing the anchor with the contrast stimulus. Both subtasks demand cognitive processing. High language proficiency and better vocabulary knowledge may facilitate processing of the linguistic content, such that less cognitive resources are needed to perform the first subtask. Moreover, most older adults listen to a partially degraded auditory signal as they experience age-related hearing loss. Vocabulary knowledge has been shown to support comprehension of degraded speech such as dysarthric (McAuliffe et al., Citation2013), noise-vocoded (Neger et al., Citation2014) or accented (Janse and Adank, Citation2012) speech. Consequently, more cognitive resources might be available to perform the second subtask of stimuli comparison, which is essential for auditory discrimination.
In sum, this study investigates how measures of auditory (i.e. hearing threshold, speech understanding in quiet and noise), cognitive (i.e. auditory short-term memory, working memory, processing speed), and linguistic abilities (i.e. vocabulary knowledge, language proficiency) are associated with auditory discrimination of acoustic properties in speech in healthy older people.
Materials and methods
Participants
Sufficient audibility is a prerequisite for auditory discrimination. Therefore, individuals with severe hearing loss in at least one ear were excluded from this study. Applying the definition of the World Health Organization (Citation2014), we classified severe hearing loss as a pure-tone average (PTA) over 0.5, 1, 2, and 4 kHz of at least 61 dB HL. As approximately 95% of older adults have a PTA up to 60 dB HL in both ears (Cruickshanks et al., Citation1998), hearing sensitivity observed in the present sample was representative of the hearing level typically observed in older adults (see below for more details). The initial sample of participants consisted of 97 native speakers of Dutch. One participant was excluded because of a recent stroke. The remaining 96 participants were neurologically intact and had no history of speech or language disorders except for one, who had received stuttering therapy in childhood. Participants were aged between 60 and 84 years and two-thirds were female. Participants’ level of education was indicated on a 5-point scale: primary school was coded as 1, secondary education was coded as 2, technical and vocational training for teenagers from 16 to 18 years old was coded as 3, upper technical and vocational training for adults was coded as 4, and university education was coded as 5. Most of the participants had followed upper technical vocational training for adults. Participant information including age, educational level, and performance on all background tasks can be found in .
Table 1. Participant information, including age, educational level and performance on all tasks
Auditory measures
Pure tone thresholds
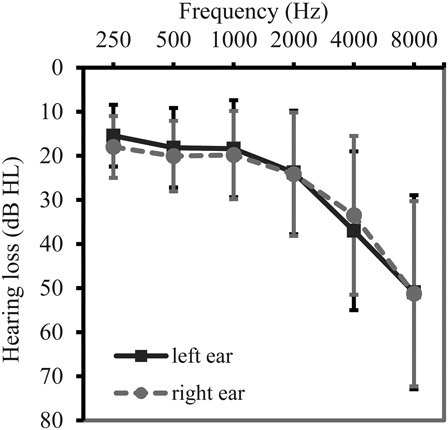
All experimental tasks were conducted in a sound-attenuating booth (Amplisilence S.p.a., Robassomero, Italy) to minimize distraction. Peripheral auditory function was assessed by measuring air-conduction pure-tone thresholds with a PC-based diagnostic audiometer (Oscilla USB-300, Inmedico A/S, Aarhus, Denmark). Pure-tone thresholds were determined at 0.25, 0.5, 1, 2, 4, and 8 kHz in both ears. Higher thresholds reflected poorer hearing. Mean thresholds are given in .
Figure 1. Average pure tone thresholds at 0.25, 0.5, 1, 2, 4, and 8 kHz for both ears (n = 96). Error bars represent one standard deviation of the mean.
As age-related hearing loss particularly affects sensitivity to the higher frequencies, a high-frequency pure-tone average (PTAhigh), calculated as the mean hearing threshold over 1, 2, and 4 kHz, was taken as an index of hearing acuity. According to the standard of insurance coverage in the Netherlands (PTAhigh of one ear ≥35 dB HL), 34 older participants actually qualified for partially refunded hearing aids on the basis of their hearing thresholds. However, at the time of testing, none of the participants wore hearing aids in daily life (cf. Gopinath et al. (Citation2011) on hearing aid uptake). To assess whether variation in audibility affects discrimination performance, we kept the presentation level of the auditory stimuli in our experiment constant. Twenty out of the 96 participants showed asymmetrical hearing loss, which was defined as a between-ears PTA difference (PTA calculated over 0.5, 1, 2 and 4 kHz) exceeding 10 dB HL (Noble and Gatehouse, Citation2004). Although hearing problems in these participants may not originate from age-related changes in the peripheral auditory system, we did not exclude listeners with asymmetrical hearing loss from this study, as we wanted to assess whether common variability in older adults’ auditory abilities (including speech reception thresholds, see below) affects individual ADT performance. Only the PTAhigh of the best ear was considered in the analysis, as all auditory stimuli in the experimental tasks were presented binaurally via dynamic closed, circumaural headphones (Sennheiser HD 215, Sennheiser electronic GmbH & Co. KG, Wedemark, Germany).
Speech reception in quiet
As a second measure of participants’ auditory abilities, we assessed participants’ speech audiometry performance. The minimum hearing level at which a participant could understand 50% of phonetically balanced Dutch words (Bosman, Citation1989) was measured with the aid of an audiometer (Interacoustics Equinox2.0 AC 440, Interacoustics AS, Assens, Denmark) and a noise-cancelling audiometric headset (Telephonics TDH 39 (Telephonics Corporation, New York, USA) with Amplivox Audiocups (Amplivox Limited, Eynsham, UK)). The speech reception threshold in quiet was indicated in terms of dB HL. Therefore, higher scores reflected poorer ability of participants to identify speech in quiet. As for the pure-tone thresholds, only the speech reception threshold of the better ear was considered in the analysis.
Speech reception in noise
Older adults frequently report difficulties in understanding speech in noisy conditions even if their hearing is clinically normal (Committee on Hearing, Bioacoustics and Biomechanics (CHABA), Citation1988). Therefore, speech understanding in noise adds important information on the process of auditory aging, specifically in those participants with asymmetrical hearing loss. Moreover, a measure of speech perception ability in noise may be of particular relevance given that patients following EST are likely to perform auditory judgments about speech in everyday noisy conditions.
In this study, the speech reception threshold in noise was defined as the signal-to-noise ratio in dB at which listeners can correctly repeat 50% of keywords in sentences that are presented in speech-shaped noise. To determine the speech reception threshold (SRT), we applied an adaptive staircase procedure. That is, individual performance was kept around 50% correct by continually changing the noise level depending on the accuracy of the participant's previous response. In total, the task consisted of 15 test sentences each containing four keywords. All sentences were taken from standard Dutch-language audiology materials (Plomp and Mimpen, Citation1979). Participants were asked to repeat all the words in a sentence they had understood. Participants were encouraged to guess. After each trial, the number of correct responses (ranging from 0 to 4) was immediately scored online by an experimenter.
Cognitive measures
With the exception of auditory short-term memory, which is an auditory task in nature, all tasks to measure linguistic and cognitive skills were presented visually. This was done to avoid confounding effects of auditory sensitivity on older adults’ performance on linguistic and cognitive tasks.
Auditory short-term memory
Performance on an auditory non-word repetition task is generally used as an index of verbal/auditory short-term memory (e.g. Gathercole, Citation1999). Note, however, that non-word repetition depends on accurate perception of stimuli and, consequently, also reflects differences in auditory abilities. In the auditory short-term memory task, participants were instructed to repeat non-words. Each non-word was presented once at a fixed mean intensity of 80 dB SPL. Stimuli were provided via E-prime 1.2 (Schneider et al., Citation2002). The speaker was a female native speaker of Dutch. All items had been produced at a slow and clear speaking rate. The task consisted of 50 non-words that were phonotactically legal in Dutch and varied in length from two to five syllables (including two practice trials). Non-words were presented in mixed order (regardless of length), but the order was kept constant for all participants. Time between consecutive trials was 3 seconds. Verbal responses were digitally recorded and rated by a single native speaker of Dutch. If a non-word was repeated correctly, the item received a rating of 1. If not, the proportion of correctly repeated syllables was calculated. Consequently, participants could achieve a maximum score of 48. Higher scores reflected better performance. To assess reliability of the rating of the non-word repetition performance, we asked a second evaluator to rate a random subsample of 15 audio recordings (i.e. to rate task performance of 15 participants) from our participant pool. Tukey's test of non-additivity showed no interaction between raters and subjects (F = 1.69, df1 = 1, df2 = 13, P = 0.216), indicating that the reliability analysis should yield unbiased results. Scoring of the non-word-repetition task had an excellent inter-rater reliability as assessed by the average measure intra-class correlation coefficient in a two-way random model (ICC = 0.968, df1 = 14, df2 = 14, P < 0.001).
Working memory
Participants performed a digit span backward task as a measure of working memory capacity. The test was a computerized variant of the digit span backward task included in the Wechsler Adult Intelligence Scale Test (Citation2004) and presented via E-prime 1.2 (Schneider et al., Citation2002). Participants were asked to report a series of visually presented digits back in reverse order; for example, if they received the sequence 5–9–2, participants had to type in 2–9–5. Digits were presented in black font (Arial, font size 100) against a white background. Each digit was presented for 1 second with an interval of 1 second between the consecutive digits of a series. The length of sequences increased stepwise from two to seven digits and performance on each length was tested by two different trials. The start of the measurement was preceded by two trials with a sequence-length of three to familiarize participants with the task. In total, participants had to recall 12 test sequences and individual performance was measured by the proportion of correctly reported sequences (out of 12).
Information processing speed
Information processing speed was assessed by means of a digit-symbol-substitution task, which was derived from the Wechsler Adult Intelligence Scale Test (Citation2004). The digit-symbol-substitution task is a paper-and-pencil test in which participants have to convert as many digits as possible into assigned symbols (1 = ‘−’ 2 = ‘⊥’ 3 = ‘⊐’ 4 = ‘⌞’ 5 = ‘⊔’ 6 = ‘○’ 7 = ‘∧’ 8 = ‘×’ 9 = ‘=’) in a fixed amount of time. For example, in the box below a '9′, participants have to fill in the ‘=’ symbol. The digit-symbol key was printed at the top of the page and visible to the participant throughout the task. In total, the task consisted of 140 items of which the first seven items served as practice trials. Performance was measured by the number of correctly converted digits in 90 seconds, so that higher scores reflected higher information processing speed.
Linguistic measures
Language proficiency
A cloze test was administered to obtain a global measure of language competence. Cloze tests are assumed to measure integrative language proficiency, because knowledge of vocabulary, grammar, sentence structure, text structure, and cohesion have to be integrated to perform such a task (e.g. Hanania and Shikhani, Citation1986). Our paper-and-pencil test consisted of three short texts, which did not overlap in content. Readability index scores of the three different paragraphs indicated that two paragraphs were relatively easy and that one was relatively difficult. Paragraphs were printed in order of ascending reading difficulty to create a measure of language proficiency that took reading speed as well as reading comprehension into account. The first and third cloze text contained 13 blanks and the second included 14 blanks. In total, 40 content words had been removed and participants were asked to fill in the blanks. Participants had to fill in one word for each missing item and they were free to choose appropriate words. They were only instructed not to reuse words. Participants were given 5 minutes to complete the task.
The maximum total score on the cloze test was 80 points. Participants obtained two points per item if the selected word matched the grammatical and semantic structure of the sentence. If a response was in line with either the grammatical or semantic context, it received a one-point credit. Items were scored as wrong (0 points) if more than one word had been inserted, a word had been reused or blanks had been left empty. All tests were rated by one single rater. To assess the reliability of the scoring of the cloze test, we had a second rater score a subset of 15 randomly selected tests. Tukey's test of non-additivity was non-significant (F = 4.10, df1 = 1, df2 = 13, P = 0.064), indicating no interaction between raters and subjects and, hence, unbiased results of the reliability analysis. The scoring had a very high reliability assessed by the average measure intra-class correlation coefficient in a two-way random model (ICC = 0.996, df1 = 14, df2 = 14, P < 0.001).
Vocabulary
A vocabulary test in the form of multiple choice questions was administered to obtain a measure of linguistic knowledge (Andringa et al., Citation2012). The computerized test was administered in Excel (Courier font size 15). Participants had to indicate which out of five possible answers was the correct meaning of Dutch low-frequency words, the last alternative always being ‘I don't know’. Words were not domain-specific and each target word was embedded in a different, neutral carrier phrase. The vocabulary test consisted of 60 items. There was no time limit or pressure to complete the test. Performance was measured by test accuracy, that is, the proportion of correct answers. Higher scores thus reflected greater vocabulary knowledge.
Speech discrimination test
Materials
We administered a shortened version of the ADT (Beijer et al., Citation2011). The original ADT consists of five subtests, each aiming to measure auditory discrimination of a specific speech dimension relevant for speech therapy, particularly the dimensions that are trained in EST. Subtests include discrimination of speech segments, intensity, overall pitch, speech rate, and intonation. EST focuses on these speech dimensions in order to improve speech intelligibility and to avoid voice strain, according to the principles of the pitch limiting voice treatment (de Swart et al., Citation2003) which is adapted from the Lee Silverman voice treatment (Ramig et al., Citation1996) (for more details, see Beijer et al., Citation2011). The shortened test included three out of five subtests, that is the subtests on ‘loudness’, ‘overall pitch’, and ‘speech rate’ corresponding with the perception of the amplitude, frequency, and time domains in speech. We excluded the subtests ‘segmental elements’ and ‘intonation’ because both subtests match specific therapy goals for dysarthria. Although these aspects may be clinically important, they were considered less general than the three-dimension loudness, pitch, and speech rate. (The subtest ‘segmental elements’ focuses on the discrimination between a regular vowel or consonant and a deviant counterpart typically found in dysarthric speech (e.g. difference between regular vowel [a:] and a sound in between [a:] and [ə]). As monopitch is characteristic of (hypokinetic) dysarthric speech, the subtest intonation focuses on the discrimination of different versions of an F0 peak, indicating different amounts of relative prominence of a sentence accent.).
The ADT consists of simple ‘same-different’ decisions. Per trial, participants hear two realizations of a word or sentence and have to indicate whether these are same or different by clicking on buttons that are marked on a keyboard (green = ‘same’, red = ‘different’). The ADT contains two versions, one for men and women, respectively. Versions differ only with respect to speaker gender in the subtest ‘overall pitch’. That is, male participants listen to a 66-year-old male speaker and female participants to a 62-year-old female speaker for this specific subtest. Both speakers are native speakers of Dutch. Speech rate has been equalized for all utterances to avoid speaker-intrinsic speech rate differences. Speech materials that are used in the subtests loudness and speech rate have been produced by the male speaker. The subtests loudness and overall pitch each contain seven words and eight sentences, whereas discrimination of speech rate is only assessed with sentences. Sentences stem from screening materials typically used in auditory testing in the Netherlands that are of acceptable length (seven to nine syllables) and cover neutral semantic content (Plomp and Mimpen, Citation1979). Word stimuli in the ADT are commonly known Dutch words that occur with a minimum frequency of 50 in the CELEX corpus of written Dutch (Baayen et al., Citation1995; Beijer et al., Citation2011).
Each subtest is built up of 15 items: seven equal and eight unequal pairs. Unequal pairs are based on slightly adjusted just noticeable differences. That is, unequal test items were constructed to be detectable as different in at least 80% of the cases. In the subtest ‘loudness’, mean intensity of stimuli has been adjusted to 65 dB. To create unequal pairs, mean intensity of the second stimulus has been raised to 71 dB (74 dB in one case). In the subtest ‘overall pitch’, changes in pitch can be higher or lower. Higher pitch versions of a stimulus have been created by raising the original pitch by four semitones (three semitones in the female version). Naturally sounding pairs of lower pitch have been created by raising the first (default) stimulus by two and lowering the second stimulus by five semitones (four semitones in the female version) (for further details on the stimuli, see Beijer et al., Citation2011). In the subtest ‘speech rate’, natural sounding manipulations have been derived by asking the speaker to produce stimuli in a slightly faster or slower speech rate. These natural variations in speech rate have then been increased by additionally accelerating or decelerating the overall rate by 5%.
Procedure
The ADT was carried out in E-prime 1.2 (Schneider et al., Citation2002) and followed the procedure described in Beijer et al. (Citation2011). The ADT is a self-paced test and decisions can be made before the end of the second realization. Once a decision is made, presentation of the second stimulus is terminated if needed, and the next trial starts after 2500 ms. The interstimulus interval between the two realizations of a word or sentence is 200 ms. Each subtest starts with an information screen to highlight the specific speech dimension that is going to be discriminated, after which two practice trials follow. In the practice trials, participants receive feedback whether the stimuli differ and if so, in which direction (e.g. for pitch: ‘The second item was lower than the first item’). All subtests and items are presented in a fixed order. The subtest ‘loudness’ is followed by the subtests ‘overall pitch’ and ‘speech rate’. Within each subtest, words are discriminated before sentences. Participants took approximately 4 minutes to complete a subtest. Overall, 10–15 minutes were sufficient to accomplish the shortened version of the ADT. Because one of the subtests assessed loudness discrimination, the presentation level of the stimuli ranged between 75 and 80 dB SPL. Presentation of stimuli in the subtests ‘overall pitch’ and ‘speech rate’ was set to a fixed volume of 75 dB SPL, ensuring sufficient audibility for all participants. All stimuli were presented binaurally via dynamic closed, circumaural headphones (Sennheiser HD 215).
Two different measures of performance were derived from the ADT: the overall percentage of correctly discriminated items (equal pairs stated as ‘same’, unequal pairs stated as ‘different’) as an index of discrimination accuracy, and reaction times for all correct same–different decisions as a measure of discrimination speed. We considered discrimination accuracy to be the most appropriate estimate to explore how speech discrimination ability relates to auditory and cognitive functioning in a factor analysis. Additionally, to investigate speech discrimination performance in more detail, we analyzed both discrimination accuracy and discrimination response times in a regression analysis. The latter analysis method allowed us to investigate whether performance differed for the subtests, and whether certain abilities were more predictive of performance in one subtest, compared with another. Note that we administered the ADT exactly as it is used in the clinical setting. That is, participants were informed that they could respond before the offset of the second stimulus; however, they were not specifically instructed to respond as quickly as possible. Therefore, participants’ reaction times may not accurately reflect response speed and must be interpreted with caution. Still, although participants could wait for the second stimulus to finish, all participants responded before stimulus offset at least incidentally (52.1% of the responses to the sentence stimuli were given before stimulus offset). This suggests that the response times reflected the moment in time at which participants were confident of their discrimination decision. Discrimination accuracy was determined for overall performance. Discrimination speed was defined as the time difference between the onset of the second realization and the subsequent button press. Higher reaction times (RTs) indicated slower performance.
General procedure
Measurements were collected in two experimental sessions. Between both sessions was an interval of 2 months, because the measures were administered in the context of other studies. Measures of hearing acuity, auditory short-term memory, working memory, information-processing speed, and vocabulary were obtained during the first experimental session. Tasks of auditory discrimination, speech reception threshold in quiet, and in noise and language proficiency were carried out during the second experimental session. Before the start of each task, participants received verbal and printed task instructions. Specifications of age and education level were available from the subject database of the Max Planck Institute for Psycholinguistics from which participants were recruited. All tasks were presented in a fixed order. Participants were compensated €8 per hour for their participation.
Data analyses
The study set out to explore the associations between auditory speech discrimination, on the one hand and auditory, cognitive, and linguistic abilities, on the other. As a first step, we explored the correlations between auditory discrimination accuracy and auditory, cognitive, and linguistic measures. As a second step, we determined the general structure underlying all measures by means of exploratory factor analysis. By assessing which measures load on the same latent constructs, we aimed to identify whether auditory discrimination of acoustic properties in speech is generally more closely related to auditory, cognitive, or linguistic abilities, without targeting any a priori hypothesis. We used principal axis factoring as the measured variance in our data is a combination of shared and error variance. As education level was measured on an ordinal scale, we tested whether the use of polychoric correlations would be required. Education level had a skewness of −0.71 and a zero-centered kurtosis of −0.095. These indices were well below the critical value of 1 (in absolute value) (Muthén and Kaplan, Citation1985), such that the use of Pearson's correlation coefficients was warranted. Varimax rotation was applied in order to facilitate interpretation and labeling of the factors. Factor loadings can be considered as correlation coefficients; however, the standard error of factor loadings is greater than that of a typical correlation coefficient (Cliff and Hamburger, Citation1967). Therefore, we adopted a conservative alpha level of 1% to assess the significance of factor loadings. Given a sample size of 96 and a significance level of 0.01, only factor loadings greater than 0.262 were considered significant.
Before we conducted the factor analysis, we assessed whether the criteria for factor analysis were met. We tested for possible influential cases by estimating Cook's distance between auditory discrimination performance and each of the significantly correlated background measures. That is, Cook's distance was calculated on the basis of a linear regression model in which discrimination accuracy was predicted as a function of one background measure at a time. In all cases, Cook's distance was below the critical value of 1 (Cook and Weisberg, Citation1982), indicating no unduely influential participants. One data point of education level was missing and was replaced by the corresponding mean. Factorability of items was assessed by screening the one-tailed intercorrelations between variables. All measures correlated significantly with at least four other variables while no correlation was higher than 0.8, therefore implying reasonable factorability. Factorability of items was confirmed by the determinant of the correlation matrix. A determinant value of 0.17 (well above the critical value of 0.00001) suggested no singularity between included variables. Furthermore, Bartlett's test of sphericity was significant (χ255 = 337.250, P < 0.001), such that the assumption of uncorrelated measures in the analysis could be rejected. Sampling adequacy was verified by a Kaiser–Meyer–Olkin value of 0.79, indicating that factor analysis should yield distinct and reliable factors. Further, inspection of the anti-image matrix showed that sampling adequacy was sufficient for each given pair of variables as each pair had a value above the critical value of 0.5, such that the factor analysis could be conducted with all 11 variables included.
In a third step of the analysis, we investigated which individual auditory, cognitive, and linguistic abilities predicted listeners’ (a) discrimination accuracy and (b) discrimination speed by means of multiple regression analysis. In the linear regression analysis, we took into account that the associations between discrimination performance and individual abilities may be modulated by speech dimension (pitch, loudness, or speech rate) or length of speech stimuli (words vs. sentences). As the subtest speech rate only consisted of sentences, we first conducted an analysis to investigate possible interactions between background measures and the three speech dimensions, and we then conducted an analysis to investigate possible interactions between background measures and stimulus length.
Linear regression models are based on the assumption that predictors included in the analysis do not show collinearity (Baayen, Citation2012). This assumption was obviously not met as many predictor measures in this study were intercorrelated (see ). However, if the aim is to assess the unique explanatory power of a predictor beyond that of other predictors, simultaneous inclusion of correlated measures in the analysis has been argued to be the way to proceed (e.g. Wurm and Fisicaro, Citation2014).
We implemented linear mixed-effects models using the lmer function from the lme4 package (Bates et al., Citation2012) in R, as linear mixed-effect models can contain multiple independent variables including categorical and continuous predictors at the same time (Cunnings, Citation2012). Moreover, mixed-effect models allow for the inclusion of both participants and items as crossed random factors and, by including random slopes, it can additionally be assessed whether any fixed effects generalize over items/participants (Baayen et al., Citation2008). In the discrimination accuracy analysis, logistic regression was used (as an answer could be correct or not).
To identify the most parsimonious model explaining individual discrimination performance, we applied the same model fitting process across all regression analyses. First, we explored whether speech dimension (respectively stimulus length) had a general impact on discrimination performance by inserting subtest (respectively stimulus length) as a fixed categorical variable into the initial model. In models predicting discrimination speed, we also included stimulus duration (in ms) as a control variable. In the second step, all predictor measures and their interactions with subtest (respectively stimulus length) were added simultaneously to the model. We then analyzed our data by means of a backward stepwise selection procedure, in which first interactions and then predictors were removed if they did not attain significance at the 5% level. Each change in the fixed effect structure was evaluated in terms of loss of model fit by means of a likelihood ratio test.
After we had determined the most parsimonious fixed-effect structure, we identified the maximal random slope structure to allow for the fact that different participants and different items may vary with regard to how sensitive they are with respect to the variable at hand (Barr et al., Citation2013). Determining the maximal random slope structure reduces the probability of a type I error (Barr et al., Citation2013): if, for example, speech dimension only matters for some, but not generally across participants, it should be removed from the fixed effect structure. First, the effect of subtest (respectively stimulus length) was allowed to vary by participant. Second, by-item slopes were tested for all predictors in the preliminary model. Changes in the random-slope structure were evaluated by means of changes in the Akaike Information Criterion (AIC). The model with the lower AIC value and, therefore, better model fit was retained. If fixed effects did not retain significance after the maximal random slope structure had been defined, these were excluded from the fixed-part of the model following the backward stepwise procedure. Results of the most parsimonious models are indicated in absolute effect sizes (beta), standard errors, t values (or z values in logistic regression) and P values. As it is currently unclear how to calculate the proportion of the variance that is accounted for by mixed-effect models with random slopes, no measure of explained variance can be reported.
The statistical software package SPSS (version 20.0.0.1) was used to obtain descriptive statistics, correlations, and to run the factor analysis. The R statistical program (version 2.15.1) was used to run linear regression models.
Results
Overall, participants achieved high accuracy scores on the ADT. Mean proportion of correctly discriminated items was 94.95% (SD = 5.6), showing relatively little variation in overall performance (coefficient of variation = 0.06). On average, participants took 1.88 s (SD = 0.64) to correctly discriminate items, indicating reasonable variability in discrimination speed (coefficient of variation = 0.34). Mean discrimination performances in terms of accuracy and efficiency are displayed in for the different stimulus lengths and subtests.
Table 2. Mean discrimination performance per stimulus length and subtest
Associates of discrimination performance
Pearson's correlation coefficients were obtained for all pairs of measures and coefficients are displayed in . Overall accuracy on the auditory discrimination task correlated significantly with measures of speech understanding in noise, language proficiency, information processing speed and age, and marginally with measures of working memory and vocabulary knowledge. We calculated partial correlations for discrimination accuracy and language proficiency, as discrimination performance and language proficiency were both significantly associated with processing speed, age, and education. As the partial correlation between auditory discrimination and language proficiency remained significant (r90 = 0.174, P = 0.048), auditory discrimination of acoustic properties in speech seems to have a consistent linguistic component.
Table 3. Pearson's correlation coefficients (and corresponding p values) between auditory, cognitive, and linguistic measures (n = 96)
With respect to intercorrelations between predictor measures, moderate correlations were found between non-word repetition and measures of auditory abilities. This supports the idea that non-word repetition, which is supposed to index memory abilities, also reflects auditory functioning if participants differ in hearing sensitivity. Less obvious correlations were observed between hearing thresholds in quiet and the measure of language proficiency and between hearing sensitivity and information processing speed. These intercorrelations disappeared after controlling for age. Age was significantly correlated to all measures except vocabulary knowledge and education level.
Discrimination performance in relation to auditory, cognitive, and linguistic skills (factor analysis)
Three factors were extracted based on Kaiser's criterion of eigenvalues <1. The number of latent constructs was in agreement with visual inspection of the scree plot. All factors together explained 49.5% of the variance. The factor loadings used to label the factors are given in . The first factor accounted for 22.4% of the total variance and was labeled ‘auditory functioning’. The second factor accounted for 14.0% of the total variance and was labeled ‘processing efficiency’. The third factor was considered to represent ‘linguistic skills’ and accounted for 13.1% of the total variance.
Table 4. Summary of principal factor analysis after varimax rotation (n = 96)
Auditory discrimination performance showed cross loadings on the factors processing efficiency (=0.316) and linguistic skills (=0.323) but did not load on the factor of auditory functioning. This suggests that discrimination of acoustic properties in speech is generally more closely related to cognitive and linguistic processing than to auditory functioning.
However, two participants in the sample scored below the 80% criterion in the ADT (71.1% and 73.3% accuracy) and, thus, more than three standard deviations below the mean. Although our pre-analysis indicated no undue influential participants (see section Data Analyses), we reran the factor analysis excluding both participants, as they may be considered as outliers. Exclusion of the two participants resulted in a loss of the significant relationships between discrimination accuracy and the background measures. Hence, these participants were driving the loadings of discrimination accuracy on the factors of ‘processing efficiency’ and ‘linguistic skills’. As factor analysis is prone to the influence of outliers (with only one data point per subject), we applied mixed-effect models in a next step to assess the associations between discrimination performance and the background measures in more detail. Mixed-effect models are based on individual observations within a task and, hence, several data points are included per participant. Moreover, by including random slopes, we allowed for the possibility that participants and/or items were differentially affected by a given predictor. This approach is conservative and prevents effects to be driven by single participants or single items.
Predictors of discrimination performance (linear regression analysis)
Overall, participants produced 4102 correct and 218 incorrect responses. RTs were analyzed for accurate trials only. Valid RTs were restricted to those within three standard deviations from the mean RT (of all correct responses). Therefore, the final data set for predicting discrimination accuracy consisted of 4320 observations and the final data set for predicting discrimination speed consisted of 4076 observations.
Older adults' discrimination accuracy was modulated by speech dimension: listeners made more errors in discriminating pitch and speech rate, compared with their performance on the subtest intensity (placed on the intercept). Moreover, listeners who could perceive speech at less favorable signal-to-noise ratios tended to be better able to perceive acoustic differences in the speech stimuli. None of the other measures predicted discrimination accuracy or interacted with subtest. The maximal random slope structure showed that listeners differed in the degree to which their discrimination accuracy was affected by changes in speech dimension.
In contrast to speech dimension, stimulus length had no effect on discrimination accuracy. That is, listeners did not make more errors in discriminating sentences than in discriminating words across the subtests intensity and pitch. Overall, the only predictor of discrimination accuracy was language proficiency: the better listeners' language proficiency, the higher was their discrimination accuracy ().
Table 5. Statistical models for discrimination accuracy as a function of subtest and stimulus length*
The most parsimonious model predicting response times on the basis of speech dimension included duration, speech dimension, information processing speed and an interaction between listeners' speech perception threshold in quiet and speech dimension. As expected, the longer the stimuli, the longer were the RTs. Moreover, listeners were slower in discriminating speech rate than in discriminating intensity, which makes sense as a longer stretch of speech is needed to evaluate speech rate than intensity. This effect was modulated by individuals' speech reception threshold in quiet, suggesting that listeners with better speech recognition in quiet sped up more in discriminating the intensity of speech stimuli compared with their performance in discriminating speech rate and pitch, than those with worse speech recognition. Overall, participants with higher processing speed made accurate discrimination decisions faster. The maximal random slope structure indicated that the older adults differed in the degree to which their discrimination speed was affected by a change in speech dimension. Moreover, the maximal random slope structure included effects of processing speed, working memory and vocabulary knowledge on item, suggesting that the effects of these measures on the speed of discrimination decisions differed across speech stimuli.
The best fitting model predicting discrimination speed on the basis of stimulus length (words vs. sentences for the pitch and intensity stimuli) included stimulus length, processing speed, working memory, and the interaction between stimulus length and these predictors. As can be expected, participants generally took longer to make the discrimination decision when they listened to sentences than to words. Further, the faster participants’ processing speed, the more efficient their word discrimination was. Word discrimination performance was also marginally supported by working memory. However, these cognitive skills effects were modified by stimulus length: the contributions of processing speed and working memory observed in the discrimination of words were effectively cancelled in the discrimination of sentences. The maximal random slope structure indicated that listeners varied in the degree to which their discrimination speed was influenced by a change from words to sentences. Moreover, listeners' pure-tone thresholds showed a random slope on item, suggesting that discrimination of some speech stimuli was affected by hearing sensitivity (We also reran the regression analyses without the two participants scoring below the 80% criterion of the ADT. All associations between discrimination performance and both cognitive and linguistic measures remained consistent, indicating that the reported effects were not driven by single participants or single items.) ().
Table 6. Statistical models for the response times as a function of subtest and stimulus length*
Discussion
This study was set up to assess the relationship between auditory discrimination performance on speech materials and measures of auditory, cognitive, and linguistic functioning in healthy older people. Discrimination of intensity, pitch, and speech rate were assessed in the context of meaningful words and sentences, as well-established methods in dysarthria rehabilitation, such as the Lee Silverman Voice Treatment (Ramig et al., Citation1996) and the Pitch Limiting Voice Treatment (de Swart et al., Citation2003), encourage patients to speak loud, low and/or slow to increase their speech intelligibility. Ninety-four out of 96 healthy participants discriminated more than 80% of items correctly, thereby demonstrating that healthy older adults are generally able to perceive acoustic differences on relevant dimensions and on relevant materials for speech therapy. This shows that discrimination tasks can be applied in speech and language therapy in older adults.
Due to participants’ high performance level on the ADT, relatively little variation could be observed in discrimination accuracy. Despite this limitation, individual characteristics explained variability in discrimination performance, thus pinpointing abilities that differentiate between good and excellent performers. As these abilities are predictive of small performance differences here, they may be expected to also account for variation among more heterogeneous populations.
Overall, this study suggests that perception of acoustic differences in speech is more closely related to cognitive processing and linguistic skills than to auditory abilities, as evidence for the association between auditory discrimination and both cognitive and linguistic skills converges from both the factor and the regression analysis. In the exploratory factor analysis, discrimination accuracy loaded on factors of processing efficiency and linguistic skills but was not associated with a third factor of auditory functioning. Even with mild-to-moderate hearing loss, older adults were able to reach high accuracy scores, suggesting that stimulus audibility was sufficient for successful discrimination. Importantly, discrimination speed was not affected by hearing abilities either. This implies that peripheral hearing sensitivity barely plays a role in discrimination tasks that are relevant for speech therapy, as long as participants’ hearing is as good as in the present sample (note that approximately 95% of adults in this age range have a hearing status within the hearing range observed in this study). Therefore, our results suggest that how suitable discrimination-based approaches in speech and language therapy will be for patients cannot simply be predicted from individuals’ sensory functioning.
Apart from peripheral hearing loss, auditory aging is also characterized by difficulties in understanding speech in noisy conditions. Although we did not find an effect of hearing sensitivity, listeners’ speech understanding in noise predicted their discrimination accuracy, indicating that central auditory processing, rather than peripheral auditory processing, relates to discrimination performance. However, as measures of speech understanding in noise and of auditory discrimination performance load on different factors, this suggests that auditory discrimination of speech indeed mainly taps cognitive and linguistic skills.
The association between auditory discrimination of speech materials and general cognitive processing is in line with previous literature on non-speech stimuli, implying that in behavioral tasks of auditory processing no clear distinction between auditory processing and cognitive functions can be made (e.g. Humes et al., Citation2012). Processing speed seems to be particularly important for discrimination performance, as it is associated with discrimination accuracy and discrimination speed. Further, participants with better working memory are faster in correctly discriminating words and tend to be more accurate in their overall performance. However, no effect of auditory short-term memory on discrimination performance was found. Thus, discrimination performance seems to be associated with complex processes of simultaneous storage and processing rather than auditory short-term memory which primarily reflects a storage component (Gathercole, Citation1999).
Note that processing speed and working memory only predicted discrimination speed in the discrimination of words, rather than sentences. This may be counterintuitive at first, as sentence processing may be expected to place more demands on processing speed and working memory. However, as participants were not instructed to respond as quickly as possible, discrimination of words may have been more sensitive to effects of processing speed than that of sentences because the latter are obviously longer in duration than words. Moreover, participants' task was to extract and compare representations of tested speech dimensions (i.e. intensity, overall pitch, and speech rate). Sentences provide a richer informational context than words to extract these characteristics. In word discrimination, participants have less time or structural information to derive a good internal representation of the speech dimension. Therefore, the use of longer speech stimuli such as simple sentences may be particularly recommended in the treatment of individuals with poorer working memory capacity or slower cognitive processing.
Furthermore, our results indicate that discrimination of speech stimuli not only engages general cognitive processes but also linguistic skills. Note that all discrimination tasks could have been performed in a foreign language, as the linguistic content of the speech signal was not relevant for the discrimination decision itself. Therefore, the finding that the perception of acoustic differences between speech stimuli is associated with individual linguistic performance suggests that listeners routinely process the available linguistic information. Proficient language users may perform the discrimination tasks with more ease as they need less cognitive resources for the task of linguistic processing even when processing high-frequency words or relatively common sentences. This cognitive trade-off effect may particularly emerge in older adults. Many participants in our study experienced some degree of hearing loss (be it slight), and were, therefore, exposed to a degraded speech signal. Previous research has shown that linguistic experience such as higher vocabulary knowledge facilitates the processing of degraded speech (Janse and Adank, Citation2012; McAuliffe et al., Citation2013; Neger et al., Citation2014) and that this effect is not influenced by word frequency (McAuliffe et al., Citation2013). In therapy settings, it may thus be beneficial for patients with poorer language proficiency to start with discrimination tasks with simple stimuli (e.g. evaluating the production of prolonged vowels or fricatives).
Our finding that perception of acoustic differences in speech seems to be more related to cognitive and linguistic skills than to auditory abilities may have some important clinical implications. Note that we observed these associations testing neurologically intact older adults in a non-distracting setting. The impact of these cognitive and linguistic skills on auditory discrimination ability may become even more prominent under less ideal listening conditions, such as performing auditory discrimination tasks in a clinical setting where therapy is unlikely to take place without interfering background noises, where patients are commonly asked to produce and compare utterances simultaneously, and where patients often have to analyze more than one speech dimension at the same time. Considering the relationship between speech understanding in noise and discrimination accuracy, a quiet non-distracting environment seems to be essential in order to apply auditory discrimination tasks in therapy effectively. Furthermore, the use of recording facilities may be recommended to record patients’ speech during therapy. By doing so, we hypothesize that patients can first concentrate on producing the target utterances and, thereby, familiarize with the linguistic content. In a subsequent step, the speech and language therapist can ask patients to compare their own speech with the target speech. This approach is similar to the procedure implemented in EST (Beijer et al., Citation2010). Moreover, rehabilitation may be more effective if patients are asked to concentrate on just one defined speech dimension. As fewer errors were made in discriminating intensity than in discriminating both pitch and speech rate, this suggests that listeners are most familiar with the loudness dimension, which can therefore best be used as the dimension to familiarize patients with discrimination tasks.
The ADT described in this study was developed to assess whether individuals with dysarthria qualify for EST. It is crucial to take patient abilities into account when designing and implementing eHealth services, as patient abilities form a key human factor in utilization and acceptance of telemedicine programs (Brennan and Barker, Citation2008). By assessing which individual abilities are associated with performance on the ADT in healthy older adults, this study provides first starting points for the importance of patients’ perceptual, cognitive, and linguistic skills for EST. At the same time, the question arises whether the observed pattern of associations generalizes to clinical populations and if so, whether patients with better cognitive and linguistic performance and, hence better auditory discrimination skills, may benefit more from discrimination-based approaches of speech and language therapy than patients with poorer cognitive and linguistic performance. These aspects were not explored in this study but may be considered for future clinical research.
Disclaimer statements
Contributors Thordis Neger was intensively involved in literature search, research design, experiment preparation, data collection, data analyses, and article preparation. Esther Janse was intensively involved in the research design, data analyses, and article preparation. Toni Rietveld was intensively involved in data analyses and article preparation, and contributed to the research design.
Funding This study was supported by a Vidi grant from the Netherlands Organization for Scientific Research (NWO) (project number 276-75-009) awarded to the second author.
Conflicts of interest None.
Ethics approval The authors declare that the study followed principles in the Declaration of Helsinki.
References
- American Speech-Language-Hearing Association. 1996. Central auditory processing: current status of research and implications for clinical practice. (Technical Report). Available from www.asha.org/policy. doi:10.1044/policy.TR1996-00241.
- Andringa S., Olsthoorn N., van Beuningen C., Schoonen R., Hulstijn J. 2012. Determinants of success in native and non-native listening comprehension: an individual differences approach. Language Learning, 62: 49–78. doi:10.1111/j.1467-9922.2012.00706.x.
- Baayen H., Piepenbrok R., Gulikers L. 1995. The CELEX database consortium (CD-ROM). Linguistic data. Nijmegen, The Netherlands: Max Planck Institute for Psycholinguistics.
- Baayen R.H. 2012. Analyzing linguistic data: a practical introduction to statistics using R. 6th ed. Cambridge: Cambridge University Press.
- Baayen R.H., Davidson D.J., Bates D.M. 2008. Mixed-effects modeling with crossed random effects for subjects and items. Journal of Memory and Language, 59: 390–412. doi:10.1016/j.jml.2007.12.005.
- Barr D.J., Levy R., Scheepers C., Tily H.J. 2013. Random effects structure for confirmatory hypothesis testing: keep it maximal. Journal of Memory and Language, 68: 255–278. doi:10.1016/j.jml.2012.11.001.
- Bates D., Maechler M., Bolker B. 2012. lme4: Linear mixed-effects models using S4 classes (Version 0.999-0). Available from: http://CRAN.R-project.org/package=lme4
- Beijer L.J., Rietveld A.C., van Stiphout A.J. 2011. Auditory discrimination as a condition for E-learning based Speech Therapy: a proposal for an auditory discrimination test (ADT) for adult dysarthric speakers. Journal of Communication Disorders, 44( 6): 701–718. doi:10.1016/j.jcomdis.2011.05.002.
- Beijer L.J., Rietveld T.C.M., van Beers M.M.A., Slangen R.M.L., van den Heuvel H., de Swart B.J.M., et al. 2010. E-learning-based speech therapy: a web application for speech training. Telemedicine Journal and E-health, 16: 177–180. doi:10.1089/tmj.2009.0104.
- Bosman A. 1989. Speech perception by the hearing impaired [ doctoral dissertation]. Utrecht University, The Netherlands.
- Brennan D.M., Barker L.M. 2008. Human factors in the development and implementation of telerehabilitation systems. Journal of Telemedicine and Telecare, 14( 2): 55–58. doi:10.1258/jtt.2007.007040.
- Cliff N., Hamburger C.D. 1967. Study of sampling errors in factor analysis by means of artificial experiments. Psychological Bulletin, 68( 6): 430–445. doi:10.1037/h0025178.
- Committee on Hearing, Bioacoustics and Biomechanics (CHABA). 1988. Speech understanding and aging. Journal of the Acoustical Society of America, 83: 859–895.
- Cook R.D., Weisberg S. 1982. Residuals and influence in regression. New York: Chapman & Hall.
- Cox L.C., McCoy S.L., Tun P.A., Wingfield A. 2008. Monotic auditory processing disorder tests in the older adult population. Journal of the American Academy of Audiology, 19( 4): 293–308. doi:10.3766/Jaaa.19.4.3.
- Cruickshanks K.J., Wiley T.L., Tweed T.S., Klein B.E., Klein R., Mares-Perlman J.A., et al. 1998. Prevalence of hearing loss in older adults in Beaver Dam, Wisconsin: the epidemiology of hearing loss study. American Journal of Epidemiology, 148: 879–886. doi:10.1093/oxfordjournals.aje.a009713.
- Cunnings I. 2012. An overview of mixed-effects statistical models for second language researchers. Second Language Research, 28: 369–382. doi:10.1177/0267658312443651.
- de Swart B.J.M., Willemse S.C., Maassen B.A.M., Horstink M.W.I.M. 2003. Improvement of voicing in patients with Parkinson's disease by speech therapy. Neurology, 60: 498–500. doi:10.1212/01.WNL.0000044480.95458.56.
- Fogerty D., Humes L.E., Kewley-Port D. 2010. Auditory temporal-order processing of vowel sequences by young and elderly listeners. Journal of the Acoustical Society of America, 127: 2509–2520. doi:10.1121/1.3316291.
- Gathercole S.E. 1999. Cognitive approaches to the development of short-term memory. Trends in Cognitive Sciences, 3( 11): 410–419. doi:10.1016/S1364-6613(99)01388-1.
- Gopinath B., Schneider J., Hartley D., Teber E., McMahon C.M., Leeder S.R., et al. 2011. Incidence and predictors of hearing aid use and ownership among older adults with hearing loss. Annals of Epidemiology, 21( 7): 497–506. doi:10.1016/j.annepidem.2011.03.005.
- Hanania E., Shikhani M. 1986. Interrelationships among 3 tests of language proficiency – standardized Esl, Cloze, and Writing. Tesol Quarterly, 20( 1): 97–109. doi:10.2307/3586391.
- Harris K.C., Eckert M.A., Ahlstrom J.B., Dubno J.R. 2010. Age-related differences in gap detection: effects of task difficulty and cognitive ability. Hearing Research, 264: 21–29. doi:10.1016/j.heares.2009.09.017.
- Humes L.E. 2005. Do ‘auditory processing’ tests measure auditory processing in the elderly? Ear and Hearing, 26: 109–119. doi:10.1097/00003446-200504000-00001.
- Humes L.E., Dubno J.R., Gordon-Salant S., Lister J.J., Cacace A.T., Cruickshanks K.J., et al. 2012. Central presbycusis: a review and evaluation of the evidence. Journal of the American Academy of Audiology, 23( 8): 635–666. doi:10.3766/jaaa.23.8.5.
- Idrizbegovic E., Hederstierna C., Dahlquist M., Kampfe Nordstrom C., Jelic V., Rosenhall U. 2011. Central auditory function in early Alzheimer's disease and in mild cognitive impairment. Age and Ageing, 40( 2): 249–254. doi:10.1093/ageing/afq168.
- Janse E., Adank P. 2012. Predicting foreign-accent adaptation in older adults. Quarterly Journal of Experimental Psychology, 65: 1563–1585. doi:10.1080/17470218.2012.658822.
- Kidd G.R., Watson C.S., Gygi B. 2007. Individual differences in auditory abilities. Journal of the Acoustical Society of America, 122: 418–435. doi:10.1121/1.2743154.
- McAuliffe M.J., Gibson E.M., Kerr S.E., Anderson T., LaShell P.J. 2013. Vocabulary influences older and younger listeners’ processing of dysarthric speech. Journal of the Acoustical Society of America, 134( 2): 1358–1368. doi:10.1121/1.4812764.
- Muthén B., Kaplan D. 1985. A comparison of some methodologies for the factor analysis of non-normal Likert variables. British Journal of Mathematical and Statistical Psychology, 38( 2): 171–189. doi:10.1111/j.2044-8317.1985.tb00832.x.
- Neger T.M., Rietveld T., Janse E. 2014. Relationship between perceptual learning in speech and statistical learning in younger and older adults. Frontiers in Human Neuroscience, 8:628. doi:10.3389/fnhum.2014.00628.
- Noble W., Gatehouse S. 2004. Interaural asymmetry of hearing loss, speech, spatial and qualities of hearing scale (SSQ) disabilities, and handicap. International Journal of Audiology, 43( 2): 100–114. doi:10.1080/14992020400050015.
- Papakonstantinou A., Strelcyk O., Dau T. 2011. Relations between perceptual measures of temporal processing, auditory-evoked brainstem responses and speech intelligibility in noise. Hearing Research, 280: 30–37. doi:10.1016/j.heares.2011.02.005.
- Park D.C., Reuter-Lorenz P. 2009. The adaptive brain: aging and neurocognitive scaffolding. Annual Review of Psychology, 60: 173–196. doi:10.1146/annurev.psych.59.103006.093656.
- Pichora-Fuller M.K., Souza P.E. 2003. Effects of aging on auditory processing of speech. International Journal of Audiology, 42, S11–S16.
- Plomp R., Mimpen A.M. 1979. Improving the reliability of testing the speech reception threshold for sentences. Audiology, 18( 1): 43–52.
- Ramig L.O., Countryman S., O'Brien C., Hoehn M., Thompson L. 1996. Intensive speech treatment for patients with Parkinson's disease: short-and long-term comparison of two techniques. Neurology, 47( 6): 1496–1504. doi:10.1212/WNL.47.6.1496.
- Schneider B., Pichora-Fuller M. 2001. Age-related changes in temporal processing: implications for speech perception. Seminars in Hearing, 22( 3): 227–240. doi:10.1055/s-2001-15628.
- Schneider W., Eschman A., Zuccolotto A. 2002. E-prime reference guide. Pittsburgh, PA: Psychology Software Tools.
- Schroter-Morasch H., Ziegler W. 2005. Rehabilitation of impaired speech function (dysarthria, dysglossia). GMS Current Topics in Otorhinolaryngology, Head and Neck Surgery, 4: 15.
- Wechsler D. 2004. Wechsler Adult Intelligence Scale. 3rd ed. Amsterdam: Harcourt Test.
- World Health Organization. 2014. Grades of hearing impairment. [retrieved 2014 Mar 8]. Available from: http://www.who.int/pbd/deafness/hearing_impairment_grades/en/.
- Wurm L.H., Fisicaro S.A. 2014. What residualizing predictors in regression analyses does (and what it does not do). Journal of Memory and Language, 72: 37–48. doi:10.1016/j.jml.2013.12.003.