
Abstract
A quick and newly developed technique has been applied for the determination of gas barrier properties of nanocomposites using conductive polymer nanocomposite (CPC)-based quantum resistive vapor sensors (vQRS). The potential of this device is demonstrated with two kinds of nanocomposites, i.e. poly(isobutylene-co-isoprene) (IIR) filled with either montmorillonite (MMT) or graphene (GR) nanoplatelets. The calibration curves of vQRS were well fitted with the Langmuir–Henry model, whereas the integral time lag method was successfully used to determine the diffusion coefficient D of nanocomposite membranes. The values obtained allowed to derive fillers' shape factor from the Cussler's model and the results obtained with the vQRS cell show that the diffusion coefficient D of volatile organic compounds (VOC such as toluene at 25°C), through IIR membranes can be significantly decreased by the dispersion of nanoplatelets in the polymer matrix. Quantitatively, the gas barrier efficiency of pristine IIR can be increased of 67% and 80% by the incorporation of only 4.76% m m− 1 of Cloisite10A, and 4.76% m m− 1 of reduced GR oxide, respectively. Inversely, partially exfoliated expanded graphite and organo-modified clay dispersed without maleic anhydride functions present on poly(isobutylene-co-isoprene) (IIR) result in lower gas barrier efficiency, i.e. 17% and 57%, respectively.
Introduction
Many applications covering biomedical, laboratory, and industrial fields rely on the diffusion properties of polymer membranes. These include the controlled drug delivery and transfusion of body fluids through polymer membranes in medicine,Citation1 fabrication of impermeable tires, balls and inflatable boats in industries, etc. Moreover, the information on barrier properties of polymers helps in the selective removal of toxic solvent vapors. Owing to these reasons, extensive works were done on the solvent barrier properties of various polymer–solvent systems.Citation2–Citation12 On the other hand, classical techniques to measure diffusion properties require demanding preparation and are often time consuming. In this context, the use of quantum resistive sensors (QRS) made of conductive polymer nanocomposites (CPCs) developed in our groupCitation13–Citation15 appeared to be a good alternative to existing methods of determination of the diffusion coefficient, as it was found to combine rapidity, convenience in use, and reliability.Citation16 The low amount of solvent required for the analysis (only a few cubic centimeters) is really remarkable. To demonstrate the effectiveness of the QRS-based technique, it has been applied to the evaluation of the gas barrier properties of two kinds of polymer nanocomposites, i.e. poly(isobutylene-co-isoprene) IIR filled with nanoplatelets of either montmorillonite (MMT)Citation17,Citation18 or graphene (GR),Citation19,Citation20 known for their efficiency to modify the diffusion of gases through polymers.
Indeed, most polymers are permeable to small molecules, which has motivated researchers to improve their gas barrier performances by the addition of nanofillers in order to decrease their diffusivity. The superior features of nanometric fillers offer great possibilities to develop polymer nanocomposites. Compared to conventional microcomposites, they exhibit both enhanced mechanical propertiesCitation16,Citation21–Citation23 and gas impermeabilityCitation24–Citation26 even at low filler content. The nanocomposites containing flakelike or platelike inorganic fillers of high aspect ratio have particular interest as barrier materials. For two-dimensional nanosheets, the individual layers have a much higher aspect ratio than typical microscopic aggregates, which have to be exfoliated to yield high-performance nanocomposites.Citation27 The large interfacial area and attractive interactions per unit volume with the matrix as a result of exfoliation help nanoclays in fabricating mechanically strong impermeable elastomer membranes.Citation28,Citation29
Poly(isobutylene-co-isoprene) (IIR) is a special purpose elastomer because of its excellent properties such as impermeability/air retention, weathering resistance, ozone resistance, vibration dampening, sealing efficiency, etc. This synthetic rubber is a copolymer of isobutylene (97–98%) and a small amount of isoprene (2–3%). The low levels of unsaturation between long poly(isobutylene) segments impart good flexing properties as well to this polymer.Citation30 Various nanofillers and other additives can be added to IIR to improve its performances further. However, IIR-clay nanocomposites are difficult to prepare because of the hydrophobicity of IIR resulting in poor interactions with clay silicate layers.Citation31 Therefore, a grafting with maleic anhydride (MA) is often performed to introduce polar groups on the non-polar IIR backbone and to improve IIR/organoclay compatibility.Citation32,Citation33 Among the various methods, the solvent assisted grafting is quite useful.Citation31 Apart from clay, GR, which exhibits a maximum theoretical specific surface of 2630 m2 g− 1,Citation34 has focused the attention of many scientists interested in the improvement of rubber-based nanocomposites' properties. In fact, this atomically thick two-dimensional sheet of sp2-bonded carbon atoms has an ultra-high specific area expected to improve simultaneously mechanical, electrical, and permeability properties.Citation35–Citation41
Both GR and layered silicate nanocomposites can be used as barrier materials in packaging applications for instance. The process of permeation through the composite films depends on the chemical nature, size, and shape of penetrants, the type and crosslinking density of polymers, the nature of fillers used, and some environmental factors such as temperature, concentration, etc. To correlate solvent diffusivity in polymers, many models such as solution–diffusion model, dual mode model, Eyring's hole theory, percolation theory, fractal theory, random walk theory, and others are used.Citation42 The simple solution–diffusion modelCitation43 proposes a three-step process for solvent diffusivity through the matrix: occupation of solvent molecules in the free volume present in polymers, swelling caused by the binding of solvent to the network sites and the solvent entry at the crosslinked regions. The possibility of solvent molecules to cluster inside the polymer network has been addressed by Barrie et al.Citation43 by explaining the observed non-linear isotherm for high activity solvents. ArisCitation44 proposed another three mode model of sorption including the bulk dissolution of solvent in polymer networks, solvent absorption onto the surfaces of vacuoles and hydrogen bonding between polymer hydrophilic groups and solvents. The diffusion behavior of small molecule penetrants in dense polymer membranes is also reported by Chen et al.Citation45 based on the percolation theory, the fractal theory, and random walk theory. Finally, Fredrickson and Bicerano,Citation46 Cussler et al.,Citation47 and BharadwajCitation48 models explain theoretically the gas barrier properties of nanocomposites.
This paper focuses on the effectiveness of quantum resistive vapor sensors (vQRS) made of CPCs to quickly characterize gas barrier efficiency of nanocomposite membranes. In order to quantify QRS performances their results were compared to those of the more traditional Fourier Transform InfraRed Spectroscopy (FT-IR) technique.Citation49 The choice of pertinent nanocomposites to illustrate the capabilities of the technique went on poly(isobutylene-co-isoprene) IIR filled with GR and MMT nanoplatelets, which are promising materials for the design of membranes impermeable to gases. This work gave also the opportunity to study the influence of the chemical nature, interactions, and shape factor of nanoplatelets on their barrier properties. In addition, the investigation of sorption and diffusion mechanisms of molecules expected to have good diffusion ability, i.e. vapors of toluene allowed the determination of transport parameters through nanocomposite films with the ‘time lag’ approach.Citation13 In contrast, by using the diffusion coefficient values, the effective average aspect ratio of fillers could also be calculated.
Materials & Methods
Materials used for nanocomposites synthesis
IIR (Butyl 065) was purchased from Exxon Company (Notre Dame de Gravenchon, France) (density 0.92 g cm− 3). Multiwall carbon nanotubes (CNTs) N-7000 were kindly provided by Nanocyl (Sambreville, Belgium). They are produced via catalytic carbon vapor deposition (CCVD) process and have a carbon purity of 90% (10% catalyst). This grade corresponds to CNT with an average diameter of 10 nm and a mean length between 100 and 1000 nm.Citation14 The nanoclay (Cloisite 10A), an organo-modified MMT has a density 1.5 g cm− 3 and an interlayer distance of 1.9 nm; it was obtained from Southern Clay Products (Gonzales, USA). The materials were dried under vacuum at 60°C temperature for 24 h before the composite preparation. Poly(caprolactone) (PCL) (Mw = 14 000 g mol− 1) and poly(carbonate) (PC) Lexan141R were obtained from General Electric Plastics (Evry, France). The graphite particles used as precursor of GR platelets (average size > 45 μm, density 1.82 g.cm− 3) and all the other chemicals such as KMNO4, H2SO4 etc. as well as the solvents like toluene, ethanol, THF, HCl, etc. were procured from Aldrich, (Saint-Quentin Fallavier, France) and were used as received. Expanded graphite (EG) eGR TIMREX BNB90 was kindly provided by Timcal (Willebroek, Belgium).
Fabrication of vQRS
The CPCs vQRS were fabricated in two steps. First, PC and PCL-based nanocomposites were prepared by separately dissolving the polymers in chloroform under constant stirring and by adding a constant amount of CNT (1% w/w) into each polymer solution. Carbon nanotubes are well dispersed under sonication for 1 h at 50°C and kept degassing for 30 min. Then the nanocomposite solution mixtures were deposition on interdigitated electrodes (IDEs) by the spray layer-by-layer (sLbL) developed in our group, which allows the control of the sensor's hierarchical conducting architecture.Citation50–Citation56 The spray conditions were set as follows: a nozzle scanning speed of Vs = 10 cm s− 1, a stream pressure of ps = 0.20 MPa, a solution flowrate adjusted to index 2 and an IDE to nozzle distance of dtn = 8 cm. During solvent evaporation, CPC microdrops of 50–100 nm size can weld to form a three-dimensional network by percolation that leads to a film of final thickness between hundreds of nanometers and several micrometers, depending on the number of sprayed layers.Citation51 After fabrication, vQRS were conditioned overnight at 30°C in a controlled atmosphere. The type of sensor, a number of layers composing the transducer and average initial resistances (R0) were pure CNT (4 layers)/R0 = 585 kΩ, PC-CNT (8 layers)/R0 = 5.2
1.2 kΩ, and PC-CNT (12 layers)/R0 = 65
10 kΩ, respectively. All vQRS were exposed three consequent times to the studied organic volatile compound (VOC), i.e. toluene, to study the diffusion properties through the membrane (polymer or nanocomposite film). The high sensitivity of vQRS results from the progressive conversion of simple ohmic conduction (when CNT are in close contact) into tunnel conduction (when a gap appears between CNT) on the adsorption of analytes at the CNT/CNT nanojunctions, which results in an exponential variation of the resistance.Citation14 Temperature variations can also influence the conduction mechanism; this is why this parameter must be controlled during the experiment.Citation57,Citation58 Other factors influencing the sensitivity of QRS sensor are the nature of the polymer matrix, the conducting nanofiller content, the initial resistance, the chemical nature of analytes, particularly the Flory–Huggins intermolecular interaction parameter (χ12) based on the difference in solubility parameters δ of the VOC and the polymer.Citation54 Finally, the selectivity of vQRS to analytes can be tuned by changing the chemical nature of the polymer matrix of the CPCCitation51 or by grafting organic functions on the surface of the conducting nanofiller.Citation55,Citation56
Preparation of MA-modified poly(isobutylene-co-isoprene) (MA-g-IIR)
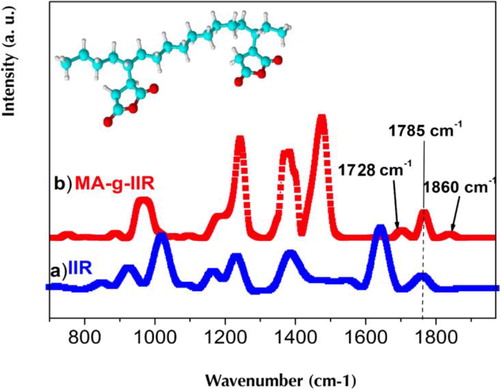
Maleic anhydride-modified poly(isobutylene-co-isoprene) MA-g-IIR was prepared by Makoto et al.Citation31 in the following method. The desired amount of MA was dissolved in xylene and mixed with IIR in inert medium initiated by benzoyl peroxide at 110°C for 3 h by maintaining the same temperature. When the reaction was completed, the solution was poured into acetone to remove the unreacted MA. The obtained MA-g-IIR precipitate was dried at 80°C in a vacuum oven till it attained a constant weight. FT-IR spectroscopy was used to evidence the grafting reaction. The appearance of peaks at 1728 cm− 1 and 1860 cm− 1 in the FT-IR spectrum of MA-g-IIR indicates the grafting of MA groups on the IIR backbone (). The peaks at 1780 and 1785 cm− 1 are, respectively, assigned to the symmetric and asymmetric stretched vibration absorbance of the carbonyl groups ().
Figure 1. FT-IR spectra of a IIR and b MA-g-IIR
Preparation of reduced GR oxide (RGO) from GR oxide (GO)
Graphene oxide was prepared by improved GO synthesis methodCitation59 by adding concentrated H2SO4/H3PO4 and KMnO4 mixture to graphite flakes (3.0 g, 1 wt eq.). The mixture was heated to 50°C for 12 h under stirring and cooled by pouring onto ice. The excess amount of KMnO4 was removed by using H2O2 and the suspension was simultaneously filtered through a metallic US standard testing sieve (300 μm; W. S. Tyler, Mentor, Ohio, USA) for removing the unreacted graphite flakes. After an extended multiple-wash process with water, HCl, and ethanol, the material remaining was coagulated with ether and filtered through a PTFE membrane. The obtained GO was subjected to high temperature to prepare thermally reduced GO in the second step. For this the nitrogen gas is passed through GO for 30 min in sealed container to create an inert atmosphere on its surface and thereafter placed in a pre-heated muffle furnace at 150°C for 30 min.
Preparation of the composite membranes
Poly(isobutylene-co-isoprene) IIR composites containing micro- as well as nanofillers are prepared by solution compounding using THF as solvent. Initially the filler was homogeneously dispersed in THF by sonication for 1 h. The THF-solubilized IIR suspension was mixed with this filler solution using mechanical stirring for 3 h. The obtained rubber composite solution was dried at 80°C in an oven under vacuum till it attained constant weight. Specifically, cured composites were obtained by mixing the dried composites with stearic acid at 1.7 wt-%, zinc oxide (activator) at 4.4 wt-%, MBTS (2-bisbenzothiazole-2,2′-disulfide) at 0.4 wt-%, TMTD (tetra methyl thiuram disulfide) at 0.9 wt-% and sulfur (elemental sulfur S8) at 1.3 wt-%, in an internal Brabender mixer at 20 rpm and at 50°C for 30 min, Aldrich (Saint-Quentin Fallavier, France). It was then compression molded at 160°C for the respective curing times determined from the moving die rheometer. The composition of the prepared samples is given in .
Table 1. Details of samples used
Experimental setup for the analysis of diffusion with vQRS
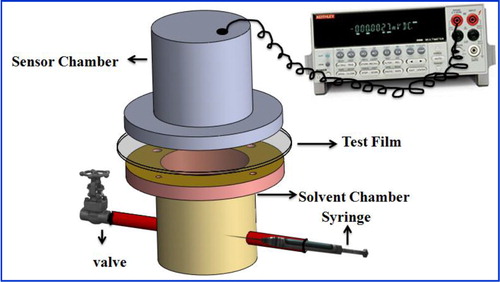
A schematic representation of the experimental set-up integrating the vQRS to determine the time lag is illustrated in . The vQRS provides the relative variation of resistance (AR) with time that can be easily recorded using a Keithley 6517A electrometer Its chemo-resistive behavior will depend on the molecules to which it is exposed and its composition must be selected accordingly. Here the polymer chosen for the QRS matrixes are poly(carbonate) (PC) and poly(caprolactone) (PLC) because they were found very sensitive to toluene vapors resp.Citation51,Citation56 In this experimental set-up, the polymer or nanocomposite membrane to be tested separates the solvent chamber (filled with a saturated vapor of the analyte) from the QRS chamber. Both the pressure difference between both sides of the membrane and the temperature in the cell are controlled.
Figure 2. Schematic representation the measurement cell in which QRS are implemented
The QRS relative resistance (AR) changes with time can be recorded from the introduction of vapors into the chamber until the end of diffusion through the membrane.Citation16 The QRS chemo-resistive response (AR) is defined by equation (1)1 where R and R0 are, respectively, the QRS resistance in the presence of vapor and its initial resistance (in the dried state) in inert atmosphere.
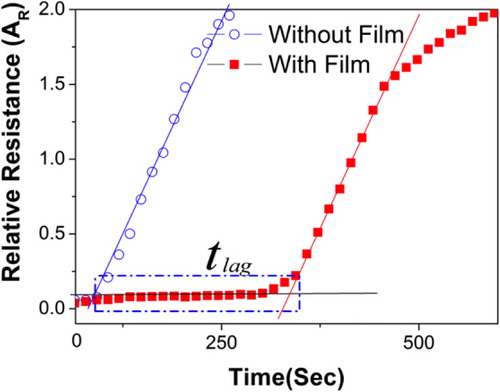
Typical experimental results such as those presented in show that the area under the curve is increasing with time as a function of the arrival of analyte molecules on the second face of the membrane in the chamber containing the QRS.
Figure 3. Typical chemo-resistive response of QRS when exposed to toluene molecules with and without IIR filmCitation16
During the experiment, the pressure inside the solvent chamber is nearly equal to the saturating vapor pressure and that in the QRS chamber is equal to atmospheric pressure. The vapor diffusion will proceed through the membrane up to a state of equilibrium provided that the concentration balance constitutes the driving force.Citation13,Citation60 Classically the diffusion coefficient value D can be calculated by following the integral ‘time lag’ method on the basis of the mathematical description made by Fick's law, which explains an analogy between the heat and mass flows in a polymer, based on the free chain mobility.Citation61 The transfer of a substance through a polymer matrix is thus proportional to the concentration gradient within a volume unit, which can be represented by equation (2)2 where F is the transfer rate (mass flow) per unit volume and unit cross-sectional area, c is the concentration of the substance being diffused (diffusant), x is the distance of diffusion perpendicular to the cross-section, and D is the diffusion coefficient.
The diffusion coefficient is a substance specific variable, which is regarded as a constant at low concentrations, whereas it varies at higher concentrations. With respect to equation (2), Fick derived a second law for one-dimensional diffusion in isotropic substances, i.e. in the x direction,Citation13,Citation60 which is given by equation (3)3 where t is time and x is vertical distance from the membrane surface using the boundary conditions,
All expressions can be simplified into the final form of equation (4) for explaining the total solute transferred related to time.Citation62
4 where Q(t) is the total amount of solute transferred through a membrane of area A at time t and D is the effective diffusion coefficient. A graph of Q versus t is a straight line intercepting the y axis at tlag = l2/6D.
The determination of the intercept of the linear part of the curve with the x axis () gives the time lag (tlag), which allows to calculate the diffusion coefficients D using equation (5) provided that the membrane thickness (l ) is known5 In the experimental device of , a multimeter records the QRS resistance changes as soon as they there are exposed to the VOC, in this case toluene. At the beginning of the test, a 0.3-cm3 of VOC was injected in the bottom half of the vessel and vapor gets distributed with equal pressure throughout the chamber sealed with the test membrane.Citation13 The diffusion time of analytes through the QRS transducer is evaluated to a fraction of second, which is assumed to be negligible compared with the diffusion time through the membrane of several seconds. All the experiments were performed at 25°C and were repeated thrice at each operating condition for reproducibility.
Techniques for structural & morphological characterization
The nanoscale characterization of GO was done using atomic force microscopy (AFM) in ambient conditions using normal tapping mode (TM-AFM) on a caliber multimode scanning probe microscope from Bruker-Veeco (Dourdan, France). The set point amplitude of antimony-doped silicon tapping mode cantilever (LTESP model, Veeco, New York, USA) was ∼4.5 V. The cantilever with tip radius between 5 and 20 nm had typical resonance frequency about 270 kHz, and a cantilever spring constant (k) was 20–80 N m− 1. The substrate used for filler deposition was oxidized smooth silica wafer.
The ultra-thin transmission electron microscopy (TEM) samples of 70-nm thickness were cut using a cryogenic ultramicrotome Leica ultracut UCT at − 90°C and images were taken using a JEOL JEM-1400 electron microscope at 100 kV.
The scanning electronic microscope (SEM) images were obtained with a Jeol JSM-6460LV SEM.
An expert model of Philips diffractometer with CuKα radiation generator (α = 0.15404 nm, 40 kV, 40 mA) was used for XRD measurements of the composite samples.
Results & Discussion
Structure & morphology of nanocomposites
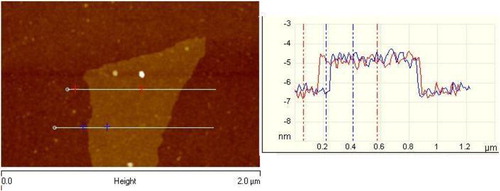
Before the characterization of gas barrier properties of nanocomposites, it is important to check the level of individualization of nanoplatelets and their organization in the polymer matrix. The thickness of GO observed by AFM was evaluated to be >1.4 nm, which corresponds to two to four atomic layers, clearly indicating the successful exfoliation driven by oxidation (). The average surface area of the GO platelets ranged from 1 to 4 μm2.
Figure 4. Atomic force microscopy (AFM) images of GO platelets deposited on an oxidized smooth silica surface
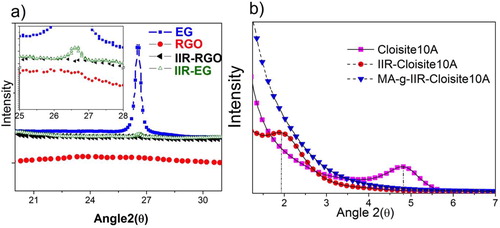
The XRD analysis allows to investigate the effectiveness of individualization of platelets in a polymer matrix characterized by an increase of interlayer distance (intercalation) and complete separation (exfoliation). shows that IIR-EG still presents a weak peak at 2θ = 26.5°, that corresponds to the (002) basal plane, with an interlayer spacing of d002 = 0.345 nm characteristic of pure EG. This suggests that IIR-EG still contains graphite flakes not completely exfoliated. Conversely, IIR-RGO shows no such peak at 2θ = 26.5° that supports the formation of well individualized RGO nanoplatelets. In the case of MMT-based nanocomposites, the diffraction peak at 2θ(4.8° visible in corresponds to the (001) basal plane of clay. The increase in the interlayer spacing from d001 = 1.83 nm (corresponding peak at 2θ(4.8° to pure Cloisite 10A platelets) to d001 = 4.61 nm for IIR–Cloisite composite (peak at 2θ(1.92°). The MA-g-IIR-Cloisite shows no characteristic peak, substantiating the complete exfoliation of clay in MA-g-IIR ().
Figure 5. WAXD patterns of a EG, RGO, IIR-EG, and IIR-RGO (insight shows closed view) and b Cloisite10A, IIR-Cloisite10A, and MA-g-IIR-Cloisite10A
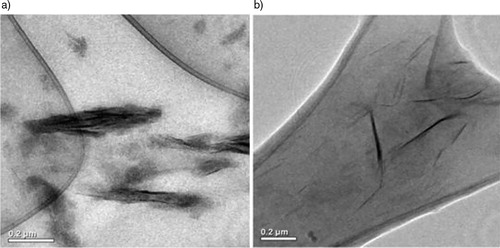
The TEM images give information about the dispersion of clay in IIR and MA-g-IIR matrixes (). It is clear from that in pure IIR some stacks of 20–100 nm thickness remain present, whereas in the clay sheets appear well dispersed in MA-g-IIR. Since MMT has a much higher electronic density than neat polymers, it appears dark in TEM images.
Figure 6. Transmission electron microscopy (TEM) photographs of a IIR and b MA-g-IIR filled with 1.12 v/v% of cloisite 10A
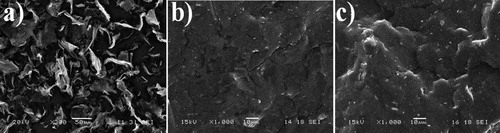
The morphology of RGO, IIR-RGO, and IIR-EG can be visualized by SEM in . The homogeneous dispersion of RGO in IIR is clear from the SEM micrograph for IIR-RGO nanocomposites (). Reduced GR oxide particles have a platelike shape, with average sizes of 1–10 μm (). Each flake consists of multiple layers of GR nanoplatelets with aspect ratios of ∼20–50. The surface of IIR-RGO composite is very homogeneous and smooth, but IIR-EG contains rough surface because of the large particle size of EG as evidenced from .
Figure 7. SEM of a RGO, b IIR-RGO, and c IIR-EG
Characterization of vQRS chemo-resistive responses
It is expected from a good gas sensor that on exposure to vapors, it will have a short response time (within the second), a high sensitivity [in the ppm (parts per million) range], and a response amplitude proportional to the amount of analytes to detect (quantitativity of signals). As it is clearly visible from (curve without nanocomposite film), vQRS give a quick response (within the second) of large amplitude (200% after 250 s). In order to determine the relationship between the chemo-resistive response Ar and the toluene vapor concentration in the cell, this parameter has been varied from 25 and 500 ppm for the three kinds of QRS: PC-CNT, PCL-CNT, and CNT. To make the comparison easier, the data obtained with the different systems have been collected in and fitted with two different models that will be presented as in what follows.
Figure 8. Evolution of PC-1%CNT (w/w), PCL-1%CNT (w/w), and neat CNT (1%w/w) QRS response with toluene vapor concentration in ppm
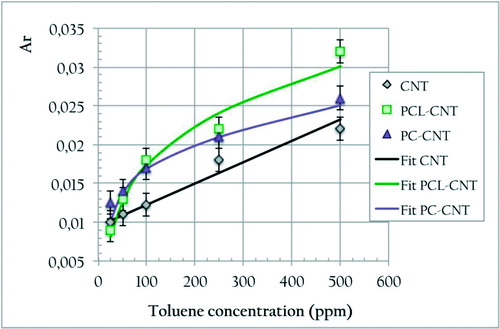
In previous studies on the quantification of chemo-resistive responses of vQRS in the ppt (parts per thousand) range,Citation51–Citation56 it had been shown that such behavior could be well fitted with the complete Langmuir–Henry Clustering (LHC) model derived from a dual mode sorption law as expressed in equation (6)6 where bL is the Langmuir affinity constant, f ″ is the vapor fraction over which Langmuir's diffusion is replaced by Henry's diffusion, f is the solvent fraction, kH is Henry's solubility coefficient, and n′ is the number of vapor molecules associated in clusters.
Here obviously, for PC-CNT and PCL-CNT the third term of this equation, describing the clustering of VOC molecules when they aggregate in large amount on macromolecules and nanofillers, is not relevant for parts per million concentrations and the model can be reduced to the first two terms LH. Even for the sensor made of CNT alone it seems that the chemo-resistive behavior can be well described by a simple linear law such as that proposed in equation (7). The fitting parameters are collected in 7 kH is Henry's solubility coefficient, f is the solvent fraction, and C is a constant.
Table 2. Parameter obtained after fitting with the Langmuir–Henry Clustering (LHC) model expressed by equations (6) and (7)
These laws can be used to predict the concentration of a known vapor from the value of the QRS response, but also make possible to determine their limit of detection (LOD) by extrapolation, here LOD # 10 ppm. Moreover, each sensor has been individually calibrated at 25°C with VOC flowrates varying from Qv = 0-100 cm3 min− 1 as explained in Ref. Citation51.
Thanks to the performances demonstrated above, it is expected that all the vQRS selected in this study will allow to determine with accuracy when only some parts per million of vapor molecules will pass through the polymer membrane from the vapor chamber to sensor chamber ().
Effect of nanofillers on diffusion in nanocomposites
The incorporation of nanofillers with a layered structure into polymer matrixes has been shown to be highly effective in reducing the diffusion of toluene vapor. The relative diffusion coefficient in such nanocomposites has been defined by Cussler et al.Citation47 using equation (8). This parameter is expressing the gas barrier efficiency resulting from the proper dispersion of nanofillers in a polymer matrix8 where (ϕ is the volume fraction, α is the particle's aspect ratio, Dc and D0 are, respectively, the diffusion coefficients with and without filler.
The relative diffusivity of toluene molecules in IIR, IIR-Cloisite, MA-g-IIR-Cloisite, and IIR-RGO nanocomposites and the values of filler aspect ratio derived from equation (8) have been collected in .
Table 3. Diffusion coefficients of toluene vapor through IIR-based nanocomposites
It can be noticed that the most effective nanocomposite to slow down the diffusion of toluene vapor molecules is IIR-RGO, which exhibits the lowest diffusion coefficient and the highest nanofiller shape factor L/e = 130. This suggest a good dispersion/exfoliation of RGO in the IIR matrix, which could nevertheless be improved as the value of GR shape factor calculated from equation (8) is still inferior to the value of L/e = 1000 calculated from the geometric parameters extracted from . Moreover, gives a clear overview of the evolution of both the diffusion coefficients and the gas barrier efficiency (through the diffusion coefficient reduction calculated in equation (9)) of the different samples studied9 where Dm and Dc are, respectively, the diffusion coefficients of the polymer matrix and the nanocomposite.
Figure 9. Decrease in diffusion coefficient (cm2 s− 1) and increase in diffusion coefficient reduction of toluene in IIR, IIR-2.92%v/v Cloisite, MA-g-IIR-2.92%v/v Cloisite, and IIR-2.43%v/vRGO composites (from left to right)
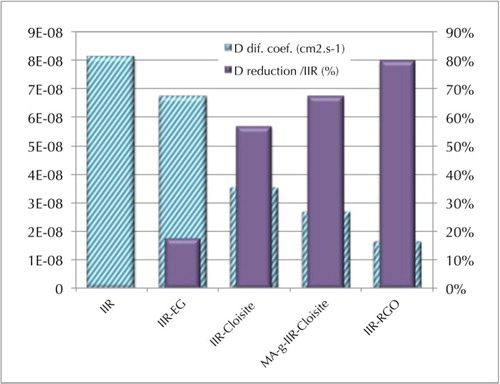
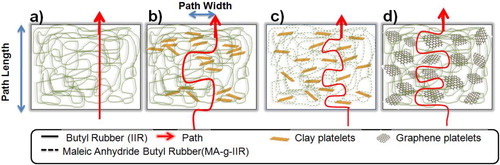
Although it was observed from the XRD spectra () that both intercalated and exfoliated structures are present in the nanocomposites, when the interface between nanofillers and macromolecules is of good quality, this leads to a better exfoliation and finally results in nanocomposites with higher gas barrier efficiency as clearly visible in . For instance, only 2.92%v/v of clay can decrease the diffusion coefficient of toluene of 57–67%, respectively, without and with MA. This effect is even more remarkable for GR platelets dispersed in IIR, for which only 2.43%v/v leads to a decrease in diffusion coefficient of toluene of 17–80% for respective IIR-EG and IIR-RGO. The very high barrier effect obtained with this later system is because of the specific properties of the interfacial area, which are determined not only by the physico-chemical characteristics of the polymer matrix and the nanofillers, but also by the minimization of side effects that can lead to a less compact material. This can happen when penetrant molecules are clustering, which generates the crazing of the matrix, and/or the partial dissolution of some components; in this case, the diffusion becomes less dependent or even independent of the amount of sorbed molecules.Citation49 Moreover, the fact that MA-g-IIR-Cloisite10A exhibits a lower permeability than IIR-Cloisite10A nanocomposite is another illustration of the interest of enhancing the interactions between MMT and IIR to promote the dispersion of clay at the nanometric level in IIR and produce more tortuous pathways that will slow down the solvent molecules diffusion. An attempt to conceptualize the vapor molecules' transport through the different composites is made in . Direct flow through a polymer matrix without any obstacle (), polymer matrix in which stacked and exfoliated platelets of MMT have been dispersed respectively (), nanocomposites in which GR platelets are well exfoliated leading to long tortuous paths and high surface of interface as evidenced for IIR-RGO composites (). These facts are comforted by theoretical calculations showing that GR platelets have a much larger surface area (# 2630 m2 g− 1) than clay (# 750 m2 g− 1), which justifies that solvent molecules need more time to cross the network made of GR than that of clay.
Figure 10. Schematic representation of tortuous path and dispersion in a IIR, b IIR-Cloisite10A, c MA-g-IIR-Cloisite10A, and d IIR-RGO nanocomposites
Conclusions
The new experimental set-up designed by integrating highly sensitivity vQRS made of CPCs in a diffusion cell appeared to be a low cost technique, easy to operate, and effective to determine the barrier properties of nanocomposite films with the conventional time lag method through the determination of the diffusion coefficients. The diffusion of toluene, a volatile organic compound among the most common laboratory reagents, was chosen to demonstrate the efficiency of the vQRS cell to discriminate between fillers' dispersion at the micro- and nanoscales in composite membranes. Through the determination of gas barrier properties, this technique can be used indirectly to evaluate the efficiency of fillers or macromolecules' functionalization to enhance interatomic/intermolecular interactions, the dispersion state and aspect ratio the filler's once dispersed in the matrix. This study confirms the interest of grafting poly(isobutylene-co-isoprene) with MA to allow a better dispersion of organo-modified MMT in this matrix. Consequently, the gas barrier efficiency of this polymer already known to be very high, could be improved by 67%. Moreover, RGO, because of its larger specific surface than MMT, has demonstrated even better gas barrier performances by reaching a reduction in diffusion coefficient of 80% which, compared to the 17% obtained for EG, illustrates again the necessity of reaching a high level of exfoliation. Finally, it is expected that the simplicity of this technique will favor the development of gas barrier materials of interest in many technological fields such as packaging, fire-retardancy, batteries, biomedical applications, etc.
Conflicts of interest
The authors have no conflicts of interest to declare.
Acknowledgements
The authors acknowledge the Department of Science & Technology, Delhi, India and EU FEDER, French Ministry for Research and the Brittany Region for the financial support. The authors are grateful to Anthony MAGUERESSE and Françoise PERESSE for their contribution to this work.
References
- Krause B., Storr M., Ertl T., Buck R., Hildwein H., Deppisch R. and Göhl H.: Chem. Ing. Tech., 2003, 75, 1725–1732.
- Cassidy P. E. and Aminabhavi T. M.: Rubber Chem. Technol., 1983, 56, 594–618.
- Harogoppad S. B. and Aminabhavi T. M.: Macromolecules, 1991, 24, 2598–2605.
- Khinnavar R. D. and Aminabhavi T. M.: J. Appl. Polym. Sci., 1991, 42, 2321–2328.
- Proikakis C. S., Mamouzelos N. J., Tarantili P. A. and Andreopoulos A. G.: Polym. Degrad. Stab., 2006, 91, 614–619.
- Gopakumar S. and Gopinathan Nair M. R.: Polymer, 2005, 46, 10419–10430.
- Azaar K., Rosca I. D. and Vergnaud J. M.: Polymer, 2002, 43, 4261–4267.
- Kader M. A. and Bhowmick A. K.: Polym. Degrad. Stab., 2003, 79, 283–295.
- Mathai E., Singh R. P. and Thomas S.: J. Membr. Sci., 2002, 202, 35–54.
- El-Tantawy F.: Polym. Degrad. Stab., 2001, 73, 289–299.
- Erdal S., Bahar I. and Erman B.: Polymer, 1998, 39, (10), 2035–2041.
- Sen Majumder P., Majali A. B., Tikku V. K. and Bhowmick A. K.: J. Appl. Polym. Sci., 2000, 75, 784–795.
- Tung T. T., Castro M., Kim T. Y., Suh K. S. and Feller J. F.: J. Mater. Chem., 2012, 22, 21754–21766.
- Kumar B., Castro M. and Feller J. F.: Chem. Sens., 2013, 3, (20), 1–7.
- Chatterjee S., Castro M. and Feller J. F.: J. Mater. Chem. B, 2013, 1, (36), 4563–4575.
- Kumar S. K., Castro M., Pillin I., Feller J. F., Thomas S. and Grohens Y.: Polym. Adv. Technol., 2013, 24, (5), 487–494.
- Gorrasi G., Tortora M., Vittoria V., Pollet E., Lepoittevin B., Alexandre M. and Dubois P.: Polymer, 2003, 44, 2271–2279.
- Gain O., Espuche E., Pollet E., Alexandre M. and Dubois P.: J. Polym. Sci. B, 2005, 43, 205–214.
- Yang Y. H., Bolling L., Priolo M. A. and Grunlan J. C.: Adv. Mater., 2013, 25, 503–508.
- Stevens B., Dessiatova E., Austin Hagen D., Todd A. D., Bielawski C. W. and Grunlan J. C.: ACS Appl. Mater. Interf., 2014, 5, (13), 9942–9945.
- Usuki A., Kojima Y., Okada A. and Kamigaito O.: J. Mater. Res., 1993, 8, 1185–1189.
- Lan T. and Pinnavaia T. J.: Chem. Mater., 1994, 6, 2216–2219.
- Sadhu S. and Bhowmick A. K.: J. Polym. Sci. B, 2004, 42, 1573–1585.
- Tong X., Zhaw H., Tang T., Feng Z. and Huang B.: J. Polym. Sci. A, 2002, 40, 1706–1711.
- Messermith P. B. and Giannelis E. P.: J. Polym. Sci. A, 1995, 33, 1047–1057.
- Gorrasia G., Tortoraa M., Vittoriaa V., Polletb E., Lepoittevinb B., Alexandreb M. and Dubois P.: Polymer, 2003, 44, 2271–2279.
- Van Olphen H.: ‘An introduction to clay colloid chemistry’, 2nd edn; 1977, New York, J. Wiley & Sons.
- Le Baron P., Wang Z. and Pinnavaia T.: Appl. Clay Sci., 1999, 15, 11–29.
- Vaia R. A., Price G., Ruth P. N., Nguyen H. T. and Lichtenhan J.: Appl. Clay Sci., 1999, 15, 67–92.
- Saritha A., Joseph K., Thomas S. and Muraleekrishnan R.: Compos. A, 2012, 43, 864–870.
- Makoto K., Azusa T., Hiromitsu T., Amritsu U. and Isamu I.: J. Polym. Sci. A, 2006, 44, 1182–1188.
- Salahuddin N. and Akelah A.: Polym. Adv. Technol., 2002, 13, 339–345.
- Li X. C. and Ha C. S.: J. Appl. Polym. Sci., 2003, 87, (12), 1901–1909.
- Chen D., Tang L. and Li J.: J. Chem. Soc. Rev., 2010, 39, 3157–3180.
- Huiqin L., Shuxin L., Kelong L., Liangrui X., Kuisheng W. and Wenli G.: Polym. Eng. Sci., 2011, 51, (11), 2254–2260.
- Song S. H., Jeong H. K. and Kang Y. G.: J. Ind. Eng. Chem., 2010, 16, 1059–1065.
- Prud'Homme R., Ozbas B., Aksay I., Register R. and Douglas A.: US patent, 7,745,528 B2; 2010.
- Xin B., Chaoying W., Yong Z. and Yinghao Z.: Carbon, 2011, 49, 1608–1613.
- Kim H., Abdala A. A. and Macosko C. W.: Macromolecules, 2010, 43, 6515–6530.
- Geim A. K. and Novoselov K. S.: Nat. Mater., 2007, 6, 183–191.
- Rafiee M. A., Rafiee J., Wang Z., Song H., Yu Z. Z. and Koratkar N.: ACS Nano, 2009, 3, 3884–3890.
- Rogers C. E.: Permeation of gases and vapours in polymers, In: ‘Polymer permeability’, (ed. Comyn J.); 1986, London, Elsevier applied science, pp. 11–74.
- Michaels A. S., Vieth W. R. and Barrie J. A.: J. Appl. Phys., 1963, 34, (1), 13–20.
- Aris R.: Arch. Ration Mech. Anal., 1986, 95, 83–91.
- Chen C., Han B., Li J., Shang T., Zou J. and Jiang W.: J. Membr. Sci., 2001, 187, 109–118.
- Fredrickson G. H. and Bicerano J.: J. Chem. Phys., 1999, 110, 2181–2188.
- Cussler E. L., Hughes W. J., W. J. Ward III and Aris R.: J. Membr. Sci., 1988, 38, (2), 161–174.
- Bharadwaj R. K.: Macromolecule, 2001, 34, 9189–9192.
- Linossier I., Gaillard F., Romand M. and Feller J. F.: J. Appl. Polym. Sci., 1997, 66, 2465–2473.
- Feller J. F., Guézénoc H., Bellégou H. and Grohens Y.: ‘Smart poly(styrene)/carbon black conductive polymer composites films for styrene vapour sensing’, Macromol. Symp., 2005, 222, 273–280.
- Lu J., Kumar B., Castro M. and Feller J. F.: Sens. Actua. B, 2009, 140, 451–460.
- Kumar B., Feller J. F., Castro M. and Lu J.: Talanta, 2010, 81, 908–915.
- Lu J., Feller J. F., Kumar B., Castro M., Kim Y. S., Park Y. T. and Grunlan J. C.: Sens. Actua. B, 2011, 155, 28–36.
- Nag S., Duarte L., Bertrand E., Celton V., Castro M., Choudhary V., Guegan P. and Feller J. F.: J. Mater. Chem. B., 2014, 2, 6571–6579.
- Feller J. F., Gatt N., Kumar B. and Castro M.: Chemosensors., 2014, 2, 26–40.
- Castro M., Lu J., Bruzaud S., Kumar B. and Feller J. F.: Carbon, 2009, 47, 1930–1942.
- Edwards P., Gray H., Lodge M. and Williams R.: Angew. Chem. Int. Ed., 2008, 47, 6758–6765.
- Ezquerra T. A., Kulescza M., Cruz C. S. and Balt-Calleja F. J.: Adv. Mater., 1990, 2, 597–600.
- Daniela C. M., Dmitry V. K., Jacob M. B., Alexander S., Zhengzong S., Alexander S., Lawrence B. A., Wei L. and James M. T.: ACS Nano, 2010, 4, (8), 4806–4814.
- Crank J.: ‘The mathematics of diffusion’, 2nd edn; 1975, Oxford, Clarendon Press.
- Fick A.: Ann. Phys. Lpz., 1855, 170, 59–86.
- Carslaw H. S.: 1st edn; 1906, London, Macmillan.