
Abstract
Background
Triple-negative breast cancer (TNBC) is an aggressive subtype of breast cancer. Metformin has been shown to have the potential to inhibit the proliferation of malignant cells. This study aimed to investigate the regulatory effect of metformin on phenotypic tumor-infiltrated lymphocytes (TILs) and mechanisms in TNBC.
Methods
Microarray analysis was performed on 4T1 cells post metformin treatment. BALB/c mice were inoculated with 4T1 cells with knockdown/overexpression of C-Jun N-terminal kinase (JNK), and administered with metformin. Phenotypic TILs in the tumor microenvironment (TME) were visualized by immunofluorescence staining.
Results
Metformin inhibited 4T1 cell proliferation and increased expression of JNK by 21% in vitro. In vivo, Metformin increased cell counts of CD4+ and CD8+TILs by 100% and 85%, respectively, and the increase of TILs was associated with JNK pathway. Cell counts of CD4+/PD-1+ and CD8+/PD-1+TILs were reduced by 64% and 58%, respectively, post metformin treatment, but the reduction of exhausted TILs was not associated with JNK pathway. Metformin induced a 11% and 20% reduction of IL-6 and TNF-α level in the TNBC model.
Conclusion
Our study demonstrated that metformin increased the functional phenotype of TILs and associated with JNK pathway, and suppressed the exhausted phenotype of TILs independently to JNK pathway in TNBC microenvironment. Further studies are needed to explore the basic mechanism of action of the drug. Metformin has potentially enhanced efficacy when used in combination with immunotherapy against TNBC.
Introduction
Breast cancer (BC) has become the most common female malignancy worldwide, accounting for 30% of new malignant cases and 15% of deaths in women.Citation1 Chinese BC patients have particular clinicopathological characteristics, ie low expression of hormone receptor and high expression of human epidermal growth factor receptor 2 (HER2).Citation2 Triple-negative breast cancer (TNBC), featured of negative expression of estrogen receptors (ER), progesterone receptors (PR) and HER2, is a more aggressive BC subtype and has the worst prognosis.Citation3 TNBC had higher expression of programmed death protein-1 (PD-1) and programmed death protein ligand-1 (PD-L1) than other subtypes, indicating the suppressed TME of TNBC.Citation4
The TME of BC was reported to affect patients’ prognosis.Citation5 BC recurrence and metastasis were related with phenotypes of tumor-infiltrated lymphocytes (TILs), especially CD4+ and CD8+T lymphocytes. Functional TILs improved the prognosis of TNBC; however, exhausted TILs had a negative association with survival.Citation6 High levels of TILs increased disease-free survival and overall survival in the TNBC.Citation7,Citation8 The complexity of TME is regulated by multiple signaling pathways, cytokines, cellular oxidative metabolism and other factorsCitation9 The Ras/MAPK signal pathway was reported to regulate the immunosuppression.Citation10 C-Jun N-terminal kinase (JNK) is an important component of MAPK signaling pathway and regulates the activation and proliferation of T cells.Citation11
Metformin not only has good efficacy and safety in the prevention and treatment of diabetes,Citation12 but also may become a candidate drug for cancer prevention and treatment.Citation13 Metformin could regulate immune cells and immune-related molecules, affect TME, and then exert anti-tumor immune response.Citation14,Citation15 This effect depends on a variety of pathways, including the classical AMP-activated protein kinase (AMPK) signaling pathway and regulation of the insulin-like growth factor family.Citation16 Metformin could regulate the immunosuppression of TME in TNBC, suppress BC cell proliferation and growth, and reduce overall BC risk and mortality.Citation17,Citation18 Additionally, metformin increased the number and activity of TILs in TMECitation14 and significantly decreased the expression of PD-L1. Current studies had shown that metformin can promote AMPK phosphorylation, thereby increasing the number of CD8+TILs and improving the immune status of TME.Citation16 However, whether metformin could regulate functional and debilitating TILs through MAPK signaling pathway remains unclear.
This study aimed to investigate regulatory effect of metformin and JNK signal pathway on the functional and exhausted TILs in TME of TNBC models.
Methods
Ethics Approval
Animal experiments were approved by the Medical Ethics Committee of Beijing Shijitan Hospital, Capital Medical University and were carried out in accordance with the Animal Welfare Guidelines of the Medical Ethics Committee of Beijing Shijitan Hospital, Capital Medical University, in line with the guidelines for the care and use of laboratory animals by the Chinese Institute of Health, and in compliance with all regulatory guidelines.
Cell Viability Assays
Cell viability was determined by MTT assay. 4T1 cells (Nanjing Kebai Biotechnology Co., LTD) were seeded into 96-well plates (5000 cells/well), cultured for 24h and discarded the supernatant. A gradient concentration (0.1, 0.2, 0.5, 1.0, 2.0, 5.0, 10.0, 20.0mmol/L) of metformin (Shanghai Squibb Pharmaceutical Co., LTD) was added on the following day. Cells were incubated with 5% CO2 at 37°C for 24h. 20μL (5g/L) MTT was added into each well and cultured for 4h. The supernatant was extracted and 100μL DMSO was added into each well for 15min, and then the absorbance was measured at 570nm. The experiment was repeated three times.
MAPK Pathway Analysis
The effect of metformin on MAPK signaling pathway in 4T1 cells was determined by protein microarray (Raybiotech, Inc., Raybio C1). 4T1 cells were lysed post metformin treatment (10.0mmol/L). The membrane chip was incubated with diluted protein lysates followed by incubation with 1mL biotin labeled antibody. The membrane was then incubated with HRP-streptavidin. ImageQuant LAS4000 chemiluminescence imaging analysis system (General Electric Company) was used for scanning. The experiment was repeated twice. The scanned data were normalized by EXCEL formula, including subtracting background and averaging. The normalized data were analyzed using R language. The selection criteria of potential signal protein were set as upregulation more than 20.0% and downregulation more than 16.7%.
Knockdown/Overexpression of JNK in 4T1 Cells
Lentiviral-mediated JNK overexpression vector and shRNA vectors were obtained from GeneChem (Shanghai, China). Target sequences were shown in (). Cells were seeded at 70–80% confluency in medium and transfected with lentivirus and polybrene A reagent according to the manufacturer’s instructions. The empty vector served as a negative control. After 12h, the medium was removed and replaced with fresh culture medium. Three days later, green fluorescent protein gene expression was observed under a fluorescence microscope, and the experiment was repeated twice; then, the cells were collected for subsequent culture.
Table 1 The Sequences of shRNA for JNK and PCR Primers
Animal Model
4T1 cells with wildtype JNK (Wildtype 4T1), 4T1 cells with JNK knock-down (4T1 JNK KD), 4T1 cells with overexpressed JNK (4T1 OVE JNK) were inoculated subcutaneously in the abdomen of 6-week female BALB/c mice (Spaefer Experimental Animal Co. Ltd.). Mice were divided into vehicle control group and metformin group, and metformin was administered (500mg/Kg) via oral gavage once a day for 4 weeks. All mice were anesthetized and the tumor tissues were aseptically harvested at the end of the experiment. After weight measurement, part of the tumor specimens was excised for IL-6 and TNF-α detection. Remaining tumor tissues were fixed in formalin and 4μm-thick formalin fixed paraffin-embedded sections were processed for TILs detection.
Phenotypic TILs Detection
Phenotypic TILs markers were stained and visualized by immunofluorescence (IF) staining. Antibodies used for the staining included CD4 (Ab183685, Abcam), CD8 (Ab22378, Abcam), and PD-1 (Ab214421, Abcam) monoclonal antibodies. Each entire tumor section was evaluated for TILs by using an objective lens (Olympus IX51, ×200), and 5 independent areas were selected randomly for cell counting. Each photograph was counted three times by the same investigator without awareness of hypothesis and early results. The average TILs counts were obtained for further analysis.
Detection of IL-6, and TNF-α
IL-6 and TNF-α levels were examined by ELISA Kit (Elabscience Biotechnology Co., Ltd). After the tumor tissue was harvested, part of the tumor tissue was cut into pieces. The cut tissue and the corresponding volume of PBS were added to the glass homogenizer and ground fully on ice. The homogenate was centrifuged at 5000×g for 10 minutes.100μL supernatant was added into ELISA kits for 20–25min at room temperature. The absorbance of IL-6 and TNF-α was measured with a microplate reader (SpectraMax iD5) at a wavelength of 450 nm to calculate the sample concentration.
Statistical Analysis
GraphPad Prism (GraphPad Software Inc., San Diego, California, USA) was used for data analyses. All data was expressed as the median and interquartile range (IQR). Kruskal–Wallis test was used to estimate the difference between groups. Pairwise comparisons were conducted by Wilcoxon tests with Bonferroni adjustments. All tests were two-sided and p<0.05 was considered statistically significant.
Results
Metformin Inhibited the Viability of 4T1 Cells
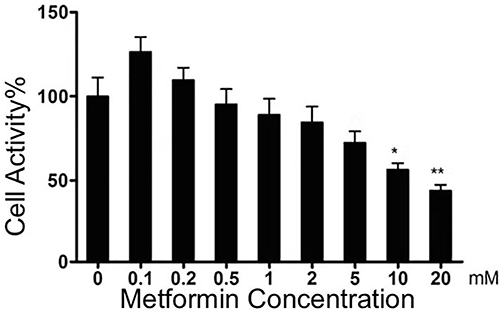
Metformin had no suppressive effect on 4T1 cell viability at low concentration (0.1–5.0mmol/L), while the inhibitive effect was observed at higher concentration (10.0mmol/L and 20.0mmol/L), with a dose-response relationship ().
Figure 1 The effects of metformin on 4T1 cell viability compared with control group. *p < 0. 05, **p < 0.01.
Metformin Affected the MAPK Pathway in 4T1 Cells
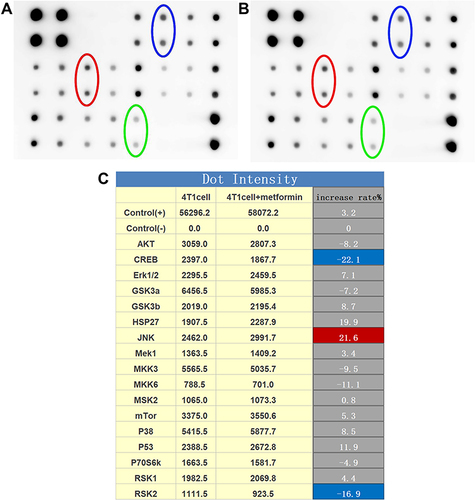
Among MAPK signal pathway, JNK expression level was 2462.0 (IQR = 265.02) in 4T1 cells with control vehicle treatment and increased to 2991.7 (IQR = 264.86) with metformin treatment, by a 21.4% increase (p<0.05, ).
Figure 2 The expression of MAPK pathway in 4T1cells. (A) The original blot of protein expression in 4T1 cells (JNK: red circle; RSK2: green circle; CREB: blue circle). (B) The original blot of protein expression in 4T1 cells with metformin treatment (JNK: red circle; RSK2: green circle; CREB: blue circle). (C) Quantitative results of the original blot.
No Change of the Weight of Xenograft Tumors in Mice
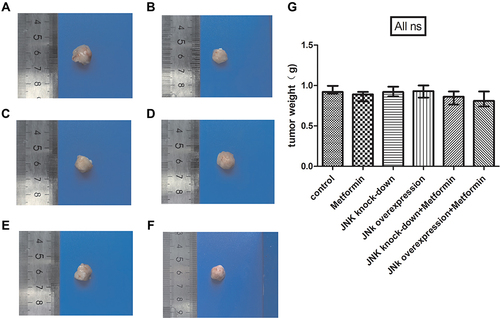
Metformin did not affect the weight of xenograft tumors in mice between groups (p>0.05, ).
Figure 3 The tumor weight of mice model. (A) Tumor specimens of 4T1 cells. (B) Tumor specimens of 4T1 cells and metformin administration. (C) Tumor specimens of 4T1 cells with JNK knock-down. (D) Tumor specimens of 4T1 cells with JNK overexpression. (E) Tumor specimens of 4T1 cells with JNK knock-down and metformin administration. (F) Tumor specimens of 4T1 cells with JNK overexpression and metformin administration. (G) statistical result of tumor weight. ns p > 0.05.
Metformin and JNK Pathway Affected the Phenotypic of TILs
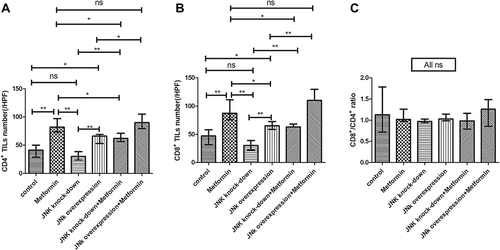
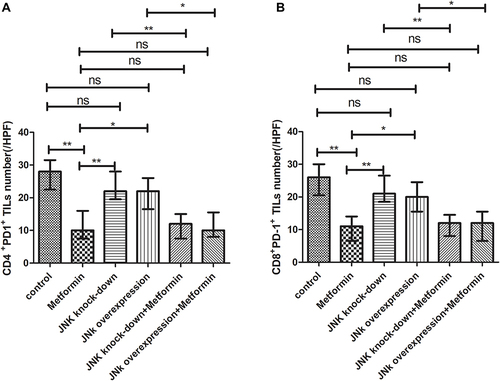
In mice inoculated with Wildtype 4T1, metformin increased the cell counts of CD4+ and CD8+TILs in TME that cell counts of CD4+TILs were 41/HPF in control vehicle group and increased to 82/HPF in metformin group; CD8+TILs were 47/HPF in control vehicle group and increased to 87/HPF in metformin group (p<0.05, and ). The mice inoculated with 4T1 JNK KD, had a reduced level of CD4+TILs (30/HPF) and CD8+TILs (30/HPF) than those inoculated with Wildtype 4T1 ( and ); but metformin administration reversed CD4+TILs and CD8+TILs to 62/HPF and 63/HPF, respectively, in mice with inoculation of 4T1 JNK KD (p<0.05, and ). The mice inoculated with 4T1 OVE JNK had the CD4+ TILs and CD8+ TILs increased to 66/HPF and 65/HPF, respectively, compared with mice inoculated with Wildtype 4T1 (p<0.05, and ), and metformin administration increased the cell counts of CD4+TILs and CD8+TILs to a higher extent (90/HPF and 110/HPF) in mice with inoculation of 4T1 OVE JNK (p<0.05, and ). But the CD8+/ CD4+TILs ratio had no significant difference between groups (p>0.05, ).
Figure 4 CD4+ TILs in tumor microenvironment of mice inoculated with breast cancer cells. (A) Inoculation of 4T1 cells. (B) Inoculation of 4T1 cells and metformin administration. (C) Inoculation of 4T1 cells with JNK knock-down. (D) Inoculation of 4T1 cells with JNK overexpression. (E) Inoculation of 4T1 cells with JNK knock-down and metformin administration. (F) Inoculation of 4T1 cells with JNK overexpression and metformin administration.
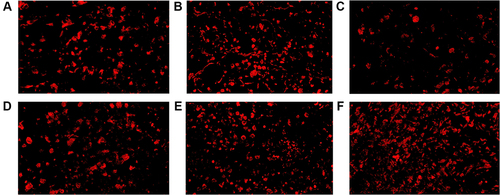
Figure 5 CD8+ TILs in tumor microenvironment of mice inoculated with breast cancer cells. (A) Inoculation of 4T1 cells. (B) Inoculation of 4T1 cells and metformin administration. (C) Inoculation of 4T1 cells with JNK knock-down. (D) Inoculation of 4T1 cells with JNK overexpression. (E) Inoculation of 4T1 cells with JNK knock-down and metformin administration. (F) Inoculation of 4T1 cells with JNK overexpression and metformin administration.
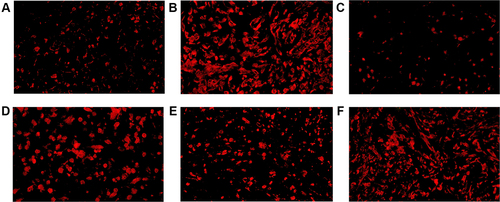
Figure 6 Statistical result of CD4+ and CD8+ TILs in tumor microenvironment of mice inoculated with breast cancer cells. (A) CD4+ TILs in tumor microenvironment. (B) CD4+ TILs in tumor microenvironment. (C) CD8+/CD4+ ratio. *p < 0.05, **p < 0.01, ns p > 0.05.
The mice inoculated with Wildtype 4T1, had the cell counts of CD4+/PD-1+TILs and CD8+/PD-1+TILs being 28/HPF and 26/HPF in control vehicle group and decreased to 10/HPF and 11/HPF in metformin group, respectively (p<0.05, and ). Compared with mice inoculated with Wildtype 4T1 cells, the mice inoculated with 4T1 JNK KD, had similar cell counts of CD4+/PD-1+ (22/HPF) and CD8+/PD-1+TILs (21/HPF) in control vehicle group; but the mice with 4T1 JNK KD inoculation and metformin administration had cell counts of CD4+/PD-1+ and CD8+/PD-1+TILs reduced to 12/HPF, with reference to those with 4T1 JNK KD inoculation (p<0.05, and ). The mice inoculated with 4T1 OVE JNK had similar cell counts of CD4+/PD-1+TILs (22/HPF) and CD8+/PD-1+TILs (20/HPF) to those with Wildtype 4T1 inoculation; however, the mice receiving 4T1 OVE JNK inoculation and metformin administration had the CD4+/PD-1+TILs and CD8+/PD-1+TILs reduced to 10/HPF and 12/HPF, respectively, lower than those with 4T1 OVE JNK inoculation (p<0.05, and ).
Figure 7 CD4+ TILs (red), PD-1+ TILs (green) and DAPI (blue) expression in tumor microenvironment of mice inoculated with breast cancer cells. (A) Inoculation of 4T1 cells. (B) Inoculation of 4T1 cells and metformin administration. (C) Inoculation of 4T1 cells with JNK knock-down. (D) Inoculation of 4T1 cells with JNK overexpression. (E) Inoculation of 4T1 cells with JNK knock-down and metformin administration. (F) Inoculation of 4T1 cells with JNK overexpression and metformin administration.
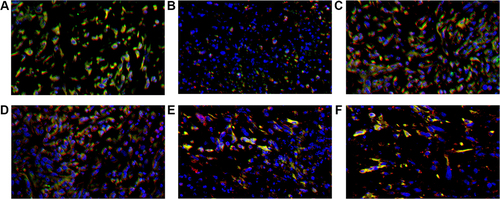
Figure 8 CD8+ TILs (red), PD-1+ TILs (green) and DAPI (blue) expression in tumor microenvironment of mice inoculated with breast cancer cells. (A) Inoculation of 4T1 cells. (B) Inoculation of 4T1 cells and metformin administration. (C) Inoculation of 4T1 cells with JNK knock-down. (D) Inoculation of 4T1 cells with JNK overexpression. (E) Inoculation of 4T1 cells with JNK knock-down and metformin administration. (F) Inoculation of 4T1 cells with JNK overexpression and metformin administration.
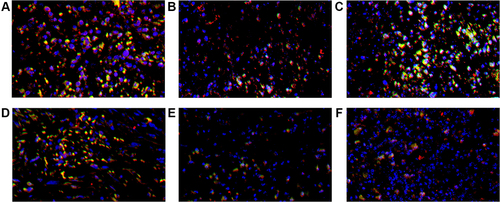
Figure 9 Statistical result of CD4+PD-1+ and CD8+ PD-1+TILs in tumor microenvironment of mice inoculated with breast cancer cells. (A) CD4+ PD-1+TILs in tumor microenvironment. (B) CD8+ PD-1+ TILs in tumor microenvironment. *p < 0.05, **p < 0.01, ns p > 0.05.
Metformin Reduced the IL-6 and TNF-α Production
Mice inoculated with Wildtype 4T1 and administered metformin, had reduced IL-6 (452.2pg/mL) than those inoculated with Wildtype 4T1 (509.6pg/mL, p<0.05, ). Compared with mice with Wildtype 4T1 inoculation, JNK KD and OVE JNK inoculation did not have significant effect on IL-6 production (). However, metformin administration reduced the IL-6 to 462.2pg/mL in mice inoculated with 4T1 JNK KD and 456.3pg/mL in mice inoculated with 4T1 OVE JNK, respectively ().
Figure 10 Secretion of inflammatory mediators by tumor tissue. (A) IL-6 secretion (B) TNF-α secretion. *p < 0.05, **p < 0.01, ns p > 0.05.
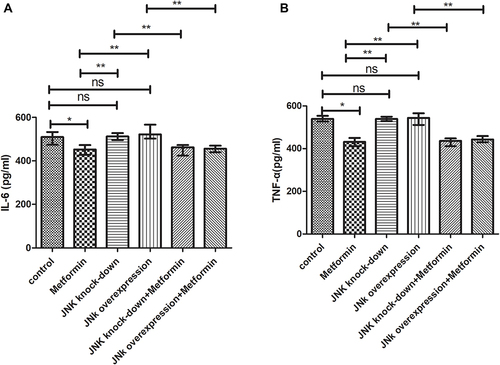
Similarly, metformin administration reduced TNF-α level to 432.3pg/mL from 539.6pg/mL in mice inoculated with Wildtype 4T1 (p<0.05, ). Inoculation with 4T1 JNK KD and 4T1 OVE JNK had no effect on TNF-α secretion, referring to the mice with Wildtype 4T1 inoculation (p>0.05, ). However, metformin administration reduced TNF-α level to 436.7pg/mL in mice with 4T1 JNK KD inoculation and 443.1pg/mL in mice with 4T1 OVE JNK inoculation (p<0.05, ).
Discussion
TNBC has an immunosuppressive TME among molecular subtypes of BC. Metformin and JNK pathway both had regulatory effect immune microenvironment of TNBC. The anti-tumor and immune regulatory effect from metformin was reported from previous studies.Citation14,Citation20,Citation21 Metformin could stimulate immune cells, particularly T cells, in TME, and we found that metformin increased the number of CD4+ and CD8+TILs in TNBC, but the CD8/CD4 ratio did not change with metformin treatment or JNK knock-down/overexpression. The regulatory T cells (Tregs) are subtypes of CD4+T cells and suppress the proliferation and infiltration of CD8+ T cells in the TME.Citation22 Therefore, the increase of CD4+T cells might not be positively correlated with the prognosis, while the increase of CD8/CD4 ratio could improve the prognosis.Citation23 However, the prognostic value of Tregs is variated with tumor types. Some studiesCitation24 suggested FOXP3+Tregs are positively correlated with CD8+T cells in ER negative BC Moreover, another clinical trialCitation25 showed that TNBC patients with higher infiltration of Tregs had better prognosis. Our study did not distinguish Tregs from CD4+TILs. Metformin was reported to prevent the differentiation of naive CD4+ T cells into Tregs, inhibited the proliferation and function of Tregs, and reversed the suppressive TME. Although there was no significant difference in the weight of xenograft tumor specimens between metformin treatment groups, the non-significant change might be related to the short time or low dose exposure of metformin.
MAPK signaling pathway involved in the regulation of innate immunity,Citation21 and metformin increased the phosphorylation of JNK and decreased the phosphorylation of RSK2 and CREB. JNK pathway activation was reported to downregulate cancer cell proliferationCitation27 and upregulate T cell activation and differentiation.Citation28 CREB is often overexpressed in hematopoietic and solid tumors.Citation29 Activation of CREB was related to increased tumor growth, resistance to anti-proliferative signals, enhanced angiogenesis, increased metabolism, and decreased apoptosis.Citation29 Oncogenic EGFR, Ras and BRAF activated the ERK/MAPK/RSK pathways in many tumors,Citation30 and hyperactive RSK signaling was found to induce cell transformation and tumor growth.Citation31 The anti-proliferative effect of metformin was also related with the downregulation of CERB and RSK2.
4T1 cells are similar to human TNBC, with negative ER, PR and HER-2. Compared with other molecular subtypes of BC, TNBC had the highest content of FoxP3+Tregs, and activated PD-1/PD-L1 pathway.Citation4,Citation32,Citation33 Ras/MAPK pathway activation could induce TNBC immunosuppression, and inhibition of this pathway could reverse the immune response.Citation34 JNK is a component of the MAPK signaling pathway, suppressing malignant cell differentiation and inducing apoptosis.Citation35 T cell activation and proliferation.Citation11 Metformin activated JNK signal pathway, increased the functional CD4+ and CD8+TILs infiltration and downregulated the exhausted CD4+ and CD8+TILs infiltration in TNBC. Besides JNK pathway, metformin promoted phosphorylation of AMPK, increased the number of CD8+TILs and protected effector TILs from apoptosis and exhaustion characterized by decreased production of IL-2, TNF-α, and IFN-γ.Citation14 Metformin transformed CD8+TILs from central memory status to effector memory status and decreased functional T cell exhaustion, by regulating AMPK-MTOR signaling pathway.
Although metformin reduced the number of CD4+/PD-1+and CD8+/PD-1+TILs, the JNK signaling pathway seemed to have no effect on the reduction. PD-1 is a checkpoint molecule in the immune responseCitation36 and PD-1 expression on T cells indicated a state of function exhaustion.Citation37 PD-1 expression inhibited T cell proliferation and induced functional depletion.Citation38 Metformin increased the cell counts of functional TILs and decreased the cell counts of exhausted TILs. However, PD-1 expression on CD4+ and CD8+T lymphocytes was increased under the stimulation of pro-inflammatory factors such as TNF-α and IL-6.Citation39–41 Metformin inhibited the synthesis of pro-inflammatory cytokines in the TME,Citation42 and we observed a reduction of the TNF-α and IL-6 production in our study. This reducing expression is linked with the inactivation of nuclear factor kappa B (NF-κB) and signal transducer and activator of transcription 3 (STAT3) signaling pathway.Citation43 Metformin reduced TNF-α and IL-6 expression by inhibiting NF-κB signaling pathway.Citation44,Citation45 The reduction of PD-1 expression might be related with the downregulation of TNF-α and IL-6 in TNBC.
Although CD8 + T cells could secrete perforin, IL-6, TNF-α, IFN-γ, so as to achieve cytotoxic efficacy.Citation46 The reduce of IL-6 and TNF-α might be related to the activation of AMPK pathway, induced by metformin. Metformin suppressed the synthesis of pro-inflammatory cytokines such as TNF-α, IL-6, IL-8Citation42 and VEGF, and the suppression was linked with the inactivation of NF-κB and STAT3, which were in an AMPK-dependent manner.Citation47 The activation AMPK pathway mediated the inactivation of NF-κB.
Metformin is a commonly used hypoglycemic drug and the dose used in our study was within a safe level. Thirty-eight adverse events were reported, suspected to be related with the combining treatment of metformin and immune checkpoint inhibitors. The study found that patients with lung cancer had an increased risk of inflammatory bowel disease and diarrhea during Nivolumab and metformin combination therapy.Citation48 Patients with hepatocellular carcinoma were prone to multiple organ dysfunction syndrome and lactic acidosis.Citation48 Patients with malignant melanoma had adverse events as interstitial lung lesions, decreased thyroglobulin, acute kidney injury, and pancreatic failure.Citation48 At present, there was little clinical evidence on metformin and the risk of immune-related adverse events.
Although we observed metformin affected the activation of JNK, RSK2 and CERB signal pathways, only JNK signal pathway was investigated by gene knockdown and overexpression. Metformin upregulated JNK pathway expression to affect functional TILs, but other MAPK pathways seemed to mediate the crosstalk effect between metformin and immune microenvironment in TNBC too, especially for exhausted TILs. It was the first limitation. The second limitation was that the immune regulatory effect of metformin in murine model needed to be validified in human studies.
Conclusion
Metformin increased the cell counts of CD4+ and CD8+TILs by increasing JNK phosphorylation in TNBC. Metformin also reduced the production of IL-6, TNF-α and the cell count of exhausted TILs in TNBC. Metformin had the potential to combined immunotherapy for TNBC.
Data Sharing Statement
The datasets generated during and/or analyzed during the current study are not publicly available but are available from the corresponding author on reasonable request.
Author Contributions
All authors made a significant contribution to the work reported, whether that is in the conception, study design, execution, acquisition of data, analysis and interpretation, or in all these areas; took part in drafting, revising or critically reviewing the article; gave final approval of the version to be published; have agreed on the journal to which the article has been submitted; and agree to be accountable for all aspects of the work.
Disclosure
The authors declare no conflicts of interest in this work.
Acknowledgment
This study was financially supported by Beijing Municipal Committee of Science and Technology (Z19110006619041) and Beijing Hospitals Authority (XMLX202114) and Open project of Beijing Key Laboratory of Tumor Therapeutic Vaccine (2019-KF04) and Youth Fund of Beijing Shijitan Hospital (2020-q01). The supporting organizations had no role in study design, data collection, analysis and interpretation.
References
- Siegel RL, Miller KD, Jemal A. Cancer statistics, 2020. CA Cancer J Clin. 2020;70(1):7–30. doi:10.3322/caac.21590
- Zheng S, Bai JQ, Li J, et al. The pathologic characteristics of breast cancer in China and its shift during 1999–2008: a national-wide multicenter cross-sectional image over 10 years. Int J Cancer. 2012;131(11):2622–2631. doi:10.1002/ijc.27513
- Cancer Genome Atlas Network. Comprehensive molecular portraits of human breast tumours. Nature. 2012;490(7418):61–70. doi:10.1038/nature11412
- Gatalica Z, Snyder C, Maney T, et al. Programmed cell death 1 (PD-1) and its ligand (PD-L1) in common cancers and their correlation with molecular cancer type. Cancer Epidemiol Biomarkers Prev. 2014;23(12):2965–2970. doi:10.1158/1055-9965.EPI-14-0654
- Wang R, Shi F, Zhao L, Zhao Y, Wu G, Song QK. High expression of E-cadherin and Ki-67 associated with functional/dysfunctional phenotypes of tumor-infiltrating lymphocytes among Chinese patients with operable breast cancer. J Int Med Res 2018;46(12):5219–5227. doi:10.1177/0300060518799567
- Verma R, Hanby AM, Horgan K, et al. Levels of different subtypes of tumour-infiltrating lymphocytes correlate with each other, with matched circulating lymphocytes, and with survival in breast cancer. Breast Cancer Res Treat. 2020;183(1):49–59. doi:10.1007/s10549-020-05757-5
- Adams S, Gray RJ, Demaria S, et al. Prognostic value of tumor-infiltrating lymphocytes in triple-negative breast cancers from two Phase III randomized adjuvant breast cancer trials: ECOG 2197 and ECOG 1199. J Clin Oncol. 2014;32(27):2959–2966. doi:10.1200/JCO.2013.55.0491
- Loi S, Michiels S, Salgado R, et al. Tumor infiltrating lymphocytes are prognostic in triple negative breast cancer and predictive for trastuzumab benefit in early breast cancer: results from the FinHER trial. Ann Oncol. 2014;25(8):1544–1550. doi:10.1093/annonc/mdu112
- Arneth B. Tumor microenvironment. Medicina. 2019;56(1). doi:10.3390/medicina56010015
- Loi S, Dushyanthen S, Beavis PA, et al. Correction: RAS/MAPK activation is associated with reduced tumor-infiltrating lymphocytes in triple-negative breast cancer: therapeutic cooperation between MEK and PD-1/PD-L1 Immune Checkpoint Inhibitors. Clin Cancer Res. 2019;25(4):1437. doi:10.1158/1078-0432.CCR-18-4264
- Blonska M, Lin X. CARMA1-mediated NF-kappaB and JNK activation in lymphocytes. Immunol Rev. 2009;228(1):199–211. doi:10.1111/j.1600-065X.2008.00749.x
- Foretz M, Guigas B, Viollet B. Understanding the glucoregulatory mechanisms of metformin in type 2 diabetes mellitus. Nat Rev Endocrinol. 2019;15(10):569–589. doi:10.1038/s41574-019-0242-2
- Vancura A, Bu P, Bhagwat M, Zeng J, Vancurova I. Metformin as an anticancer agent. Trends Pharmacol Sci. 2018;39(10):867–878. doi:10.1016/j.tips.2018.07.006
- Eikawa S, Nishida M, Mizukami S, Yamazaki C, Nakayama E, Udono H. Immune-mediated antitumor effect by type 2 diabetes drug, metformin. Proc Natl Acad Sci U S A. 2015;112(6):1809–1814. doi:10.1073/pnas.1417636112
- Cha JH, Yang WH, Xia W, et al. Metformin promotes antitumor immunity via endoplasmic-reticulum-associated degradation of PD-L1. Mol Cell. 2018;71(4):606–620.e7. doi:10.1016/j.molcel.2018.07.030
- Bahrambeigi S, Shafiei-Irannejad V. Immune-mediated anti-tumor effects of metformin; targeting metabolic reprogramming of T cells as a new possible mechanism for anti-cancer effects of metformin. Biochem Pharmacol. 2020;174:113787. doi:10.1016/j.bcp.2019.113787
- Loubière C, Dirat B, Tanti JF, Bost F. Metformine et cancer : de nouvelles perspectives pour un ancien médicament [New perspectives for metformin in cancer therapy]. Ann Endocrinol. 2013;74(2):130–136. French. doi:10.1016/j.ando.2013.02.002
- Daugan M, Dufaÿ Wojcicki A, d’Hayer B, Boudy V. Metformin: an anti-diabetic drug to fight cancer. Pharmacol Res. 2016;113:675–685. doi:10.1016/j.phrs.2016.10.006
- Stanton SE, Disis ML. Clinical significance of tumor-infiltrating lymphocytes in breast cancer. J Immunother Cancer. 2016;4(1):59. doi:10.1186/s40425-016-0165-6
- Pereira FV, Melo A, Low JS, et al. Metformin exerts antitumor activity via induction of multiple death pathways in tumor cells and activation of a protective immune response. Oncotarget. 2018;9(40):25808–25825. doi:10.18632/oncotarget.25380
- Xiao Y, Liu F, Li S, et al. Metformin promotes innate immunity through a conserved PMK-1/p38 MAPK pathway. Virulence. 2020;11(1):39–48. doi:10.1080/21505594.2019.1706305
- Huang Y, Ma C, Zhang Q, et al. CD4+ and CD8+ T cells have opposing roles in breast cancer progression and outcome. Oncotarget. 2015;6(19):17462–17478. doi:10.18632/oncotarget.3958
- Sato E, Olson SH, Ahn J, et al. Intraepithelial CD8+ tumor-infiltrating lymphocytes and a high CD8+/regulatory T cell ratio are associated with favorable prognosis in ovarian cancer. Proc Natl Acad Sci U S A. 2005;102(51):18538–18543. doi:10.1073/pnas.0509182102
- Mahmoud SM, Paish EC, Powe DG, et al. An evaluation of the clinical significance of FOXP3+ infiltrating cells in human breast cancer. Breast Cancer Res Treat. 2011;127(1):99–108. doi:10.1007/s10549-010-0987-8
- Lee S, Cho EY, Park YH, Ahn JS, Im YH. Prognostic impact of FOXP3 expression in triple-negative breast cancer. Acta Oncol. 2013;52(1):73–81. doi:10.3109/0284186X.2012.731520
- Kunisada Y, Eikawa S, Tomonobu N, et al. Attenuation of CD4+CD25+ regulatory T cells in the tumor microenvironment by metformin, a type 2 diabetes drug. EBioMedicine. 2017;25:154–164. doi:10.1016/j.ebiom.2017.10.009
- Heasley LE, Han SY. JNK regulation of oncogenesis. Mol Cells. 2006;21(2):167–173.
- Weiss L, Whitmarsh AJ, Yang DD, Rincón M, Davis RJ, Flavell RA. Regulation of c-Jun NH(2)-terminal kinase (Jnk) gene expression during T cell activation. J Exp Med. 2000;191(1):139–146. doi:10.1084/jem.191.1.139
- Steven A, Friedrich M, Jank P, et al. What turns CREB on? And off? And why does it matter. Cell Mol Life Sci. 2020;77(20):4049–4067. doi:10.1007/s00018-020-03525-8
- Lucien F, Brochu-Gaudreau K, Arsenault D, Harper K, Dubois CM, Welm AL. Hypoxia-induced invadopodia formation involves activation of NHE-1 by the p90 ribosomal S6 kinase (p90RSK). PLoS One. 2011;6(12):e28851. doi:10.1371/journal.pone.0028851
- Romeo Y, Zhang X, Roux PP. Regulation and function of the RSK family of protein kinases. Biochem J. 2012;441(2):553–569. doi:10.1042/BJ20110289
- Muenst S, Schaerli AR, Gao F, et al. Expression of programmed death ligand 1 (PD-L1) is associated with poor prognosis in human breast cancer. Breast Cancer Res Treat. 2014;146(1):15–24. doi:10.1007/s10549-014-2988-5
- Muenst S, Soysal SD, Gao F, Obermann EC, Oertli D, Gillanders WE. The presence of programmed death 1 (PD-1)-positive tumor-infiltrating lymphocytes is associated with poor prognosis in human breast cancer. Breast Cancer Res Treat. 2013;139(3):667–676. doi:10.1007/s10549-013-2581-3
- Loi S, Dushyanthen S, Beavis PA, et al. RAS/MAPK activation is associated with reduced tumor-infiltrating lymphocytes in triple-negative breast cancer: therapeutic cooperation between MEK and PD-1/PD-L1 immune checkpoint inhibitors. Clin Cancer Res. 2016;22(6):1499–1509. doi:10.1158/1078-0432.CCR-15-1125
- Hsieh S-C, Tsai J-P, Yang S-F, Tang M-J, Hsieh Y-H. Metformin inhibits the invasion of human hepatocellular carcinoma cells and enhances the chemosensitivity to sorafenib through a downregulation of the ERK/JNK-mediated NF-κB-dependent pathway that reduces uPA and MMP-9 expression. Amino Acids. 2014;46(12):2809–2822. doi:10.1007/s00726-014-1838-4
- Chamoto K, Al-Habsi M, Honjo T. Role of PD-1 in immunity and diseases. Curr Top Microbiol Immunol. 2017;410:75–97. doi:10.1007/82_2017_67
- Li F, Ren Y, Wang Z. Programmed death 1 Ligand 1 expression in breast cancer and its association with patients’ clinical parameters. J Cancer Res Ther. 2018;14(1):150–154. doi:10.4103/jcrt.JCRT_602_17
- Brusa D, Serra S, Coscia M, et al. The PD-1/PD-L1 axis contributes to T-cell dysfunction in chronic lymphocytic leukemia. Haematologica. 2013;98(6):953–963. doi:10.3324/haematol.2012.077537
- van Vught LA, Wiewel MA, Hoogendijk AJ, et al. The host response in patients with sepsis developing intensive care unit-acquired secondary infections. Am J Respir Crit Care Med. 2017;196(4):458–470. doi:10.1164/rccm.201606-1225OC
- Hotchkiss RS, Colston E, Yende S, et al. Immune checkpoint inhibition in sepsis: a Phase 1b randomized study to evaluate the safety, tolerability, pharmacokinetics, and pharmacodynamics of nivolumab. Intensive Care Med. 2019;45(10):1360–1371. doi:10.1007/s00134-019-05704-z
- Nakae S, Suto H, Iikura M, et al. Mast cells enhance T cell activation: importance of mast cell costimulatory molecules and secreted TNF. J Immunol. 2006;176(4):2238–2248. doi:10.4049/jimmunol.176.4.2238
- Takemura Y, Osuga Y, Yoshino O, et al. Metformin suppresses interleukin (IL)-1β-Induced IL-8 production, aromatase activation, and proliferation of endometriotic stromal cells. J Clin Endocrinol Metab. 2007;92(8):3213–3218. doi:10.1210/jc.2006-2486
- Yu H, Pardoll D, Jove R. STATs in cancer inflammation and immunity: a leading role for STAT3. Nat Rev Cancer. 2009;9(11):798–809. doi:10.1038/nrc2734
- Choi YK, Park KG. Metabolic roles of AMPK and metformin in cancer cells. Mol Cells. 2013;36(4):279–287. doi:10.1007/s10059-013-0169-8
- Salminen A, Hyttinen JM, Kaarniranta K. AMP-activated protein kinase inhibits NF-κB signaling and inflammation: impact on healthspan and lifespan. J Mol Med. 2011;89(7):667–676. doi:10.1007/s00109-011-0748-0
- O’Donnell JS, Teng M, Smyth MJ. Cancer immunoediting and resistance to T cell-based immunotherapy. Nat Rev Clin Oncol. 2019;16(3):151–167. doi:10.1038/s41571-018-0142-8
- Kim TH, Suh DH, Kim MK, Song YS. Metformin against cancer stem cells through the modulation of energy metabolism: special considerations on ovarian cancer. Biomed Res Int. 2014;2014:132702. doi:10.1155/2014/132702
- Zhou H, Liu J, Zhang Y, Zhang L. Inflammatory bowel disease associated with the combination treatment of nivolumab and metformin: data from the FDA adverse event reporting system. Cancer Chemother Pharmacol. 2019;83(3):599–601. doi:10.1007/s00280-018-03763-5