
Abstract
Purpose
The objective of the study was to identify subjects presenting hearing deficits, specifically age-related hearing losses (ARHL), via objective assessment methodologies.
Materials and Methods
Initially, 259 subjects (165 men, 94 women) were enrolled in the study. After the application of inclusion criteria, the final number was reduced to 88 subjects (49.8 ± 19.1 ys) subdivided into 64 normal and 83 ARHL cases. The subjects were assessed with traditional audiometry tests and with transiently evoked otoacoustic emissions (TEOAEs). Since each ear has its own acoustic signature, the TEOAE analyses were conducted in terms of ears and not subjects. The TEOAE data were processed by traditional and recurrence quantification analyses, leading to the estimation of the WWR (whole waveform reproducibility) and the new RAD2D (2-dimensional radius) parameters. A plot of WWR vs RAD2D was used to optimize the classification of the cases presenting ARHL.
Results
By using a WWR value of 70% as a classifier, the sensitivity of TEOAEs was estimated as 75.9% and the specificity as 89.1%. By using the RAD2D parameter (with a cut-off value of 1.78), a sensitivity value of 80.7% and a specificity value of 71.9% were obtained. When both parameters were used, a sensitivity value of 85.5% and a specificity value of 92.2% were estimated. In the latter classification paradigm, the number of false negatives decreased from 20 to 12 out of 83 ears (14%).
Conclusion
In adult hearing screening assessments, the proposed method optimizes the identification of subjects with a hearing impairment correlated to the presence of age-related hearing loss.
Plain Language Summary
This study was performed to discover early presbycusis. After the forties the eyes cannot see close images very well, and the ear cannot hear some frequencies (generally the higher ones) as well. In this study otoacoustic emissions were studied and analyzed. Otoacoustic emissions are very soft sounds coming out from the ear canal. In this work, a new method was proposed to analyze these signals. This method, based on recurrence quantification analysis (RQA) a widely used approach to analyze complex nonlinear signals, could reveal important information where conventional tools fail. In particular, new parameters, used to build a plot that can easily show cases presenting early presbycusis ears, were proposed with a consequently increase of TEOAEs predictability. These preliminary results obtained can be improved with a greater number of subjects observed.
Introduction
Age-related hearing loss (ARHL), or presbycusis, is a physiological progressive deterioration of hearing and it is one of the most frequently encountered chronic conditions in older adults. Presbycusis is a multi-factorial process involving complex interactions between intrinsic (genetic) and extrinsic (environmental) factors.Citation1–Citation4 The latter include exposure to environmental ototoxic agents (especially noise), vascular insults to the inner ear, metabolic changes, hormone imbalances and dietary issues.Citation5–Citation7 ARHL is characterized by a cochlear dysfunction, which includes loss of sensory cells, atrophy of the stria vascularis and loss of the spiral ganglion neurons.Citation1,Citation8 Different patterns of ARHL have been identified,Citation8 but the loss of outer hair cells (OHCs) in the cochlea is considered the most consistent damage.Citation1
Otoacoustic Emissions (OAEs) are acoustic signals, generated by the activity of the outer hair cells (OHCs) in the inner ear. OAEs are recorded by a sensitive probe placed inside the acoustic meatus. The responses are routinely categorized by the eliciting stimulus in evoked or in spontaneous OAEs (SOAEs), the latter being elicited by intrinsic noise sources in the inner ear. The evoked OAEs are further classified into transiently evoked OAEs (TEOAEs, evoked by a transient stimulus ie click, tone-burst, chirp) and distortion product OAEs (DPOAEs, evoked by two continuous tone stimuli).Citation9 In 1999, Shera and GuinanCitation10 offered a different taxonomy of OAEs, based on their generation mechanism and not on the eliciting stimulus. Despite the consensus on the work of Shera and Guinan, the TEOAE & DPOAE terminology is still in use in clinical practice.Citation23
OAEs provide an objective, accurate, and noninvasive tool for the assessment of the OHC status and the functionality of the cochlear amplifier. The data in the literature suggest that, OAEs are excellent tools to monitor cochlear stress induced by exogenous factors, such as ototoxic drugs, industrial solvents and high-level sound exposure.Citation11–Citation16 It has been hypothesized that OAEs may provide an early indication of a cochlear damage, in cases of noise-induced hearing loss (NIHL), even before the clinical evidence appears in the pure-tone audiometry measurements.Citation17,Citation18 In clinical terms, OAE-based protocols have been successfully applied to hearing screening of infants, schoolchildren, adolescents, etc.Citation19,Citation20
Considering that OAEs are sensitive indicators of pre-clinical hearing alterations, it can be hypothesized that OAE-based protocols could identify subjects with hearing losses, prior to the emergence of an ARHL audiometric profile. A normal audiometric profile is represented by hearing level (HL) values ≤ 20 dB for all tested frequencies, while an ARHL audiometric profile presents normal threshold values from 0.25–1 or 2 kHz and then slopes gradually to levels of mild or moderate hearing loss (ie hearing levels > 25 dB HL).Citation21
The relationship between OAEs and the hearing threshold in adult subjects is multi-factorial. Age has a significant effect on the amplitude of the TEOAE responses.Citation22–Citation26 However, in older adults, the influence of aging on the cochlear function cannot be easily determined, due to the presence of previously developed hearing-losses.Citation27,Citation28 Data in the literature suggest that the decrease in the TEOAE amplitude can be explained by a threshold shift caused by aging, but not by aging alone.Citation25–Citation29 TEOAE data from older adults, with mild hearing losses, show that the high TEOAE frequency components are consistently decreased, in comparison to the normative data.Citation29 In addition to the above, it has been observed in various hearing screening studies, that specific TEOAE variables (ie amplitude, WWR etc.), do not perform adequate as classifiers, resulting in a large number of false negatives.Citation29 In summary, the data in the literature suggest that the standard TEOAE variables, which are used to predict hearing threshold are not good predictors for age-related hearing losses. In this context, there is a need to improve the predictability power of TEOAEs, by introducing more-powerful parameters in the classification models.
In previous papers,Citation22,Citation23 we have introduced a TEOAE-derived parameter named RAD2D, which was shown to successfully identify subjects presenting noise induced hearing losses (specifically acoustic traumas) at 4 kHz. Moreover, the data have suggested that the RAD2D values, used in conjunction with the TEOAE variable whole waveform reproducibility (WWR), could successfully detect and quantify inner ear damage. Previously published data have suggested that this approach could identify sub-clinical or border-line cases presenting an acoustic trauma.Citation22
In this paper, we have applied the same approach in order to detect ARHL candidates. The WWR-RAD2D TEOAE methodology was applied on a group of volunteers, presenting cochlear hearing deficits and to a group of normal hearing subjects.
Materials and Methods
Subjects
Two hundred fifty nine subjects (165 men and 94 women), were assessed for the study. The majority of the subjects were enrolled because of subjective complaints concerning their hearing. All subjects were fully informed of the aim, design, and clinical applications of this study and provided their written consent. The study was approved by the Ethics Committee of the Catholic University, Rome, Italy, and the investigations were performed according to the principles of the Declaration of Helsinki.
All volunteers were assessed with the standard Audiometry and Tympanometry tests to rule out hearing losses different than ARHL. Conductive hearing loss was ruled out based on medical history, otoscopy and acoustic immittance measurements.
The inclusion criteria were:
Lack of any family background of hereditary hearing loss;
Lack of ear infections;
Lack of extensive use of antibiotics and antineoplastic drugs in the six months prior to the study;
No history of occupational or hobby-related noise exposure;
An audiogram shape corresponding to a normal or an ARHL profile. A normal profile considers hearing levels <= 20 dB HL from 0.25 to 8.0 kHz. The ARHL profile presents normal hearing levels up to 1.0-2.0 kHz and then a sloping increase of the hearing threshold.
A minimum age limit (for ARHL cases) of ≥ 50 years;
After the application of these criteria 88 subjects (49.8 ± 19.1 ys) were considered suitable for the study. Since each ear has its own acoustic signature, the subsequent analyses were conducted in terms of ears and not in terms of subjects. From the pool of 88 subjects, TEOAE responses from 147 ears were considered suitable for further analyses.
Included subjects. The enrolled ears were classified into two groups according to their audiometric profile: 64 ears (mean age = 32.57 ± 9.73 years) were assigned to the Normal group and 83 ears (mean age = 60.67 ± 12.76 years) to the ARHL group.
To better study the effects of age on the TEOAE variables, the ARHL group was initially subdivided in 5 age sub-groups, namely into: P1 (50–60 yrs), P2 (61–64 yrs), P3 (65–70 yrs), P4 (71–75 yrs) and P5 (> 75 yrs). Unfortunately, the low number of subjects per group could influence the power of the statistical inferences, therefore in order to increase the statistical inference of the results, in a second step, the ARHL subjects were re-grouped into 3 age sub-groups, named: Q1 (50–62 yrs), Q2 (63–70 yrs), and Q3 (> 70 yrs).
These data are summarized in (part B) and , shown in the Results section.
Table 1 (A) Mean Values of REC, DET, RAD2D and WWR in the Normal and ARHL Groups. (B) Mean Values of These Parameters Across the 5 ARHL Sub-Groups (The Same of )
Table 2 Mean Values of REC, DET, RAD2D and WWR Parameters Across the 3 ARHL Sub-Groups (Q1, Q2, Q3)
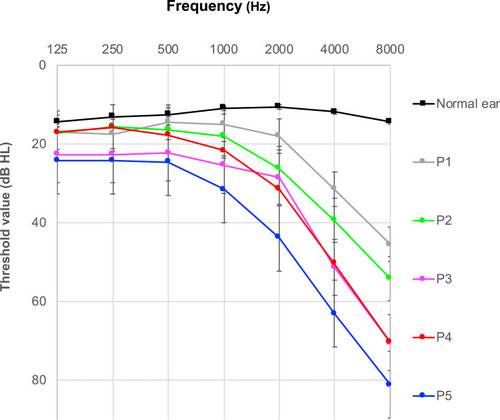
Figure 1 Mean pure-tone hearing thresholds averaged, from the normal and the ARHL TEOAE data.
Audiological Testing
All subjects underwent a standard hearing assessment including: 1) otoscopic examination; 2) 226-Hz tympanometry, to exclude middle ear pathologies; and 3) conventional pure tone audiometric testing. The latter was carried out in a soundproof room and pure-tone audiometry (PTA) hearing levels were measured bilaterally in steps of 5 dB HL, at 0.125, 0.25, 0.50, 1, 2, 4, and 8 kHz (AC-40, Interacoustics Co, Assens, Denmark).
The audiogram profiles of the initial five ARHL subgroups are depicted in .
The TEOAE responses were collected following the same procedures reported in a previous paper.Citation22 The data were recorded by an adult probe of the ILO92 device (Otodynamics Ltd, Hatfield, UK), running software ver 6.0. A differential non-linear protocol was used (80 μs clicks presented at 50/s with a 75–85 dB SPL stimulus intensity) and the responses were obtained after averaging data from 256 click stimuli. A TEOAE response was considered as normal if the TEOAE correlation value WWR was >70% and the overall signal-to noise-ratio (SNR) > than 3 dB. If these criteria were not met, an additional trial was conducted, since this was an indication of a technical problem or of a possible hearing impairment.Citation30
RQA-PCA of TEOAE Signals
The TEOAE signals were analyzed using recurrence quantification analysis (RQA) and Principal Component Analysis (PCA) techniques, to reduce the inter-subject variability. A detailed presentation of these methods is included in the Appendix section A1 and A2. The RQA method describes the dynamical structure of the analyzed signals and not the Signal to Noise differences, commonly used in the estimation of the Signal to Noise Ratios (S/N). The recurrence quantification analysis is applicable to many different types of data, from times series related to financial crises,Citation33,Citation34 to geophysical data related to seismologyCitation35 and biomedical data related to physiological processes.Citation36
The software used for the recurrence quantification analysis, the creation of the Recurrence plots and other utilities, was downloaded from http://cwebber.sites.luc.edu/ (last Accessed in Gen. 2020).
Principal Component Analysis is a common statistical technique, which provides some interesting features: (i) it can reduce the dimension of the dataset without any consistent loss of information; and (ii) it can clearly separate the independent features which characterize the data set.Citation37 More details on the different steps of this analysis are presented in the Appendix section A. The PCA procedure was performed by SPSS version 24.0 software (SPSS Inc., Chicago, IL). TEOAE data from the Normal and ARHL groups were decomposed by RQA and PCA methods. Moreover, for each TEOAE response, a two-dimensional parameter RAD2D was estimated based on information from three RQA-PCA descriptors (additional details on the RAD2D estimation are included in the Appendix section A3).Citation23
Statistical Analysis of the TEOAE Waveform Parameters
Statistical analyses were performed on the following parameters: i) age; (ii) TEOAE reproducibility (WWR); (iii) hearing threshold levels at 1kHz, 2kHz, 4kHz and 8kHz); (iv) RQA parameters REC, DET and ENT (see the Appendix section A for their definitions); (v) the first two coordinates PC1, and PC2 of the PCA; and (vi) the RAD2D parameter.
Pearson’s correlations, among the above parameters, were estimated. Differences between the Normal and ARHL group-means were assessed via two-tailed t-tests. ANOVA analyses were conducted for the P1, P2, P3, P4 and P5 and successively for Q1, Q2 and Q3 age groups.
Statistical significance was defined as p ≤ 0.05. All statistical analysis was performed by SPSS version 24.0 software (SPSS Inc., Chicago, IL).
Results
TEOAE Dynamic Structure
(upper part A) shows the estimated mean values of the RQA parameters REC and DET, the newly proposed RAD2D parameter and the TEOAE reproducibility value for the Normal and the ARHL groups (first two rows). The inter-group differences of all these parameters were found as statistically significant, with a p <0.01. The data suggest that there is an alteration of the TEOAE deterministic structure (indicated by the values of the DET parameter) among the two groups. The normal TEOAE responses were found more complex (less deterministic) than the responses from the ARHL group.
The effects of age on the REC, DET, WWR and RAD2D parameters resulted more challenging than expected. Independent ANOVA measures, suggested that these parameters do not change significantly, among the 5 different age subgroups. The means and standard deviations of these parameters are reported in part B of . The ARHL data were re-grouped in 3 age sub-groups, Q1 (50–62 yrs), Q2 (63–70 yrs), and Q3 (> 70 yrs). The ANOVA results verified the findings from the 5 group analysis, suggesting that the 4 tested parameters do not change significantly, among the age-groups. The mean data from the 3 ARHL age groups are shown in . Considering these findings, the data from the Q1, Q2, Q3 age groups were considered for the subsequent analyses.
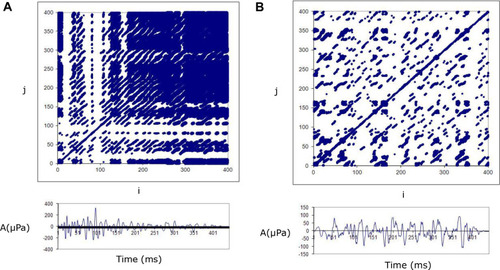
The differences reported in part A of were also reflected in the structure of the Recurrence plots (RP). An example is shown in : the data on the left are from a Normal Subject and those on the Right from an ARHL case. The top Panels show the recurrence plots (RPs) of the recorded TEOAEs and the lower panels show the amplitude of actual TEOAE responses. The recurrence plot from the normal TEOAE response shows a different organization than the plot from the ARHL case, in terms of deterministic structure reduction. Looking at the data of , it is evident that few and isolated recurrence points are observable in the TEOAE response from the ARHL case; the signal disappears and emerges only the typical chaotic texture of noise.
Figure 2 TypicalCitation32 recurrence plots (top panel) and the corresponding TEOAE responses (bottom panel) from a normal and an ARHL case.
From the recurrence plots and their corresponding measures, additional interesting details of the TEOAE signals can be observed, which are listed below:
The degree of the TEOAE deterministic structure may be estimated by quantifying how many sequences of recurrent points are present (in , DETNH=88.89; DETARHL= 54.89).
The complexity of the signal may be evaluated by computing the Shannon entropy of the length distribution, of the recurrent points sequences (ie number of data points forming a recurring sequence). For the normal group the ENTNT was estimated as 5.52, whereas the ENTARHL was estimated as 3.84. The data show the normal TEOAE responses are characterized by a higher complexity.
The stability of the system may be measured by the longest sequence of recurrent points (MAXLINE). This length is inversely related to the largest positive Lyapunov exponent, which, in turn, is a quantitative measure of the sensitive dependence of a time series on the initial conditions. In particular, a large positive Lyapunov exponent indicates chaos.Citation31 A small MAXLINE corresponds to a high Lyapunov exponent, meaning a large amount of “chaos” and vice versa (MAXLINENH=333 > MAXLINEARHL=94).
Finally, it is possible to estimate the trend variable which describes how stationary the system is during the period of the measurement. Systems showing a drift may have positive or negative trend values, whereas systems without drift have values close to zero. (TRENDNH=10.753 > TRENDARHL=−91.19)
In summary, looking at the data of , it is evident that few and isolated recurrence points are observable in the TEOAE response from the ARHL case; the signal disappears and emerges only the typical chaotic texture of noise.
Classification Based on RAD2D
In order to evaluate whether the RAD2D parameter could be used effectively in the detection of ARHL, RAD2D and WWR values were plotted in a scattering plot shown in . The reader can consult section A2 of the Appendix showing information regarding the used classification options.
Figure 3 WWR vs RAD2 in the ARHL group.
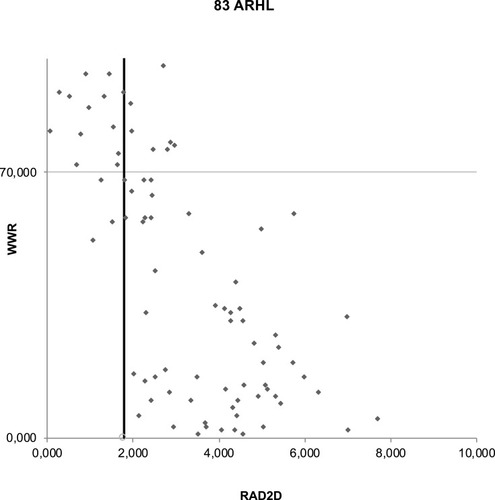
shows WWR vs RAD2D data from the 83 ARHL ears. From and it is possible to observe that RAD2D increases with age. The higher the RAD2D value, the greater the distance of the corresponding signal from the origin of the reference circle of normal hearing in the PC1/PC2 plane.
In order to interpret the data on the PC1/PC2 plane, we have considered the threshold values of the two plotted parameters. These correspond to a WWR value of 70 (minimum acceptable correlation of a TEOAE response) and a RAD2D value of 1.78.Citation23 By applying these thresholds, is shown divided in 4 quadrants (shown as A, B, C and D).The points above the horizontal line (area of A+B where WWR > 70) indicate data from PASS (acceptable) TEOAE responses, while those under the horizontal line (area C+D where WWR < 70) indicate data from FAIL responses (ie technical problems or presence of hearing deficits). The points positioned at the left side of the vertical line (area A+C where RAD2D < 1.78) indicate data from responses which fall inside the normality circle, corresponding to PASS signals according the RAD2D parameter. The points positioned to the right of the threshold line (area B+D where RA2D > 1.78) indicate data from FAIL responses.
Using the WWR threshold criterion on the ARHL group, 63 of the 83 ears were correctly identified. The remaining 20 ears (24%) presenting a WWR >70% were affected in any case by a sensorineural hearing loss in one or more frequencies in the audiogram. By using only the RAD2D 17 (20,4%) cases were erroneously classified as normal.
Upon using as a classifying criterion, a RAD2D value of >1.78 in conjunction with the WWR value of > 70%, the number of false negatives decreased from 20 to 12 ears out of 83 (14%). The data points which are shown in the right upward rectangle (B) in , correspond to ears with both high WWR and elevated RAD2D: these 8 points indicate 8 ears resulted as PASS by WWR but identified as “fail” by RAD2D. These ears represent the gain in the capture rate of the newly proposed methodology.
Comparing Normal and ARHL ears (as classified initially by their PTA), the sensitivity of TEOAEs (by using WWR) was estimated as 75.9% and the specificity as 89.1%. Using only the RAD2D estimate (cut-off=1.78) a sensitivity of 80.7% and specificity of 71.9% was obtained. When the RAD2D and WWR values were combined, a sensitivity of 85.5% and a specificity of 92.2% was obtained.
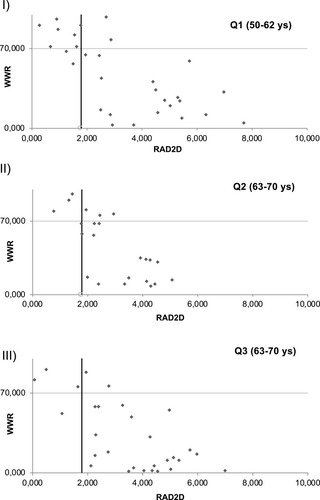
shows the WWR/RAD2D plots from the 3 age subgroups Q1, Q2, Q3. It is possible to observe that the sensitivity increases as the mean age increases: the sensitivity was estimated as 63% in Q1, 77% in Q2 and 88% in Q3, respectively. From the graphs in can be seen that the new proposed methodology improves the classification yield by the same amount of ears, per age-group.
Figure 4 WWR vs RAD2 in different ARHL age groups.
Discussion
Screening protocols are fundamental for the early diagnosis of hearing impairment even if neither behavioral nor acoustic procedures can provide sufficiently reliable diagnostic tools with a sensitivity and a specificity close to 100%.
The primary aim of this study was to demonstrate that RAD2D, an adjunctive global parameter obtained by the TEOAEs analysis, could be easily used in conjunction with the reproducibility TEOAE parameter (WWR), to improve the detection of cochlear damage in the ARHL cases.
The objectives of this study were formulated from the results of a previous paper where the RAD2D parameter improved the early detection of cochlear damage in Impaired Hearing (IH) subjects with 4-kHz notches.Citation22 Moreover, the classification effectiveness of the RAD2D parameter was validated by an ear simulation model where the cochlea was assumed to be an active electronic circuit including OHC active processes. In fact, it was demonstrated that the RAD2D was able to quantify the hearing impairment, by correlating the waveform dynamic structure of TEOAEs with the amount of hearing deficit.Citation22
It is well known that in order to improve the pass-fail criteria of OAE-based hearing screening protocols, more complex TEOAE analysis procedures are needed. Therefore, the Fourier Transform, the wavelet transform, and other time-frequency analyses of the standard TEOAE signals are reported to increase the TEOAE classification specificity and sensitivity, in comparison to the TEOAE WWR.Citation38 However, among these descriptive parameters, there is no one descriptor detecting cochlear pathology.Citation22,Citation39
In this study the RQA analysis was applied to TEOAEs, without any previous mathematical assumptions and data manipulation. This method is particularly suited for signals exhibiting clear frequency dispersion over time, as well as signals characterized by high sensitivity and low specificity such as TEOAEs. The most impressive feature of TEOAE amplitude is its large variability; specifically, in ARHL ears the amplitude of otoacoustic emissions is known to decrease with increasing age.Citation13 The independence of RQA (and consequently of RAD2D) from signal amplitude provides a better focus on a still relatively neglected dimension on TEOAE dynamics that can be used in different applicative as well as theoretical realms. The specific selection of ARHL ears (of subjects older than 50 years with a slope in pure tone audiogram threshold values in the frequency range of 2–8 kHz), evidenced a decrease of determinism in the considered signals (ie, the mean of percent of determinism (DET) values obtained in ARHL group were lower than those obtained for Normal one).
The differences between the two sets of signals are related to their dynamical features as evident by the involvement of DET parameter; on the contrary, as previously observed, the intensities of the TEOAE signals are comparable between the two groups.
The obtained results can be summarized as follows: a) the combined use of the RQA and PCA analysis is a useful method to detect mild sensorineural hearing loss in screening protocols in aged patients; b) the correlation between RAD2D value and WWR parameter is significant as it was hypothesized the auditory functionality was poorer at higher RAD2D values and lower WWR values; c) adding RAD2D information to that obtained by WWR a relevant increase of sensitivity and specificity can be obtained.
To prevent and mitigate noise due to individual variability in the cochlea, the proposed procedure could be employed in longitudinal studiesCitation20 as well as to test the efficacy of new pharmacological treatments. The effectiveness of the method could be improved by using a larger database considering many different hearing losses. Finally, this new RAD2D parameter could lead to the formulation of a general hearing conservation program in presbycusis and of a protection program in noise induced hearing losses.
Limitations
An obvious limitation of this study, but common to all OAE studies, is that any damage to inner hair cells or spiral ganglion neurons or higher structures along the auditory pathway cannot be detected by the OAE measurements. Moreover, the achieved results are strictly related to the chosen cut-off value of RAD2D (i.e, 1.78) and WWR (70%).Citation23 In this context, the application of the methodology to a larger set of data could corroborate the estimate of optimized threshold criteria.
Conclusion
The RAD2D parameter may be useful in hearing screenings to identify hearing impairments when the hearing losses are not yet severe; it could help in an earlier identification with respect to conventional audiometry and TEOAE pass/fail test. Preliminary data suggest that a plot of WWR vs RAD2D is an easy and useful way to identify subjects with hearing impairment with a consequently increase of TEOAEs predictability.
Abbreviations
NH, normal hearing; ARHL, age-related hearing loss; OAE, otoacoustic emission; TEOAE, transiently evoked otoacoustic emission; OHC, outer hair cell; HL, hearing level; IH, impaired-hearing; PCA, principal component analysis; PTA, pure-tone audiometry; RAD2D, “two-dimensional radius” in PC1/PC2 plane; WWR, whole waveform reproducibility (named also “Repro”); RQA, recurrences quantification analysis; RP, recurrence plots.
Acknowledgments
We thank Laura Guidetti, Carlo Baldari and Marco De Spirito for their useful suggestions.
Disclosure
The authors report no conflicts of interest in this work.
References
- Fetoni AR, Picciotti PM, Paludetti G, Troiani D. Pathogenesis of presbycusis in animal models: a review. Exp Gerontol. 2011;46(6):413–425. doi:10.1016/j.exger.2010.12.00321211561
- Gates GA, Mills JH. Presbycusis. Lancet. 2005;366(9491):1111–1120. doi:10.1016/S0140-6736(05)67423-516182900
- Jenning CR, Jones NS. Presbycusis. J Laryngol Otol. 2001;115(3):171–178. doi:10.1258/002221501190698411244520
- Kujawa SG, Liberman MC. Acceleration of age-related hearing loss by early noise exposure: evidence of a misspent youth. J Neurosci. 2006;26(7):2115–2123. doi:10.1523/JNEUROSCI.4985-05.200616481444
- Fetoni AR, Zorzi V, Paciello F, et al. Cx26 partial loss causes accelerated presbycusis by redox imbalance and dysregulation of Nfr2 pathway. Redox Biol. 2018;19:301–317. doi:10.1016/j.redox.2018.08.00230199819
- Bielefeld EC, Tanaka C, Chen GD, Henderson D. Age-related hearing loss: is it a preventable condition? Hear Res. 2010;264(1–2):98–107. doi:10.1016/j.heares.2009.09.00119735708
- Mazelová J, Popelar J, Syka J. Auditory function in presbycusis: peripheral vs. central changes. Exp Gerontol. 2003;38(1–2):87–94. doi:10.1016/S0531-5565(02)00155-912543265
- Schuknecht HF, Gacek MR. Cochlear pathology in presbycusis. Ann Otol Rhinol Laryngol. 1993;102(1_suppl):1–16. doi:10.1177/00034894931020S101
- Kemp DT. Stimulated acoustic emissions from within the human auditory system. J Acoust. Soc Am. 1978;64(5):1386–1391. doi:10.1121/1.382104744838
- Shera CA, Guinan JJ. Evoked otoacoustic emissions arise by two fundamentally different mechanisms: a taxonomy for mammalian OAEs. J Acoust Soc Am. 1999;105(2):782–798. doi:10.1121/1.4269489972564
- Probst R, Lonsbury-Martin BL, Martin GK. A review of otoacoustic emissions. J Acoust Soc Am. 1991;89:2027–2067. doi:10.1121/1.4008971860995
- Avan P, Bonfils P, Mom T. Correlations among distortion product otoacoustic emissions, thresholds and sensory cell impairment In: Henderson D, Prasaher D, Kopke R, Salvi R, Hamernik RP, editors. Noise Induced Hearing Loss: Basic Mechanisms, Prevention and Control. London, UK: Noise Research Networks Publications; 2001:411–427.
- Avan P, Bonfils P. Distortion-product otoacoustic emission spectra and high-resolution audiometry in noise-induced hearing loss. Hear Res. 2005;209(1–2):68–75. doi:10.1016/j.heares.2005.06.00816112827
- Uchida Y, Ando F, Shimokata H, Sugiura S, Ueda H, Nakashima T. The effects of aging on distortion-product otoacoustic emissions in adults with normal hearing. Ear Hear. 2008;29(2):176–184. doi:10.1097/AUD.0b013e3181634eb818595184
- Hamdan AL, Abouchacra KS, Zeki AG. Transient-evoked otoacoustic emissions in a group of professional singers who have normal pure-tone hearing thresholds. Ear Hear. 2008;29(3):360–377. doi:10.1097/AUD.0b013e31816a0d1e18382377
- Fetoni AR, Piacentini R, Fiorita A, Paludetti G, Troiani D. Water-soluble coenzyme Q10 formulation Q-ter promotes outer hair cells survival in a guinea pig model of noise induced hearing loss IH. Brain Res. 2009;1257:108–116. doi:10.1016/j.brainres.2008.12.02719133240
- Attias J, Furst M, Furman V, et al. Noise-induced otoacoustic emission loss with or without hearing loss. Ear Hear. 1995;16:612–618. doi:10.1097/00003446-199512000-000078747810
- Shupak A, Tal D, Sharoni Z, Oren M, Ravid A, Pratt H. Otoacoustic emissions in early noise-induced hearing loss. Otol Neurotol. 2007;28(6):745–752. doi:10.1097/MAO.0b013e3180a726c917721363
- Hatzopoulos S, Grzanka A, Martini A, Konopka W. New clinical insights for transiently evoked otoacoustic emission protocols. Med Sci Monit. 2009;15(8):CR403–408.19644416
- Helleman HW, Jansen EJ, Dreschler WA. Otoacoustic emissions in a hearing conservation program: general applicability in longitudinal monitoring and the relation to changes in pure-tone thresholds. Int J Audiol. 2010;49(6):410–419. doi:10.3109/1499202090352761620192875
- Moscicki E, Elkins E, Baum H, McNamara P. Hearing loss in the elderly: an epidemiologic study of the framingham heart society cohort. Ear Hear. 1985;6:184–190. doi:10.1097/00003446-198507000-000034043571
- Zimatore G, Fetoni AR, Paludetti G, Cavagnaro M, Podda MV, Troiani D. Post-processing analysis of transient-evoked otoacoustic emissions to detect 4 kHz-notch hearing impairment – a pilot study. Med Sci Monit. 2011;17(6):MT41–49. doi:10.12659/MSM.88179321629197
- Zimatore G, Cavagnaro M. Recurrences analysis of otoacoustic emissions” Chapter 8 In: Charles W, Marwan N, editors. Recurrence Quantification Analysis. Theory and Best Practices. Springer Publisher Recurrence Quantification Analysis; 2015:253–278.
- Zimatore G, Hatzopoulos S, Giuliani A, Martini A, Colosimo A. Comparison of transient otoacoustic emission responses from neonatal and adult ears. J Appl Physiol. 2002;92(6):2521–2528. doi:10.1152/japplphysiol.01163.200112015368
- Zimatore G, Cavagnaro M, Giuliani A, Colosimo A. Human acoustic fingerprints. Biophys Bioeng. 2008;1(2):1–8.
- Zimatore G, Hatzopoulos S, Giuliani A, Martini A, Colosimo A. Otoacoustic emissions at different click intensities: invariant and subject dependent features. J Appl Physiol. 2003;95(6):2299–2305. doi:10.1152/japplphysiol.00667.200312937032
- Balatsouras D, Kaberos A, Karapantzos E, Homsioglou E, Economou NC, Korres S. Correlation of transiently evoked otoacoustic emission measures to auditory thresholds. Med Sci Monit. 2004;10(2):MT24–30.14737052
- Hoth S, Gudmundsdottir K, Plinkert P. Age dependence of otoacoustic emissions: the loss of amplitude is primarily caused by age-related hearing loss and not by aging alone. Eur Arch Otorhinol. 2010;267(5):679–690. doi:10.1007/s00405-009-1106-5
- Castor X, Veuillet E, Morgon A, Collet L. Influence of aging on active cochlear micromechanical properties and on the medial olivocochlear system in humans. Hear Res. 1994;77(1–2):1–8. doi:10.1016/0378-5955(94)90248-87928721
- Jacobson JT, Jacobson CA. Otodynamics. ILO OAE Instrument User Manual. ILO OAE Instrument User Manual. Issue 5a. London: Otodynamics Ltd; 1997.
- Webber CL, Zbilut JP. Dynamical assessment of physiological systems and states using recurrence plot strategy. J Appl Physiol. 1994;76:965. doi:10.1152/jappl.1994.76.2.9658175612
- Marwan N, Romano MC, Thiel M, Kurths J. Recurrence plots for the analysis of complex systems. Phys Rep. 2004;438(5–6):237–329. doi:10.1016/j.physrep.2006.11.001
- Orlando G, Zimatore G. Recurrence quantification analysis of business cycles. Chaos Solitons Fractals. 2018;110:82–94. doi:10.1016/j.chaos.2018.02.032
- Orlando G, Zimatore G. Recurrence quantification analysis on a kaldorian business cycle model nonlinear dynamics. Nonlinear Dyn. 2020;100(1):785–801. doi:10.1007/s11071-020-05511-y
- Zimatore G, Garilli G, Poscolieri M, Rafanelli C, Gizzi F, Lazzari M. The remarkable coherence between two Italian far away recording stations points to a role of acoustic emissions from crustal rocks for earthquake analysis. Chaos: Interdiscip J Nonlinear Sci. 2017;27(4):043101. doi:10.1063/1.4979351
- Zimatore G, Gallotta MC, Innocenti L, et al. Recurrence quantification analysis of heart rate variability during continuous incremental exercise test in obese subjects. Chaos Interd J Non Lin Sci. 2020;30:3.
- Bartholomew DJ. The foundation of factor analysis. Biometrika. 1984;71:221–232. doi:10.1093/biomet/71.2.221
- Vinck BM, van Cauwenberge PB, Leroy L, Corthals P. Sensitivity of transient evoked and distortion product otoacoustic emissions to the direct effects of noise on the human cochlea. Audiology. 1999;38(1):44–52. doi:10.3109/0020609990907300110052835
- Zimatore G, Giuliani A, Parlapiano C, et al. Revealing deterministic structures in click-evoked otoacoustic emissions. J Appl Physiol. 2000;88(4):1431–1437. doi:10.1152/jappl.2000.88.4.143110749839