
Abstract
Background
There is evidence that abnormal expression of lncRNAs is associated with hepatitis B virus (HBV) infection-induced hepatocellular carcinoma (HCC). However, the mechanisms remain not fully elucidated. The study aimed to identify novel lncRNAs and explore their underlying mechanisms based on the ceRNA hypothesis.
Methods
The RNA and miRNA expression profiling in 20 tumor and matched adjacent tissues from HBV–HCC patients were retrieved from the Gene Expression Omnibus database under accession numbers GSE77509 and GSE76903, respectively. Differentially expressed lncRNAs (DELs), miRNAs (DEMs), and genes (DEGs) were identified using the EdgeR package. Protein–protein interaction (PPI) network was constructed for DEGs followed by module analysis. The ceRNA network was constructed based on interaction relationships between miRNAs and mRNAs/lncRNAs. The functions of DEGs were predicted using DAVID and BinGO databases. The prognosis values (overall survival [OS] and recurrence-free survival [RFS]) of ceRNA network genes were determined using The Cancer Genome Atlas (TCGA) data with Cox regression analysis and Kaplan–Meier method.
Results
The present study screened 643 DELs, 83 DEMs, and 1,187 DEGs. PPI network analysis demonstrated that CDK1 and CCNE1 were hub genes and extracted in functionally related modules. E2F2, CDK1, and CCNE1 were significantly enriched into cell cycle pathway. FAM182B-miR-125b-5p-E2F2 and LINC00346-miR-10a-5p-CDK1/CCNE1 ceRNA axes were obtained by constructing the ceRNA network. Patients with high expressions of DELs and DEGs in the above ceRNA axes had poor OS, while patients with the high expression of DEMs possessed excellent OS. CDK1 was also an RFS-related biomarker, with its high expression predicting poor RFS. The upregulation of LINC00346 and CDK1 but the downregulation of miR-10a-5p in HCC was validated in other microarray datasets and TCGA database.
Conclusion
The LINC00346-miR-10a-5p-CDK1 axis may be an important mechanism for HBV-related HCC, and genes in this ceRNA axis may be potential prognostic biomarkers and therapeutic targets.
Introduction
Hepatocellular carcinoma (HCC) is the fourth most prevalent human malignancy and the third cause of cancer-related deaths in China.Citation1 In 2015, it is estimated that there are 466,100 new cases and 422,100 deaths due to this disease.Citation1 Although patients with HCC can be managed with a series of therapeutic methods (including surgical resection, adjuvant chemotherapy, radiotherapy, and liver transplantation), the overall 5-year survival rate still remains poor (less than 20%).Citation2 Epidemiological studies have shown that chronic hepatitis B virus (HBV) infection is the predominant risk factor for the development, metastasis, and recurrence of HCC, accounting for about 80% of all HCC in China.Citation3-5 Thus, it is necessary to further investigate the molecular mechanisms of HBV-related HCC in order to screen novel prognostic biomarkers and develop effective therapeutic strategies.
Recently, there have studies to indicate that the abnormal expression of lncRNAs, a class of noncoding RNAs longer than 200 nt in length, is associated with the development of various cancers, including HBV-related HCC.Citation6,Citation7 For example, Zuo et al found that lncRNA AX800134 was upregulated in HBV-positive HCC compared with HBV-negative HCC. Silencing AX800134 with siRNA interference significantly suppressed the growth and invasion but enhanced spontaneous apoptosis of HBx-expressing HepG2 cells.Citation8 The study of Lv et al revealed that the expression of lncRNA DREH was frequently downregulated in HBV-associated HCC tissues in comparison with adjacent noncancerous hepatic tissues. Inhibition of DREH expression by HBx remarkably promoted the proliferation of HCC cells in vitro and in vivo.Citation9 Yang et al identified that lncRNA-HEIH was highly expressed in liver samples from patients with HBV-related HCC. The expression level of lncRNA-HEIH in HBV-related HCC was significantly associated with recurrence and was an independent prognostic factor for survival.Citation10 However, the mechanisms of lncRNAs in HBV-related HCC remain not fully elucidated.
Previously, emerging evidence has demonstrated that lncRNAs may function as molecular sponges for a miRNA through their miRNAs response elements (MREs) and thereby influence the translation inhibition or mRNA degradation of the transcript on the targets by the respective miRNAs, which is proposed as ceRNA hypothesis.Citation11 Accumulating data also indicated that this regulatory action plays important roles in HCC development.Citation12,Citation13 For example, Lv et alCitation14 showed that lnRNA Unigene56159 promoted the migration and invasion of HCC cells by acting as a ceRNA for miR-140-5p to de-repress the expression of Slug and induce the epithelial–mesenchymal transition (EMT). Mo et alCitation15 observed the upregulated LINC01287 competitively bound to miR-298 and increased the expression of its target gene STAT3 to promote EMT and invasion of HCC cells. lncRNA n335586 was also reported to promote EMT of HCC cells and then migration as well as invasion through facilitating the expression of its host gene creatine kinase, mitochondrial 1A (CKMT1A) by competitively binding miR-924.Citation16 lncRNA SNHG12 functioned as an oncogene to accelerate tumorigenesis and metastasis of HCC cells by sponging miR-199a/b-5p, which resulted in the high expression of MLK3 (mitogen-activated protein kinase kinase kinase 11) and activated the NF-κB pathway.Citation17 HCAL directly interacted with and functioned as a sponge for miR-15a, miR-196a, and miR-196b to modulate lysosomal protein transmembrane 4 beta (LAPTM4B) expression in HCC.Citation18 However, studies performed to investigate the ceRNA mechanisms of lncRNAs for HBV-related HCC were rare.Citation14,Citation16
The goal of this study was to identify novel lncRNA– miRNA–mRNA interaction axes for explaining the development of HBV-associated HCC by constructing a ceRNA regulatory network using sequencing data collected from a public database. Also, the prognosis performance of related lncRNAs, miRNA, and mRNAs was also validated by utilizing The Cancer Genome Atlas (TCGA) datasets. We believe that our study may provide novel prognostic biomarkers and therapeutic targets for HBV-associated HCC.
Methods
Data collection and preprocessing
Two datasets under accession numbers GSE77509Citation19 and GSE76903Citation19 were retrieved from the Gene Expression Omnibus (GEO) database (http://www.ncbi.nlm.nih.gov/geo/). These two datasets examined the RNA expression profiling and noncoding (miRNA) expression profiling in 20 primary tumors and 20 matched adjacent normal tissues from patients with HBV-induced HCC by high-throughput sequencing via HiSeq 2500 System (Illumina, San Diego, CA, USA). The samples were the same for the two datasets. The fragment per kilobase per million mapped reads (FPKM) expression data in TXT files were downloaded and preprocessed by removing low abundance genes with an FPKM of <1. The lncRNA and mRNA genes in RNA expression profiling were annotated based on the Ensembl Gene ID and HUGO Gene Nomenclature Committee (HGNC; http://www.genenames.org/).Citation20
Differentially expressed RNA analysis
The differentially expressed genes (DEGs), differentially expressed lncRNAs (DELs), and differentially expressed miRNAs (DEMs) between primary tumors and adjacent normal tissues were identified using the EdgeR package of R software (Version 3.22.3; http://www.bioconductor.org/packages/release/bioc/html/edgeR.html).Citation21 P-value was adjusted to false discovery rate (FDR) with multitest package (Version 2.36.0; http://bioconductor.org/packages/release/bioc/html/multtest.html).Citation22 The FDR of <0.05 and |logFC(fold change)| >1 were set as the statistical threshold value. Hierarchical cluster heatmap representing the expression intensity and direction of DEGs, DELs, and DEMs was generated using the pheatmap R package (Version: 1.0.8; https://cran.r-project. org/web/packages/pheatmap) based on Euclidean distance.
Protein–protein interaction (PPI) network
The Search Tool for the Retrieval of Interacting Genes/Proteins (STRING; Version 10.0; http://stringdb.org/) databaseCitation23 was used to assess the direct and indirect correlations between DEGs. The screened interaction pairs among DEGs were used to construct the PPI network with the Cytoscape software (Version 3.6.1; www.cytoscape.org/).Citation24 The topological features of the PPI network, consisting of degree (the number of edges [interactions] of a node protein]), betweenness centrality (BC; the number of shortest paths that run through a node), closeness centrality (CC; the average length of the shortest paths to access all other proteins in the network), and average path length (APL; the average of distances between all pairs of nodes), were then calculated using the CytoNCA plugin in cytoscape software (http://apps.cytoscape.org/apps/cytonca)Citation25 to determine which genes were hub nodes. Functionally related clusters with well-interconnected genes were further identified from the PPI network using the Molecular Complex Detection (MCODE; Version: 1.4.2, http://apps.cytoscape.org/apps/mcode) algorithmCitation26 with default scoring options. Modules with score >4 and node >6 were considered to be significant.
Function enrichment analysis
Gene Ontology (GO) Biological Process term and Kyoto Encyclopedia of Genes and Genomes (KEGG) pathway enrichment analyses of DEGs were conducted using the Database for Annotation, Visualization and Integrated Discovery (DAVID) online tool (Version 6.8; http://david.abcc.ncifcrf. gov)Citation27 and BinGOCitation28 plugin in Cytoscape to predict their underlying functions. Statistical significance was defined as FDR <0.05.
lncRNA–miRNA–mRNA ceRNA regulatory network construction
The miRcode database (Version 11; http://www.mircode.org/)Citation29 was used to screen the interaction relationships between DELs and DEMs, and then, the DELs–DEMs interaction network was constructed using the Cytoscape software (Version 3.6.1; www.cytoscape.org/).Citation24 The target genes of DEMs in the DELs–DEMs interaction network were predicted using the miRwalk database (Version 2.0; http://www.zmf.umm. uni-heidelberg.de/apps/zmf/mirwalk2),Citation30 which were then overlapped with the DEGs to obtain the DELs–DEMs–DEGs regulatory relationships. The negative interaction pairs between DEMs and DEGs/DELs were integrated to construct the DELs–DEMs–DEGs ceRNA network using the Cytoscape software (Version 3.6.1; www.cytoscape.org/).Citation24
Furthermore, all known HCC-related pathways were downloaded from Comparative Toxicogenomics Database (CTD; http://ctd.mdibl.org/),Citation31 which was then overlapped with the pathways enriched by the genes in the ceRNA network to obtain potentially HCC-related ceRNA network.
Prognosis values of DELs, DEMs, and DEGs in ceRNA network
The miRNAs and mRNAs expression profile data of HCC were also collected from TCGA (https://gdc-portal.nci.nih. gov/) database, with only the HBV samples having survival information, included. Univariate Cox regression analysis was performed to screen prognosis-related DELs, DEMs, and DEGs using the survival package (Version 2.40.1; https://cran.r-project. org/package=survival). The samples were then classified into a low-expression group (< median) and a high-expression group (> median) based on the expression of each prognosis-related DEL, DEM, and DEG. The Kaplan–Meier (KM) method with the log-rank test was employed to compare the overall survival (OS) and recurrence-free survival (RFS) between the high- and low-expression groups through the GraphPad Prism software (Version 5; GraphPad Software, Inc., La Jolla, CA, USA). P<0.05 was considered to be statistically significant.
Validation of expressions of crucial DELs, DEMs, and DEGs in ceRNA network
The expressions of crucial DELs, DEMs, and DEGs were also validated in TCGA dataset and other microarray datasets that detected the mRNA (GSE121248: 70 vs 37; GSE94660Citation32: 21 vs 21; GSE25599Citation33: 10 vs 21 normal), miRNA (GSE69580: 5 vs 5), and lncRNA (GSE27462Citation34: 5 vs 5) expression profile between tumor and matched adjacent tissues from HBV– HCC patients. All microarray datasets were also collected from the GEO database. The expression difference was tested by t-test. P<0.05 was set as statistical significance.
Results
Differential expression analysis
A total of 133 lncRNAs, 18,628 protein-coding mRNAs, and 2,578 miRNAs were annotated in mRNA-seq and miRNA-seq data. After removing the low abundance genes with an FPKM of <1, 80 lncRNAs, 16,169 protein-coding mRNAs, and 874 miRNAs were left for differential expression analysis. Based on the given threshold (FDR <0.05 and |logFC| >1), a total of 43 DELs (14 downregulated and 29 upregulated), 83 DEMs (10 downregulated and 73 upregulated), and 1,187 DEGs (650 downregulated and 537 upregulated) were identified between adjacent normal tissues and primary tumors (). The heat map analysis showed that the samples with similar features tended to be clustered according to the expressions of DELs (), DEMs (), and DEGs ().
Figure 1 Hierarchical clustering and heat map analysis of differentially expressed lncRNAs (A), miRNAs (B), and genes (C).
Notes: Each row represents a sample, and each column represents an lncRNA, miRNA, or gene. High- or low-relative expression is displayed as a red or blue strip, respectively. Each group contained 20 different samples.
Abbreviations: T, tumor; N, normal.
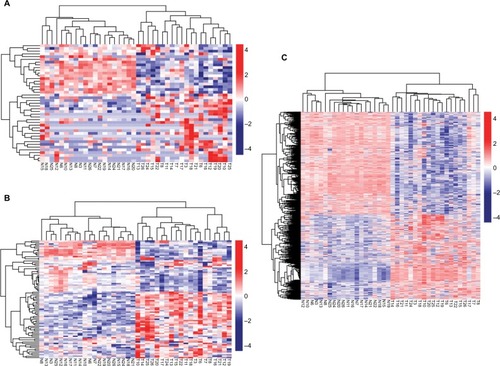
Table 1 Differentially expressed genes, miRNAs, and lncRNAs
Function enrichment for DEGs
The upregulated and downregulated DEGs were subjected to the DAVID to predict their functions. The results indicated that 16 GO biological process terms were obtained for the upregulated genes, mainly involving cell cycle (ie, E2F2, CDK1, CCNE1, BUB1, UBE2C, and CCNB1), while 27 GO biological process terms were enriched for the downregulated genes, mainly involving inflammatory response (PF4 and CXCR1) ( and ). Furthermore, the KEGG pathway enrichment analysis was performed. In line with the GO enrichment results, the cell cycle (E2F2, CDK1, CCNE1, BUB1, and CCNB1) and p53 signaling pathway (CDK1, CCNE1, and CCNB1) were also obtained for the upregulated genes, while cytokine–cytokine receptor interaction was enriched for the downregulated genes (PF4 and CXCR1) ( and ).
Figure 2 Function enrichment analyses for the differentially expressed genes.
Note: (A) GO enrichment and (B) KEGG pathways enrichment.
Abbreviations: GO, Gene Ontology; KEGG, Kyoto Encyclopedia of Genes and Genomes.
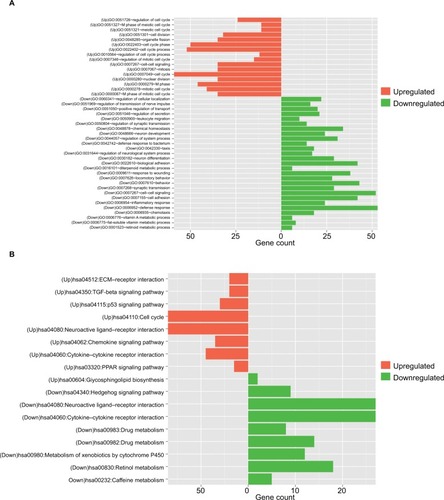
Table 2 GO enrichment for differentially expressed genes using the DAVID database
Table 3 KEGG pathway enrichment for differentially expressed genes using the DAVID database
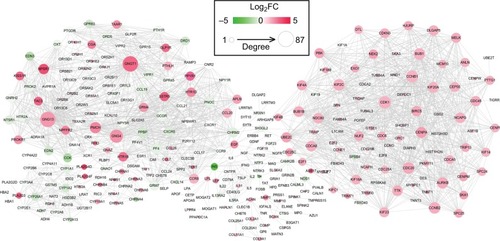
PPI network construction
Using the STRING database, 2,065 interaction relationship pairs (eg, BUB1–CDK1) were obtained between the 357 DEGs (182 downregulated and 175 upregulated), which were used for constructing a PPI network (). After calculating the topological features for each protein in PPI network, CCNB1, CDK1, G protein subunit gamma 4 (GNG4), UBE2C, G protein subunit gamma transducin 1 (GNGT1), kinesin family member 4A (KIF4A), PF4, and G protein subunit gamma 13 (GNG13) were found to be shared in four topological characteristics and ranked in the top 30, suggesting that they may be hub genes ().
Figure 3 Protein and protein interaction network for the differentially expressed genes.
Notes: Red, upregulated; green, downregulated. The larger size of node (protein) indicates the higher degree (interaction relationships) of it.
Abbreviation: FC, fold change.
Four significant functionally related modules () were subsequently screened using the MCODE, among which the module 1 was the most significant with score =14.474 and node =38, followed by module 2 with score =13.152 and node =46. Also, GO analysis of genes in modules 1 and 2 with BinGO plugin of Cytoscape indicated that they were involved in mitotic cell cycle (CCNB1, CDK1, BUB1, and UBE2C) and cell surface receptor-linked signaling pathway (PF4 and CXCR1) ().
Figure 4 Modules extracted from the protein and protein interaction network.
Notes: (A) module 1; (B) module 2; (C) module 3; and (D) module 4. Red, upregulated; green, downregulated. The larger size of node (protein) indicates the higher degree (interaction relationships) of it.
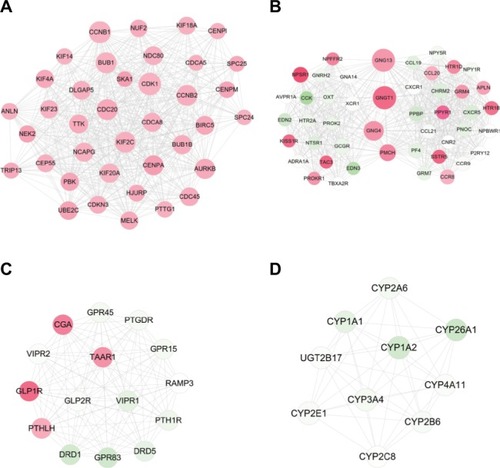
Table 4 Topological features for each protein in PPI network
Table 5 BinGO enrichment for genes in modules
CeRNA network construction
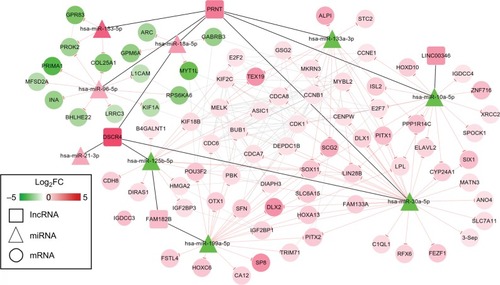
By searching the miRcode database, 14 DELs–DEMs interaction relationship pairs (including five DELs, all upregulated, and 10 DEMs, five upregulated and five down-regulated) were predicted, which were used for constructing the DELs–DEMs network. Subsequently, the target genes of these 10 DEMs were predicted with the miRwalk database. After removal of the positive–negative relationships between DEMs and DEGs, 113 DELs–DEMs interaction relationship pairs (including eight DEMs, three upregulated and five downregulated, and 82 DEGs, 67 upregulated and 15 downregulated) were left for constructing the DEMs–DEGs network. By integrating the DELs–DEMs network and DEMs–DEGs network, a DELs–DEMs–DEGs ceRNA network was established containing 95 nodes (five DELs, eight DEMs, and 82 DEGs) and 239 edges (14 DELs–DEMs, 113 DELs–DEGs, and 112 DEGs–DEGs) ().
Figure 5 ceRNAs interaction network of lncRNA–miRNA–mRNA.
Notes: Square nodes represent lncRNAs; triangle nodes represent miRNAs; circular nodes represent mRNAs. Red, upregulated; green, downregulated.
Abbreviation: FC, fold change.
Function enrichment analysis with DAVID showed the genes in the ceRNA network participated in four significant KEGG pathways, including cell cycle, p53 signaling pathway, neuroactive ligand–receptor interaction, and pathways in cancer (). By searching the CTD database with “Hepatocellular Carcinoma” as the keyword, 244 KEGG pathways were found to be associated with HCC. Among them, three were common with the enrichment results of the genes in the ceRNA network, including cell cycle (CCNE1, E2F2, and CDK1), p53 signaling pathway (CCNE1 and CDK1), and pathways in cancer (E2F2). Thus, the DELs–DEMs–DEGs interaction relationship pairs associated with these three pathways were extracted to form the HCC-related ceRNA network (), in which four DELs (DSCR4, FAM182B, PRNT, and LINC00346), five DEMs (hsa-miR-199a-5p, hsa-miR-30a-5p, hsa-miR-125b-5, hsa-miR-10a-5p, and hsa-miR-133a-3p), and seven DEGs (CDC6, CCNE1, CDK1, E2F2, BUB1, CCNB1, and SFN) were involved.
Figure 6 HCC-related ceRNAs interaction network of lncRNA–miRNA–mRNA.
Notes: Square nodes represent circRNAs, triangle nodes represent miRNAs, circular nodes represent mRNAs, and rhombus nodes represent HCC pathways. Red, upregulated; green, downregulated.
Abbreviations: FC, fold change; HCC, hepatocellular carcinoma.
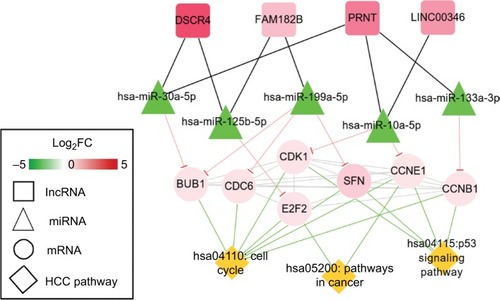
Table 6 KEGG pathways for genes in ceRNA network
Prognosis prediction for DELs, DEMs, and DEGs
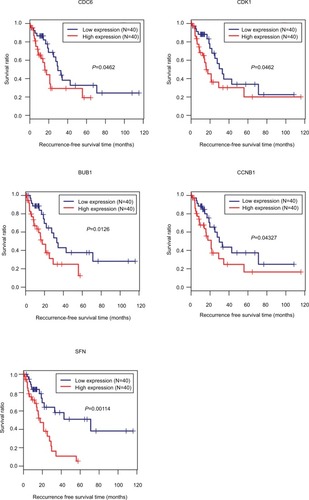
Ninety-eight HBV-related HCC samples, which have been used for mRNA and miRNA sequencing, were collected from TCGA database. Univariate Cox regression analysis was then used to screen OS- and RFS-related DELs, DEMs, and DEGs from HCC-related ceRNA network in these samples. The results showed that two DELs, four DEMs, and seven DEGs were significantly associated with OS, but only five DEGs were significantly associated with RFS (). KM curve was subsequently drawn according the expression level of each DEL, DEM, and DEG in the sequencing data. In line with the Cox regression analysis results, KM curve analysis also () showed that two DELs (FAM182B and LINC00346), four DEMs (hsa-miR-30a-5p, hsa-miR-125b-5p, hsa-miR-10a-5p, and hsa-miR-133a-3p), and seven DEGs (CDC6, CCNE1, CDK1, E2F2, BUB1, CCNB1, and SFN) were significantly associated with OS but not PRNT (expression value =0 in TCGA data), DSCR4 (P=0.493), and hsa-miR-199a-5p (P=0.101). Also, all the relationships between their expressions and the prognosis results were in line with our expectation, that is, patients with the high expression of the DELs and DEGs (all were upregulated genes in HBV-related HCC) had the poor survival, while patients with the high expression of DEMs (all were downregulated genes in HBV-related HCC) possessed excellent survival. As shown in , KM curve analysis also showed that the highly expressed five DEGs (CDC6, CDK1, BUB1, CCNB1, and SFN) were significantly associated with RFS.
Figure 7 Kaplan–Meier analysis to display the correlation of differentially expressed lncRNAs (A), miRNAs (B), and genes (C) with overall survival outcomes for patients with HBV-related HCC.
Abbreviations: HBV, hepatitis B virus; HCC, hepatocellular carcinoma.
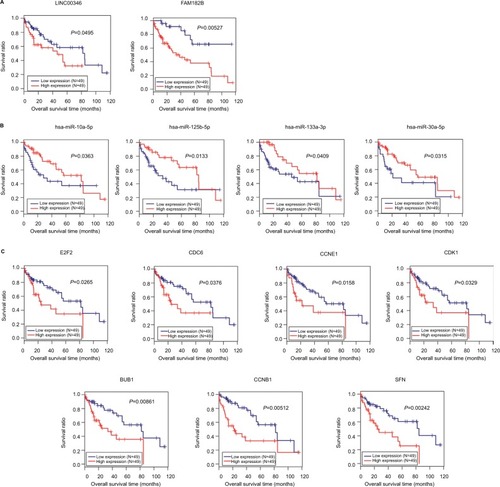
Figure 8 Kaplan–Meier analysis to display the correlation of differentially expressed genes with recurrence-free survival outcomes for patients with HBV-related HCC.
Abbreviations: HBV, hepatitis B virus; HCC, hepatocellular carcinoma.
Further combination with their interaction relationships in the ceRNA network suggested that FAM182B-miR-125b-5p-E2F2 and LINC00346-miR-10a-5p-CDK1/CCNE1 ceRNA axes were especially important for the development and prognosis of HBV-related HCC.
Table 7 Cox regression analysis to screen survival-related genes
Validation of expressions of crucial DELs, DEMs, and DEGs in ceRNA network
The upregulation of LINC00346, CDK1, and CCNE1 but the downregulation of miR-10a-5p and miR-125b-5p was also validated in other microarray datasets and TCGA data. FAM182B was not found to be differentially expressed in GSE27462 and TCGA data. E2F2 was demonstrated to be differentially expressed in GSE94660, GSE25599, and TCGA data but not in GSE121248 (). These findings indicated that LINC00346-miR-10a-5p-CDK1 ceRNA axis may be a potentially verifiable mechanism for HBV-related HCC.
Table 8 Confirmation of expressions of crucial lncRNAs, miRNAs, and mRNAs using other datasets
Discussion
In the present study, we identified FAM182B-miR-125b-5p-E2F2 and LINC00346-miR-10a-5p-CDK1/CCNE1 ceRNA axes as important mechanisms for the development of HBV-related HCC. They were involved in HBV-related HCC by influencing cell cycle. Also, the genes in these two axes were significantly associated with the OS of patients. LINC00346-miR-10a-5p-CDK1 may be especially crucial because CDK1 was considered as a hub gene in the PPI network and was also associated with RFS as well as the expressions of all of them confirmed in other datasets.
Numerous studies have shown that HBV infection of hepatocytes promotes cell cycle progression by accelerating G1/S and G2/M transition and thus increases cell proliferation ability, ultimately inducing the development of HCC.Citation35,Citation36 It is well accepted that CCNE1 is a positive regulator of G1/S phase transitionCitation37 and CCNB1 is required for G2/M transition and mitosis resumption by forming a maturation promoting factor with CKD1.Citation38 Transcriptional factor E2F2 can be activated by Cyclin-CDK enzymatic complex after phosphorylating the protein retinoblastoma (Rb), which promotes the transcription of E2F2 target genes to regulate the G1/S-phase transition.Citation39 Thus, CCNE1, CCNB1, CKD1, and E2F2 genes are suggested to be upregulated in HBV-related HCC. These hypotheses have been demonstrated by previous studies. For example, Sung et alCitation40 used the RNA sequencing (RNA-seq) and Sanger sequencing to confirm that CCNE1 gene was highly expressed in HBV integrated tumors compared with adjacent normal tissue. Chin et alCitation41 observed that delivery of a replication competent HBV genome into hepatocyte lines Huh7 and PMH induced the expression of CCNB1. Cheng et alCitation42 also used in vitro experiments to prove HBV persistently activated the CCNB1-CDK1 kinase in HCC cells. In line with these studies, our study also found CCNE1, CCNB1, and CKD1 were upregulated in tumor samples of patients with HBV-related HCC and the high expression of them predicted poor prognosis. The CKD1 may be especially important because it was associated with both OS and RFS. Although there was a study to indicate E2F2 upregulation in HCC,Citation43 its relationship with HBV has not been investigated. Our study may be the first to reveal that HBV infection may trigger E2F2 upregulation and lead to the development of HCC and poor prognosis for patients. miRNAs are the class of small RNAs (18–25 nucleotides) that downregulate target gene expressions via binding to the 3′-untranslated region (UTR). Thus, the upregulation of cell cycle-related genes may be attributed to the downregulation of miRNAs. In this study, we also investigated the DEMs between tumor and normal samples and predicted their interaction with target genes by the miRwalk database. Our results indicated that miR-10a-5p and miR-125b-5p could regulate CDK1/CCNE1 and E2F2, respectively. There have studies to explore the miRNAs to regulate these target genes in HCC, such as miR-7/497/195-CCNE1,Citation44,Citation45 miR-582-5p-CDK1,Citation46 and miR-214/490-E2F2,Citation47,Citation48 but not focused on the relationships of our prediction. However, the studies on the expressions of miR-10a-5p and miR-125b-5p in HCC may indirectly illuminate their underlying negative relations. Zhu et alCitation49 identified the DEMs in seven paired specimens of HCC using the microarray technique and found that miR-10a-5p and miR-125b-5p were significantly downregulated. Over-expression of miR-10aCitation50 and miR-125bCitation51 was reported to suppress the metastasis of HCC cells in vivo. In line with these studies, our study also showed that miR-10a-5p and miR-125b-5p were downregulated in HBV-related HCC and high expression of them predicted excellent prognosis. lncRNAs are proposed to act as a ceRNA to involve in the regulation effects of miRNAs on the expression of target genes. Thus, the upregulation of cell cycle-related genes may also be attributed to the upregulation of lncRNAs that sponged the miRNAs. In this study, we also investigated the DELs between tumor and normal samples and predicted their interaction with miRNAs by the miRcode database. Our results indicated that upregulated FAM182B and LINC00346 may regulate cell cycle-related genes by interacting with miR-125b-5p and miR-10a-5p, resulting in poor prognosis. In line with our study, there has been a study to demonstrate that LINC00346 was upregulated in bladder cancer tissues compared to normal tissues. Knockdown of LINC00346 inhibited bladder cancer cell proliferation and migration and induced cell cycle arrest and cell apoptosis.Citation52 The high expression of LINC00346 was also found to be significantly associated with poor OS in HCCCitation53 and breast cancer samples.Citation54 Nevertheless, no studies were performed to investigate the interaction of LINC00346 with miRNAs. Also, any investigation related to FAM182B has not been found until now. These implied that our identified ceRNA axes (FAM182B-miR-125b-5p-E2F2 and LINC00346-miR-10a-5p-CDK1/CCNE1) may be novel mechanisms for HBV-related HCC.
There were some limitations in this study. First, our study has preliminarily predicted that these ceRNA axes may be associated with the development of HBV-related HCC and some of them were confirmed in some other microarray datasets. Thus, further clinical, in vitro (dual luciferase reporter assay), and in vivo (loss of function) experiments are necessary to validate the expressions of controversial genes (such as FAM182B and E2F2) and regulatory relationships between DELs and DEMs as well as between DEMs and DEGs, and their roles for the proliferation, metastasis, and invasion of HBV infection hepatocytes. Second, there were no clinical data in our used datasets (GSE77509 and GSE76903) and, thus, we only preliminarily predicted the associations between prognosis (OS and RFS) and each of our identified DEL/DEM/DEG using TCGA data via univariate cox regression analysis. Whether these genes were independent biomarkers needed further clinical trials with multivariate Cox’s model that integrated all the clinical information (such as HBV DNA level, liver function parameters, pathologic stage, pathologic node, and pathologic metastasis, grade, therapeutic strategies including hepatectomy, radiofrequency ablation, and solafenib)Citation55–Citation57 and all DELs/DEMs/DEGs expression levels.
Conclusion
The present study preliminarily indicates that FAM182B and LINC00346 may be novel prognostic biomarkers and therapeutic targets for HBV-associated HCC. They function as a ceRNA to sponge miR-125b-5p and miR-10a-5p to de-repress cell cycle-related genes (E2F2, CDK1, and CCNE1) and promote the cell growth of HCC cells.
Ethics approval and informed consent
As the data used in this study were downloaded from GEO or TCGA database, and no human experiment was involved in this study, there were no ethical approval and informed consent. Thus, the principles of the Declaration of Helsinki were also not followed.
Availability of data and materials
All the microarray data were downloaded from the GEO database in NCBI (http://www.ncbi.nlm.nih.gov/geo/). The mRNA and miRNA Seq-data were obtained from TCGA (https://tcga-data.nci.nih.gov/).
Author contributions
HL and ZB participated in the conception and design of this study. HL and XZ performed the acquisition of data. CL and CS were involved in the analysis and interpretation of data. HL and CL performed the statistical and bioinformatics analyses. HL drafted the manuscript. ZB revised the manuscript for important intellectual content. All authors read and approved the final manuscript. All authors contributed toward data analysis, drafting and critically revising the paper and agree to be accountable for all aspects of the work.
Disclosure
The authors report no conflicts of interest in this work.
References
- ChenWZhengRBaadePDCancer statistics in China, 2015CA Cancer J Clin201666211513226808342
- LiJHuangLYanJQiuMYanYLiver resection for hepatocellular carcinoma: personal experiences in a series of 1330 consecutive cases in ChinaANZ J Surg20188810E713E71729363237
- LiYZhangZShiJRisk factors for naturally-occurring early-onset hepatocellular carcinoma in patients with HBV-associated liver cirrhosis in ChinaInt J Clin Exp Med2015811205121225785114
- XiangLLiuKChenYAnalysis of Risk Factors Associated with the Development of Hepatocellular Carcinoma in Chronic HBV-Infected Chinese: A Meta-AnalysisInt J Environ Res Public Health2016136604
- LinCLKaoJHRisk stratification for hepatitis B virus related hepatocellular carcinomaJ Gastroenterol Hepatol2013281101723094699
- FanHZhangQZhaoXLvPLiuMTangHTranscriptomic profiling of long non-coding RNAs in hepatitis B virus-related hepatocellular carcinomaOncotarget2017839654216543429029442
- MouYWangDXingRIdentification of long noncoding RNAs biomarkers in patients with hepatitis B virus-associated hepatocellular carcinomaCancer Biomark20182319510629991128
- ZuoKKongLXueDYangYXieLThe expression and role of lncRNA AX800134 in hepatitis B virus-related hepatocellular carcinomaVirus Genes201854447548329789998
- LvDWangYZhangYCuiPXuYDownregulated long non-coding RNA DREH promotes cell proliferation in hepatitis B virus-associated hepatocellular carcinomaOncol Lett20171422025203228789433
- YangFZhangLHuoX-SongLong noncoding RNA high expression in hepatocellular carcinoma facilitates tumor growth through enhancer of zeste homolog 2 in humansHepatology20115451679168921769904
- SalmenaLPolisenoLTayYKatsLPandolfiPPA ceRNA hypothesis: the Rosetta Stone of a hidden RNA language?Cell2011146335335821802130
- LiYLiuGLiXDongHXiaoWLuSLong non-coding RNA SBF2-AS1 promotes hepatocellular carcinoma progression through regulation of miR-140-5p-TGFBR1 pathwayBiochem Biophys Res Commun201850342826283230115383
- SuiJYangXQiWLong Non-Coding RNA Linc-USP16 Functions As a Tumour Suppressor in Hepatocellular Carcinoma by Regulating PTEN ExpressionCell Physiol Biochem20174431188119829179215
- LvJFanHXZhaoXPLong non-coding RNA Unigene56159 promotes epithelial-mesenchymal transition by acting as a ceRNA of miR-140-5p in hepatocellular carcinoma cellsCancer Lett2016382216617527597739
- MoYHeLLaiZLINC01287/miR-298/STAT3 feedback loop regulates growth and the epithelial-to-mesenchymal transition phenotype in hepatocellular carcinoma cellsJ Exp Clin Cancer Res20183711493001751
- FanHLvPMuTLncRNA n335586/miR-924/CKMT1A axis contributes to cell migration and invasion in hepatocellular carcinoma cellsCancer Lett2018429899929753758
- LanTMaWHongZWuLChenXYuanYLong non-coding RNA small nucleolar RNA host gene 12 (SNHG12) promotes tumorigenesis and metastasis by targeting miR-199a/b-5p in hepatocellular carcinomaJ Exp Clin Cancer Res20173611128073380
- XieCRWangFZhangSLong Noncoding RNA HCAL Facilitates the Growth and Metastasis of Hepatocellular Carcinoma by Acting as a ceRNA of LAPTM4BMol Ther Nucleic Acids2017944045129246322
- YangYChenLGuJRecurrently deregulated lncRNAs in hepatocellular carcinomaNat Commun201781442128194035
- PoveySLoveringRBrufordEWrightMLushMWainHThe HUGO Gene Nomenclature Committee (HGNC)Human Genetics2001109667868011810281
- NikolayevaORobinsonMDedgeR for differential RNA-seq and ChIP-seq analysis: an application to stem cell biologyMethods Mol Biol20141150457924743990
- PollardKSDudoitSLaanMJMultiple testing procedures: the mult-test package and applications to genomicsGentlemanRCareyVJHuberWIrizarryRADudoitSBioinformatics and Computational Biology Solutions Using R and BioconductorNew YorkSpringer2005249271
- SzklarczykDFranceschiniAWyderSSTRING v10: protein-protein interaction networks, integrated over the tree of lifeNucleic Acids Res201543D1D447D45225352553
- KohlMWieseSWarscheidBCytoscape: software for visualization and analysis of biological networksMethods Mol Biol201169629130321063955
- TangYLiMWangJPanYWuFXCytoNCA: a cytoscape plugin for centrality analysis and evaluation of protein interaction networksBiosystems2015127677225451770
- BaderGDHogueCWAn automated method for finding molecular complexes in large protein interaction networksBMC Bioinformatics200341212525261
- HuangDWShermanBTLempickiRASystematic and integrative analysis of large gene lists using DAVID bioinformatics resourcesNat Protoc200941445719131956
- MaereSHeymansKKuiperMBiNGO: a Cytoscape plugin to assess overrepresentation of gene ontology categories in biological networksBioinformatics200521163448344915972284
- JeggariAMarksDSLarssonEmiRcode: a map of putative microRNA target sites in the long non-coding transcriptomeBioinformatics201228152062206322718787
- DweepHGretzNmiRWalk2.0: a comprehensive atlas of microRNA-target interactionsNat Methods201512869726226356
- DavisAPGrondinCJJohnsonRJSciakyDThe Comparative Toxicogenomics Database: update 2017Nucleic Acids Res201745D1D972D97827651457
- YooSWangWWangQA pilot systematic genomic comparison of recurrence risks of hepatitis B virus-associated hepatocellular carcinoma with low- and high-degree liver fibrosisBMC Med201715121429212479
- HuangQLinBLiuHRNA-Seq analyses generate comprehensive transcriptomic landscape and reveal complex transcript patterns in hepatocellular carcinomaPLoS One2011610e2616822043308
- YangFZhangLHuoXSLong noncoding RNA high expression in hepatocellular carcinoma facilitates tumor growth through enhancer of zeste homolog 2 in humansHepatology20115451679168921769904
- ZhengBYGaoWYHuangXYHBx promotes the proliferative ability of HL-7702 cells via the COX-2/Wnt/β-catenin pathwayMol Med Rep20181768432843829693167
- XiaYChengXLiYValdezKChenWLiangTJHepatitis B virus deregulates cell cycle to promote viral replication and a premalignant phenotypeJ Virol20189219 e00722–18pii
- LuoQLiXLiJMiR-15a is underexpressed and inhibits the cell cycle by targeting CCNE1 in breast cancerInt J Oncol20134341212121823900351
- FangYYuHLiangXXuJCaiXChk1-induced CCNB1 overexpression promotes cell proliferation and tumor growth in human colorectal cancerCancer Biol Ther20141591268127924971465
- DimovaDKDysonNJThe E2F transcriptional network: old acquaintances with new facesOncogene200524172810282615838517
- SungWKZhengHLiSGenome-wide survey of recurrent HBV integration in hepatocellular carcinomaNat Genet201244776576922634754
- ChinREarnest-SilveiraLKoeberleinBModulation of MAPK pathways and cell cycle by replicating hepatitis B virus: Factors contributing to hepatocarcinogenesisJ Hepatol200747332533717512084
- ChengPLiYYangLHepatitis B virus X protein (HBx) induces G2/M arrest and apoptosis through sustained activation of cyclin B1-CDK1 kinaseOncol Rep20092251101110719787227
- GnaniDRomitoIArtusoSFocal adhesion kinase depletion reduces human hepatocellular carcinoma growth by repressing enhancer of zeste homolog 2Cell Death Differ201724588990228338656
- FurutaMKozakiKTanimotoKThe tumor-suppressive miR-497-195 cluster targets multiple cell-cycle regulators in hepatocellular carcinomaPLoS One201383e6015523544130
- ZhangXHuSZhangXMicroRNA-7 arrests cell cycle in G1 phase by directly targeting CCNE1 in human hepatocellular carcinoma cellsBiochem Biophys Res Commun201444331078108424370822
- ZhangYHuangWRanYmiR-582-5p inhibits proliferation of hepatocellular carcinoma by targeting CDK1 and AKT3Tumour Biol201536118309831626002580
- WangPChenSFangHmiR-214/199a/199a* cluster levels predict poor survival in hepatocellular carcinoma through interference with cell-cycle regulatorsOncotarget20167192994526498144
- FangZQLiMCZhangYQLiuXGMiR-490-5p inhibits the metastasis of hepatocellular carcinoma by down-regulating E2F2 and ECT2J Cell Biochem2018119108317832429932246
- ZhuHRHuangRZYuXNMicroarray expression profiling of microRNAs reveals potential biomarkers for hepatocellular carcinomaTohoku J Exp Med20182452899829899182
- YanYLuoYCWanHYMicroRNA-10a is involved in the metastatic process by regulating Eph tyrosine kinase receptor A4-mediated epithelial-mesenchymal transition and adhesion in hepatoma cellsHepatology201357266767722996586
- ZhouHCFangJHShangLRMicroRNAs miR-125b and miR-100 suppress metastasis of hepatocellular carcinoma by disrupting the formation of vessels that encapsulate tumour clustersJ Pathol2016240445046027577856
- YeTDingWWangNHuangHPanYWeiALong noncoding RNA linc00346 promotes the malignant phenotypes of bladder cancerBiochem Biophys Res Commun20174911798428705739
- ZhangJFanDJianZChenGGLaiPBCancer specific long non-coding RNAs show differential expression patterns and competing endogenous RNA potential in hepatocellular carcinomaPLoS One20151010e014104226492393
- LiuHLiJKoiralaPLong non-coding RNAs as prognostic markers in human breast cancerOncotarget2016715205842059626942882
- AkutaNSuzukiFKobayashiMCirculating microRNA-122 levels are important predictor of hepatitis B virus surface antigen seroclearanceJ Med Virol201890101586159229896794
- NieQHGaoLHChengYQHepatitis C virus infection of human cytotrophoblasts cultured in vitroJ Med Virol201284101586159222930506
- ZhangMHNiuHLiZHuoRTWangJMLiuJActivation of PI3K/AKT is involved in TINAG-mediated promotion of proliferation, invasion and migration of hepatocellular carcinomaCancer Biomark2018231334329991125