
Abstract
Background
In a previous study, we demonstrated that asthma patients with signs of emphysema on quantitative computed tomography (CT) fulfill the diagnosis of asthma-COPD overlap syndrome (ACOS). However, quantitative CT measurements of emphysema are not routinely available for patients with chronic airway disease, which limits their application. Spirometry was a widely used examination tool in clinical settings and shows emphysema as a sharp angle in the maximum expiratory flow volume (MEFV) curve, called the “angle of collapse (AC)”. The aim of this study was to investigate the value of the AC in the diagnosis of emphysema and ACOS.
Methods
This study included 716 participants: 151 asthma patients, 173 COPD patients, and 392 normal control subjects. All the participants underwent pulmonary function tests. COPD and asthma patients also underwent quantitative CT measurements of emphysema. The AC was measured using computer models based on Matlab software. The value of the AC in the diagnosis of emphysema and ACOS was evaluated using receiver-operating characteristic (ROC) curve analysis.
Results
The AC of COPD patients was significantly lower than that of asthma patients and control subjects. The AC was significantly negatively correlated with emphysema index (EI; r=−0.666, P<0.001), and patients with high EI had a lower AC than those with low EI. The ROC curve analysis showed that the AC had higher diagnostic efficiency for high EI (area under the curve =0.876) than did other spirometry parameters. In asthma patients, using the AC ≤137° as a surrogate criterion for the diagnosis of ACOS, the sensitivity and specificity were 62.5% and 89.1%, respectively.
Conclusion
The AC on the MEFV curve quantified by computer models correlates with the extent of emphysema. The AC may become a surrogate marker for the diagnosis of emphysema and help to diagnose ACOS.
Introduction
Asthma and COPD are major public health issues, due to their elevated prevalence and high cost to society.Citation1,Citation2 Although asthma and COPD are both chronic inflammatory diseases affecting the airway and characterized by the presence of airflow limitation, their etiopathogenesis, diagnostics, and therapeutic and prognostic characteristics differ.Citation3,Citation4
In clinical practice, a large proportion of subjects have features of both asthma and COPD, which is called the asthma-COPD overlap syndrome (ACOS).Citation5 The concept of ACOS was formally proposed by international guidelines in 2014 when the Global Initiative for Asthma (GINA) and Global Initiative for Chronic Obstructive Lung Disease (GOLD) jointly published the chapter “Diagnosis of diseases of chronic airflow limitation: asthma, COPD, and ACOS.”Citation6
Although the concept of ACOS has been widely accepted, the diagnostic criteria of ACOS have not been fully established. If an objective indicator could contribute to the differential diagnosis of asthma and COPD, it would help in the diagnosis of ACOS. Asthma and COPD patients have different pathological features. Emphysema is an important pathological feature of COPD, but usually it does not exist in typical asthma patients. For those who have been definitively diagnosed with asthma, the diagnosis of ACOS might be established if there is also objective evidence of the presence of emphysema.
Quantitative computed tomography (CT) has been regarded as a useful method for evaluating and diagnosing emphysema. In our previous study, we attempted to demonstrate that asthma patients with a high emphysema index (EI) as measured by quantitative CT fulfill the characteristics of ACOS, and that quantitative CT measurements of emphysema may help in the diagnosis of ACOS.Citation7 However, CT is not routinely available for patients with chronic airway disease, and the radiation exposure of CT restricts widespread applications. In addition, the high-cost and complicated nature of the procedure limit the usage of quantitative CT in clinical practice.Citation8
Pulmonary function tests (PFTs) are still the most commonly used assistant examination in the diagnosis and evaluation of chronic airway disease. Among the items of PFTs, a decreased diffusing capacity and an increase in the ratio of residual volume to total lung capacity are considered to be the surrogate markers of emphysema.Citation9,Citation10 However, these measures also need advanced equipment and/or special gas, which lead to a high cost and limited usage.
The maximum expiratory flow volume (MEFV) curve is a simple and widely used pulmonary function measurement in clinical practice. The shape of the MEFV curve may reflect the underlying pathological characteristics. Both the airway obstruction and emphysema could lead to airflow limitations, but they have different features in the shape of the MEFV curve. Airway obstruction is usually featured by a gradual curvilinear decrease in flow following peak expiratory flow (PEF). However, due to the loss of supporting structure and airway collapse during forced expiration, emphysema is featured by an abrupt decrease in flow following PEF and, thereafter, a more gradual decrease in flow, which results in a sharp angle in the MEFV curve.Citation11–Citation14 This angle in the MEFV curve was called the “angle of collapse (AC)”.Citation12,Citation14
Previous studies have demonstrated that a sharp AC in the MEFV curve was an indicator of emphysema.Citation12–Citation14 In clinical practice, the shape of the MEFV curve is usually evaluated by visual assessment, as only a few studies have used computer quantification methods to evaluate the shape of this curve.Citation12,Citation14 In this study, we try to investigate the relationship between computer quantification of the AC and emphysema and investigate the value of the AC in the diagnosis of ACOS.
Methods
Subjects
This study is a cross-sectional study performed at Qilu Hospital, Shandong University, Jinan, People’s Republic of China. We recruited 716 participants: 151 with asthma, 173 with COPD, and 392 normal control participants. All participants were mainland Chinese who presented to the Qilu Hospital between July 2013 and July 2016.
Asthma and COPD were diagnosed based on the GINA and GOLD guidelines, respectively. The inclusion criteria of asthma patients were 1) respiratory symptoms such as wheezing and shortness of breath varying over time and in intensity; 2) variable expiratory airflow limitation (post-BD improvement in forced expiratory volume in 1 second [FEV1] >12% and >200 mL or average daily diurnal PEF variability >10% over 2 weeks); and 3) asthma patients with chronic airflow limitation were also enrolled in the asthma group. The COPD patients were diagnosed based on 1) >10 pack-years smoking history or confirmed noxious gas or particle exposure; 2) post-bronchodilator FEV1/forced vital capacity (FVC) <0.70; and 3) chronic respiratory symptoms including dyspnea, chronic cough, or chronic sputum production. Patients with asthmatic symptoms or a history of asthma were excluded from the COPD group. On the basis of the results of our previous study, asthma patients with high EI were defined as ACOS patients.Citation7 The asthma and COPD patients were treated in accordance with GINA and GOLD guidelines. Controls were recruited from healthy nonsmokers with normal spirometry (FEV1 ≥80% predicted and FEV1/FVC ≥0.7) who underwent a health examination in Qilu Hospital.
The exclusion criteria included: 1) acute exacerbation within the past 6 weeks; 2) other respiratory diseases, including pneumothorax, lung cancer, extensive bronchiectasis, cystic fibrosis, interstitial lung disease, or infectious lung disease; 3) pulmonary masses >3 cm on chest CT; 4) severe comorbidity, such as congestive heart failure, severe hepatic and renal dysfunction, cancer, malnutrition, or severe anemia; or 5) mental illness.Citation7
All participants underwent PFTs and computer quantification of the AC. Asthma and COPD patients underwent high-resolution CT (HRCT) and quantitative CT measurements of emphysema.
This study was approved by the Ethics Committee of Qilu Hospital of Shandong University (No 2015091). All participants in the study provided informed consent.
Pulmonary function tests
All PFTs were performed on a computerized spirometer (Masterscreen, Jaeger, Hoechberg, Germany) according to the ATS/ERS recommendations.Citation15 For patients with asthma or COPD, PFTs were performed after the inhalation of salbutamol 400 μg (GlaxoSmithKline, Middlesex, UK) for 15 minutes. For normal control subjects, PFTs were performed without the inhalation of SABA or SAMA. Basic information involving age, height, weight, body mass index (BMI), and spirometry data (FEV1.0, FVC, FEV1.0/FVC, and vital capacity [VC]) were collected. A post-bronchodilator value of FEV1/FVC <0.70 was termed as airflow limitation.
Quantitative CT measurements of emphysema
Asthma and COPD patients underwent HRCT scanning at maximal inspiration using a 64-slice spiral CT scanner (SOMATOM Definition AS, Siemens Healthcare, Forchheim, Germany). No contrast medium was used. Tube voltage was 120 kV, and tube current varied by automatic regulation, with an exposure time of 0.5 seconds and a matrix size of 512×512 pixels. Images were contiguously reconstructed with a 1-mm slice thickness using a standard algorithm.
Previous studies have shown that %LAA-950, called the “emphysema index”, had the strongest correlation with emphysema at a macroscopic and a microscopic level.Citation16,Citation17 In this study, the EI was calculated by Airway Inspector software (Surgical Planning Laboratory at Brigham and Women’s Hospital, Boston, MA, USA) using the density mask method.Citation18 Our team’s previous study showed that the normal range of EI in Chinese people aged over 40 years was 2.79%±2.37%.Citation7 Three standard deviations (SDs) above the mean of EI (9.9%) was set as the cut-off point of a high EI.Citation7
Computer quantification of AC
We refer to the Topalovic’s method to make a quantitative measurement of the AC. The measurements of AC were conducted under standard procedures using a computer model based on Matlab software 8.5 (The MathWorks, Natick, MA, USA). The measurement procedure is as follows.
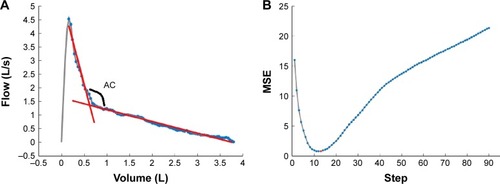
For each participant, the data points (sampling every 40 mL of volume) of the MEFV curve were exported from the Masterlab system (Jaeger, Hoechberg, Germany) and analyzed by the computer model. The AC was defined as the upper right angle of the optimal couple of regression lines of the descending branch of the MEFV curve (). To establish the best-fitting couple of regression lines, couples of regression lines were established using the abscissa of each data point as the abscissa of an intersection point. In each couple, the first regression line represents the best fit of all data points from PEF to the intersection point, and the second line represents the best fit from the intersection point to the end of the FVC. For each couple of regression lines, the mean square error (MSE) between the original data and the fitted lines is calculated. The couple with the lowest MSE was determined to be the best-fitting couple of regression lines ().
Figure 1 Example of the measurement of AC.
Abbreviations: AC, angle of collapse; MSE, mean square error.
Statistical analyses
Statistical analyses were performed using SPSS version 19.0 (IBM Corporation, Armonk, NY, USA) and MedCalc version 12.7 (MedCalc Software bvba, Ostend, Belgium). A P-value <0.05 was deemed statistically significant. Quantitative data were expressed as mean ± SD. Quantitative data of asthma, COPD, and control participants were compared using a Kruskal–Wallis test followed by pairwise multiple comparisons with Bonferroni correction. The gender ratio was compared using a chi-square test. The Mann–Whitney U test and independent-samples Student’s t-test were used to assess the differences between quantitative variables. Pearson’s r coefficient was used to measure the linear correlation between the AC and other spirometry parameters with EI. A multivariate linear regression model was established to evaluate the relation between different variables and the EI using a stepwise selection method. The diagnostic value of the AC and other spirometry parameters for high EI was evaluated by a receiver-operating characteristic (ROC) curve. The area under the curve (AUC) of the ROC was compared by DeLong’s method.Citation19 The optimal cut-off on the ROC curve was estimated using the Youden index (sensitivity + specificity − 1).
Results
Participants’ characteristics
We included 716 participants including 151 asthma patients, 173 COPD patients, and 392 control participants. The participants’ characteristics are shown in .
Table 1 Participants’ characteristics
Compared with asthma patients and controls, COPD patients were older (P<0.01), had greater pack-years of smoking (P<0.01), and had a lower BMI (P<0.01). The FEV1.0%, FVC%, VC%, and FEV1.0/FVC were significantly lower in the COPD and asthma group compared with normal controls (P<0.01). The AC of COPD patients was 135.1°±14.2°, which was significantly lower than that of asthma patients (147.6±12.9, P<0.01) and controls (165.5±9.0, P<0.01). The AC of asthma patients was also significantly lower than the controls. These results reflect that the AC may help determine a differential diagnosis between asthma and COPD.
The characteristic of AC in normal controls
A total of 392 normal controls were enrolled in this study, including 189 females and 203 males. The AC of normal controls was 165.5°±9.0°. Those controls >60 years (n=201) had a significantly lower AC than those <60 years (n=191; 162.5±8.4 vs 168.3±8.7, P<0.001). The AC was significantly negatively correlated with age (r=−0.372, P<0.001), which was similar to FEV1.0/FVC (r=−0.352, P<0.001). The AC of male controls was lower than that of the female controls, but the difference was small (164.6±8.2 vs 166.4±9.7, P=0.047).
Comparison of AC between patients with high and low EI
We divided patients with airflow limitations into two groups: a high EI group (EI ≥9.9%) and a low EI group (EI <9.9%). The AC was compared in patients with a different degree of airflow limitation (GOLD I–II, III–IV). As shown in , patients with a high EI had a significantly lower AC than those with a low EI in various degree of airflow limitation.
Table 2 AC of patients with different degree of airflow limitation and EI
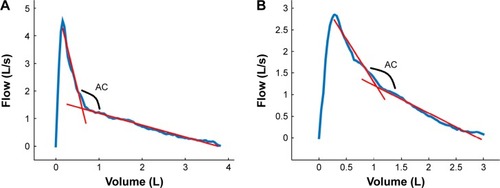
To avoid the bias caused by extent of airflow limitation, we selected 50 patients with high or low EI using a stratified random sampling method based on FEV1.0 decrease. There was no significant difference in FEV1.0% between patients with low and high EI. In comparison to low EI patients with airflow limitation (), high EI patients had a significantly lower AC (129.8±13.3 vs 141.4±9.5, P<0.001). shows examples of patients with high and low EI. These two patients had a similar extent of airflow limitation, but the AC of the patient with a high EI was lower than the patient with a low EI.
Table 3 The comparison between high and low EI patients with airflow limitation
Figure 2 AC of patients with high and low EI.
Abbreviations: AC, angle of collapse; EI, emphysema index; FEV1, forced expiratory volume in 1 second.
The relationship between AC and EI
Using univariate correlation analysis, the AC was significantly correlated with EI in patients with chronic airway disease (r=−0.666, P<0.001). The correlation was weaker in other pulmonary function parameters. For example, FEV1.0/FVC, FEV1.0%, FVC%, and VC% also demonstrated a lower correlation to EI (). In multiple regression analysis including AC, FEV1.0, and FEV1.0%, AC had a stronger correlation with EI than FEV1.0/FVC and FEV1.0% ().
Table 4 Relationship between pulmonary function parameters and emphysema index in univariate correlation analysis
Table 5 Relationship between pulmonary function parameters and emphysema index in multiple regression analysis
The diagnostic value of AC for high EI
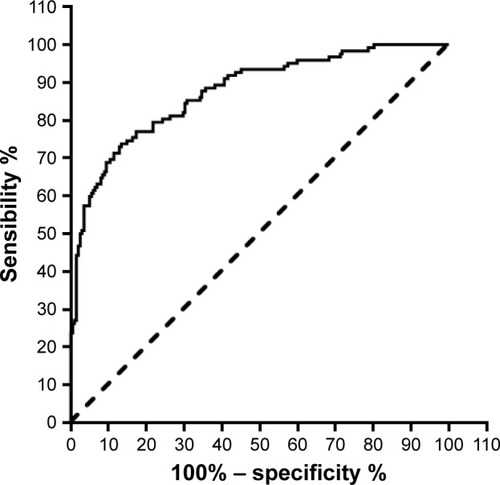
The ROC curves were used to analyze the diagnostic value of the AC and other pulmonary function parameters for high EI among patients with asthma or COPD. The AUC statistic shows that both the AC and other parameters may help to differentiate between patients with high EI and those with low EI (ROC AUC >0.5). As shown in , the AUC of ROC curve of the AC was 0.876, which was significantly higher than other parameters (P<0.01). The optimal cut-off point of the AC was ≤136.78° (), which had the highest Youden index (sensitivity + specificity − 1). To facilitate the application of the AC, AC ≤137° was chosen as the optimal cut-off point for diagnosing high EI, and the corresponding sensitivity and specificity were 74.6% (95% confidence interval [CI], 65.9%–82.0%) and 85.2% (95% CI, 79.5%–89.8%), respectively.
Table 6 The AUC of ROC curve of AC and other pulmonary function parameters
Figure 3 The receiver-operating characteristic curve of angle of collapse for diagnosing high emphysema index.
The value of AC for diagnosing ACOS
In a previous study, we demonstrated that asthma patients with a high EI fulfill the features of ACOS and should be diagnosed with ACOS. Our findings showed that among the 151 asthma patients, 21.2% (31/151) of them had high EI and fulfilled the diagnosis of ACOS.Citation7 In this study, we used the data of the previous cohort to validate the value of the AC for diagnosing ACOS. The ACOS patients’ characteristics were shown in a previous paper.Citation7 The AC of asthma patients with high EI (ACOS patients) was significantly lower than that of asthma patients with low EI (135.4±11.1 vs 150.9±11.3, P<0.001). The sensitivity and specificity of AC ≤137° for diagnosing ACOS among asthma patients were 62.5% and 89.1%, respectively. The positive predictive value was 60.6%, and the negative predictive value was 94.9%. These results show that the AC may be a useful surrogate marker for diagnosing ACOS.
Discussion
In a previous study, we demonstrated that asthma patients with high EI fulfill the diagnosis of ACOS. In this study, we investigated the value of the AC on the MEFV curve for diagnosing emphysema and ACOS. In normal subjects, the AC decreases as age increases. The AC quantified by the computer correlates well with the extent of emphysema in patients with chronic airway disease. The ROC curve analysis showed that AC has higher diagnostic efficiency for high EI than other spirometry parameters. In asthma patients, using AC ≤137° as a surrogate criterion for the diagnosis of ACOS, the sensitivity and specificity were 62.5% and 89.1%, respectively.
Emphysema is defined as “abnormal permanent enlargement of air spaces distal to terminal bronchioles, accompanied by destruction of their walls without obvious fibrosis”.Citation20 The evaluation of emphysema plays an important role in the diagnosis and evaluation of chronic airway disease.Citation21–Citation23 Traditional methods for the measurement of emphysema include histopathology, chest CT, and pulmonary diffusion function. These methods, however, are either invasive or require special equipment, which limits their applications, especially in primary medical institutions.
Spirometry is a simple and widely applicable clinical examination tool in medical institutions at all levels. The shape of the flow–volume curve may reflect the underlying pathology changes, which plays an important role in the interpretation of spirometry results. In patients with emphysema, the intrathoracic pressure becomes highly positive during forced expiration, along with the loss of lung structure support, leading to airway collapse in the early part of the expiration process.Citation14 These changes lead to a sudden decrease in flow during expiration and result in a sharp angle or “kink” on the MEFV curve. In 1976, Saltzman et al mentioned that the “kink” on the MEFV curve was an indicator of emphysema.Citation13 In 2013, Topalovic called this angle AC and proved that the AC quantified by computer models correlates with the presence of emphysema.Citation12
There are few studies focusing on the relationship between the AC and emphysema.Citation12–Citation14 In clinical practice, the evaluation of the shape of the MEFV curve is usually dependent on visual assessment, which may be affected by subjective factors. In this study, we used a computer model to quantify the AC automatically, which is more precise and objective. Besides the AC, other parameters describing the shape of the MEFV curve were also analyzed by researchers, such as the β angle and slope ratio.Citation24,Citation25 However, these parameters were calculated from the coordinates of the fixed points on the MEFV curve, which could not accurately reflect the shape of the entire curve, and so were excluded from this study.
Until now, there has been no study investigating the AC of healthy Chinese adults. The result of this study shows that the mean AC value of healthy adults is 161.6°±9.2° and that the AC was significantly negatively correlated with age. These differences may be due to the decrease in lung elastic recoil force with age. In older people, the reduced driving force leads to the decrease in expiratory airflow, which is more remarkable in the latter part of the expiratory process (non-effort-dependent area) and leads to a decreased AC. Similar to the AC, the FEV1.0/FVC of healthy adults decreases as age increases. Thus, the interpretative strategies for lung function tests of ATS/ERS recommend using the lower limit of normal (LLN), but not the fixed value (FEV1.0/FVC <0.7), as the criteria of airflow limitation.Citation15 In the future, large sample studies may be conducted to establish prediction equations for the normal range and LLN of the AC, and these studies can then provide reference for clinicians in precisely interpreting lung function reports.
The relationship between the AC and emphysema was investigated using quantitative CT scans. Previous studies demonstrated that the EI measured by quantitative CT correlates well with histology measurements and visual evaluation.Citation16,Citation20,Citation26 An EI ≥9.9%, which corresponds to the mean value plus 3 SDs of healthy adults in our previous study, was defined as the criteria of high EI.Citation7 In this study, patients with a high EI had a significantly lower AC than those with a low EI, even though those two groups had a similar degree of airflow limitation. This result shows that the AC may contribute to the differentiation between patients with high and low EI. In patients with chronic airway diseases, the AC has a stronger correlation with EI than other lung function parameters. This was similar to the results of Topalovic’s study.Citation12 COPD patients had a lower AC than asthma patients, which concurs with the existence of emphysematous destruction in COPD.
The result of ROC curve analysis shows that the AC had higher diagnostic efficiency for high EI than other spirometry parameters. In particular, the AC had high specificity for diagnosing a high EI, which fulfill the requirements of clinical work. However, the mean AC of patients with a GOLD I and II degree of airflow limitation with a high EI was 140.2°, indicating that AC is less sensitive at detecting emphysema in patients with a mild airflow limitation. In the previous study, we demonstrated that asthma patients with a high EI fulfill the diagnosis of ACOS. In this study, a sensitivity of 62.5% and a specificity of 89.1% were found when using AC ≤137° as the criteria for diagnosing ACOS among asthma patients. Compared with quantitative CT, the measurements of the AC only require a spirometry test, which is cheap and easily available, especially in primary medical institutions. For this reason, the AC may become a surrogate marker for the screening of emphysema or ACOS.
Our study had several limitations. First, we did not enroll other parameters which could reflect the extent of emphysema, including DLCO. Thus, the diagnostic value of the AC and other parameters has not been compared. In addition, the value of the AC for diagnosing emphysema has not been validated in another independent cohort. In the future, we will include more parameters and validate the value of the AC for diagnosing emphysema and ACOS in another cohort.
In conclusion, we have demonstrated that the AC quantified by computer models correlates well with the extent of emphysema in patients. The AC was superior to other spirometer parameters for diagnosing patients with a high EI and had a high specificity. With these results, we believe that the AC could become a surrogate marker for diagnosing emphysema, which may help in the diagnosis of ACOS.
Acknowledgments
This work was supported by the National Natural Science Foundation of PR China (No 81370148).
Disclosure
The authors report no conflicts of interest in this work.
References
- AdeloyeDChuaSLeeCGlobal and regional estimates of COPD prevalence: systematic review and meta-analysisJ Glob Health20155220415
- MasoliMFabianDHoltSBeasleyRThe global burden of asthma: executive summary of the GINA Dissemination Committee reportAllergy200459546947815080825
- AbramsonMPerretJDharmageSMcDonaldVMcDonaldCDistinguishing adult-onset asthma from COPD: a review and a new approachInt J Chron Obstr Pulmon Dis20149945962
- PostmaDSReddelHKTenHNvan den BergeMAsthma and chronic obstructive pulmonary disease: similarities and differencesClin Chest Med201435114315624507842
- PostmaDSRabeKFThe asthma-COPD overlap syndromeN Engl J Med2015373131241124926398072
- Global initiative for asthma and global initiative for chronic obstructive lung disease. asthma COPD and asthma–COPD overlap syndrome (ACOS)2015 Available from: http://www.ginasthma.org/local/uploads/files/AsthmaCOPDOverlap.pdfAccessed March 10, 2015
- XieMWangWDouSCuiLXiaoWQuantitative computed tomography measurements of emphysema for diagnosing asthma-chronic obstructive pulmonary disease overlap syndromeInt J Chron Obstruct Pulmon Dis20161195396127226711
- MetsOMde JongPAvan GinnekenBGietemaHALammersJWJQuantitative computed tomography in COPD: possibilities and limitationsLung2012190213314522179694
- CerveriIDoreRCorsicoAAssessment of emphysema in COPD: a functional and radiologic studyChest200412551714171815136381
- D’AnnaSEAsnaghiRCaramoriGHigh-resolution computed tomography quantitation of emphysema is correlated with selected lung function values in stable COPDRespiration201283538339021832824
- HuppmannMSchenkEKummerFSignificance of expiratory bronchiolar collapse symptoms in the diagnosis of emphysemaPneumologie1990445771776 German2359746
- TopalovicMExadaktylosVPeetersAComputer quantification of airway collapse on forced expiration to predict the presence of emphysemaRespir Res20131413124251975
- SaltzmanHPCiullaEMKupermanASThe spirographic “kink”. A sign of emphysemaChest197669151551244288
- HealyFWilsonAFFairshterRDPhysiologic correlates of airway collapse in chronic airflow obstructionChest19848544764816705575
- PellegrinoRInterpretative strategies for lung function testsEur Respir J200526594896816264058
- GevenoisPAde MaertelaerVDe VuystPZanenJYernaultJCComparison of computed density and macroscopic morphometry in pulmonary emphysemaAm J Respir Crit Care Med199515226536577633722
- GevenoisPADe VuystPde MaertelaerVComparison of computed density and microscopic morphometry in pulmonary emphysemaAm J Respir Crit Care Med199615411871928680679
- WashkoGRHunninghakeGMFernandezIELung volumes and emphysema in smokers with interstitial lung abnormalitiesNew Engl J Med20113641089790621388308
- DeLongERDeLongDMClarke-PearsonDLComparing the areas under two or more correlated receiver operating characteristic curves: a nonparametric approachBiometrics19884438378453203132
- HoggJCTimensWThe pathology of chronic obstructive pulmonary diseaseAnnu Rev Pathol2009443545918954287
- MohamedHFde HoopBZanenPCT-quantified emphysema in male heavy smokers: association with lung function declineThorax201166978278721474499
- HarunaAMuroSNakanoYCT scan findings of emphysema predict mortality in COPDChest2010138363564020382712
- GalbánCJHanMKBoesJLComputed tomography–based biomarker provides unique signature for diagnosis of COPD phenotypes and disease progressionNat Med201218111711171523042237
- SchachterENKappMCMaunderLRBeckGWitekTJSmoking and cotton dust effects in cotton textile workers: an analysis of the shape of the maximum expiratory flow volume curveEnviron Health Perspect1986661451483709477
- DominelliPBFosterGEGuenetteJAQuantifying the shape of the maximal expiratory flow–volume curve in mild COPDResp Physiol Neurobiol20152193035
- LynchDAAl-QaisiMAQuantitative computed tomography in chronic obstructive pulmonary diseaseJ Thorac Imag2013285284290